Far southern GLD development?

2045z_vis2100z_vis

It hasn’t amounted to anything yet, but we’re watching a cloud that’s gone up in the far southern end of our CWA. The two images are from 2045z and 2100z. CI hasn’t flagged it at this time, but having the 1-min imagery really helped us see how it was growing – I picked these two images because they were 15 minutes apart and indicate how much that spot has grown in that time.

Jason Williams & CoonieCatEye

Tags: None

Hastings, NE (SVR #2): Losing ProbSevere guidance due to cell merger

Was monitoring a developing cell mainly with base/dual-pol data. Was on the edge of a warning decision and looked to ProbSevere for added confidence. During the 20:08z scan had a ProbSevere of 54% (fig 1) with no growth of glaciation rate. During the subsequent 20:10z scan the cell merged with the northern cell and quickly jumped to 84% (fig 2). Lost confidence in this prob due to the merger. Ended up warning on base data info along and just the trend of the increasing ProbSevere from the previous scans. –Cattywampus

2008_ProbSVRFig 1: 20:08z ProbSevere 54%

2010_ProbSVR

Fig 2: 20:10z ProbSevere 84%, Cell Merger

Tags: None

CI Success Story

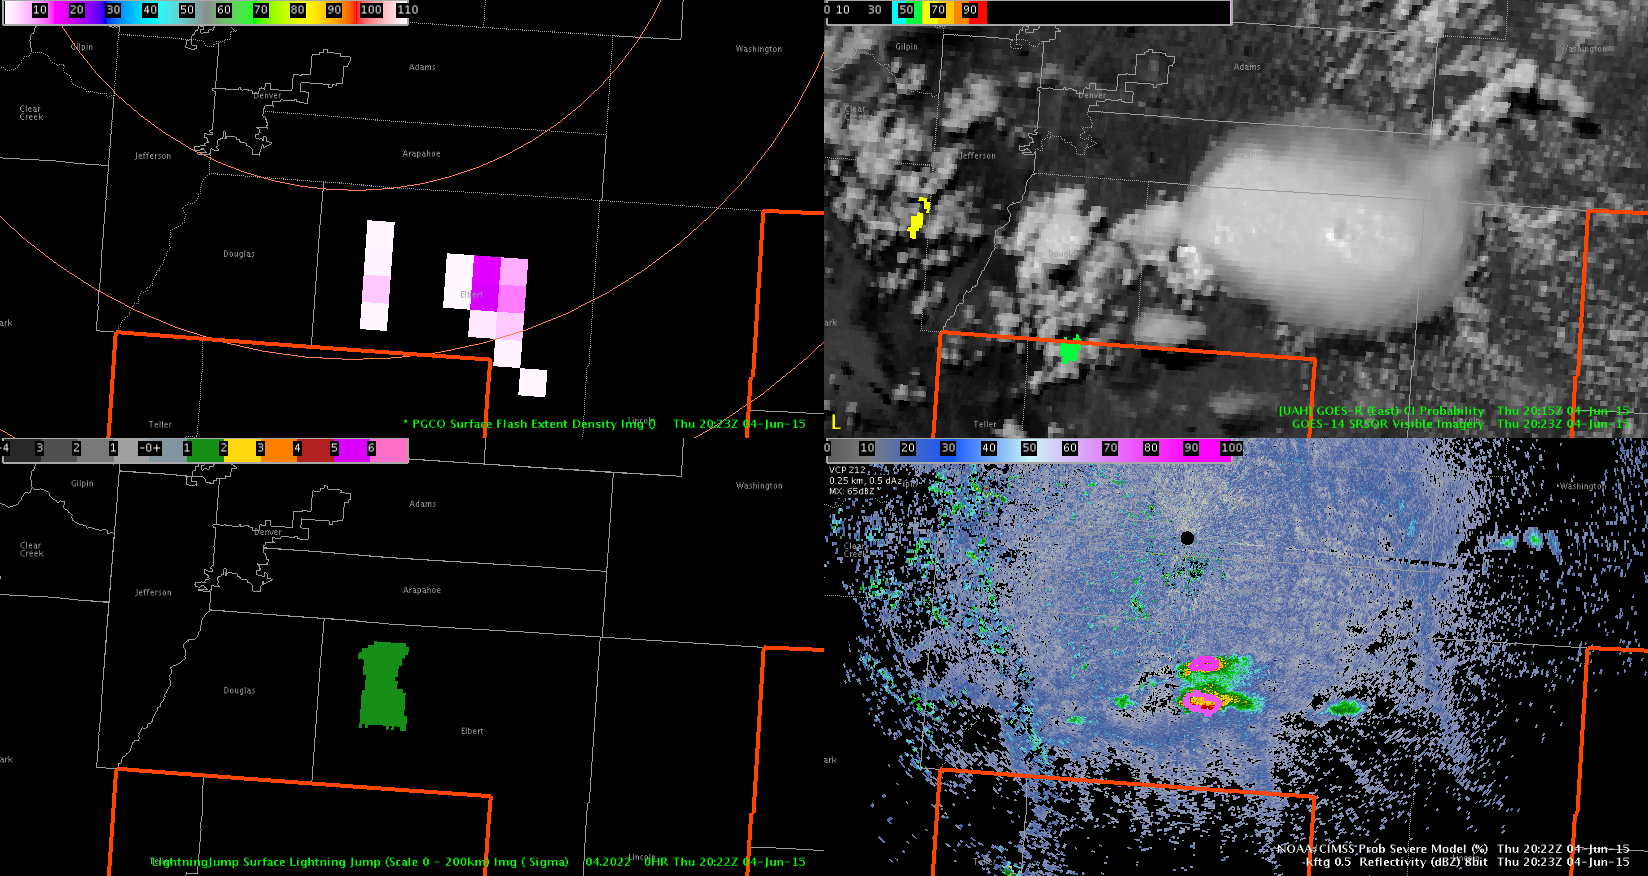
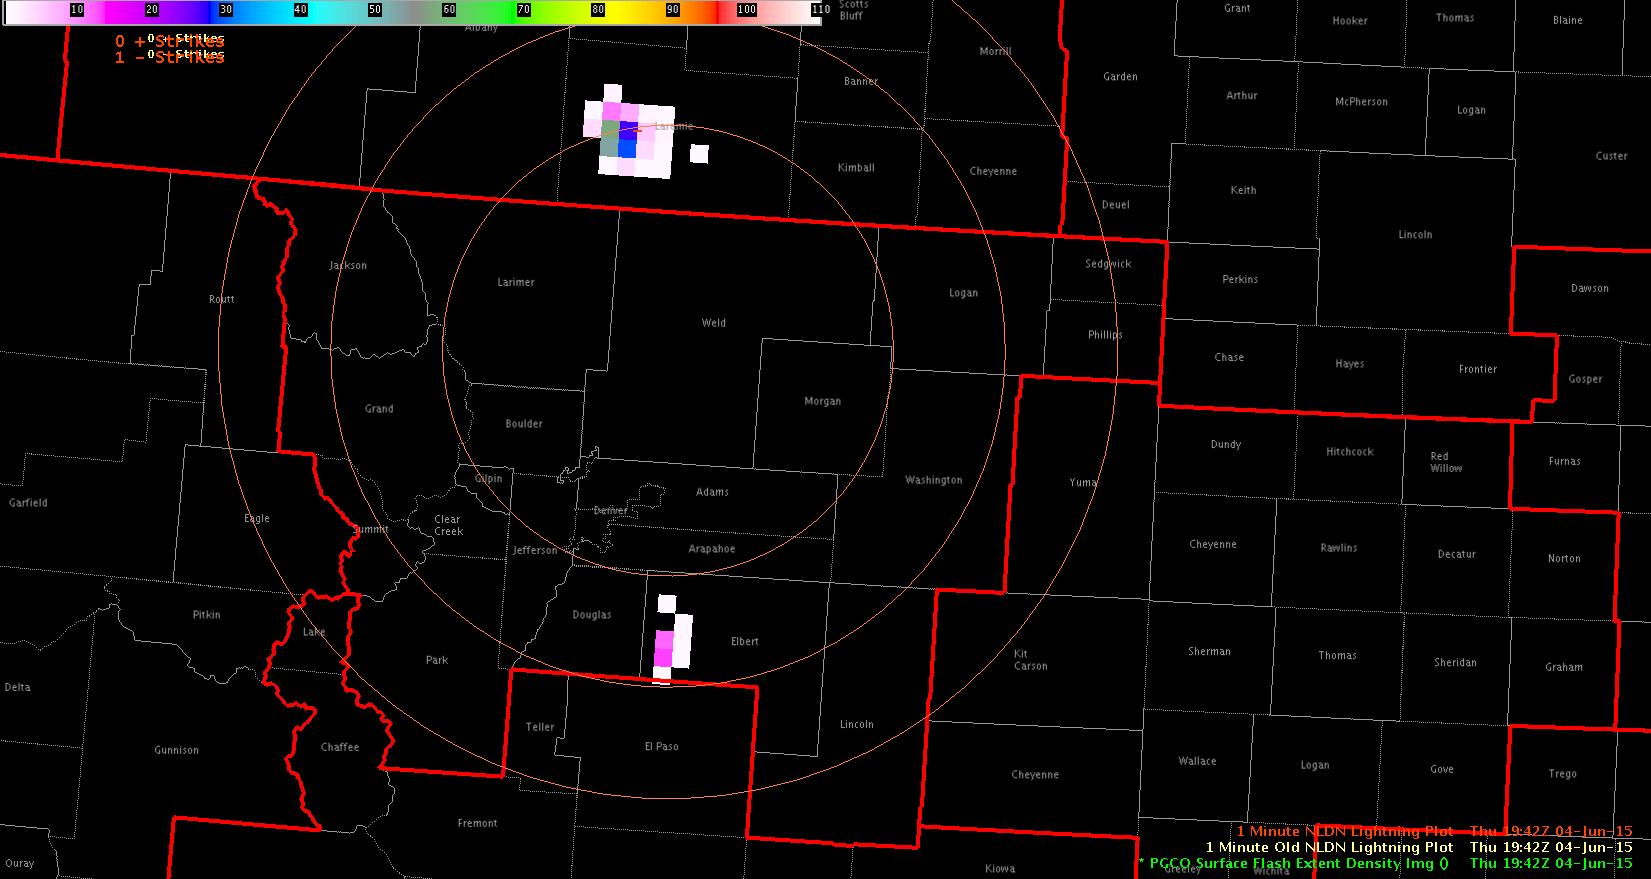
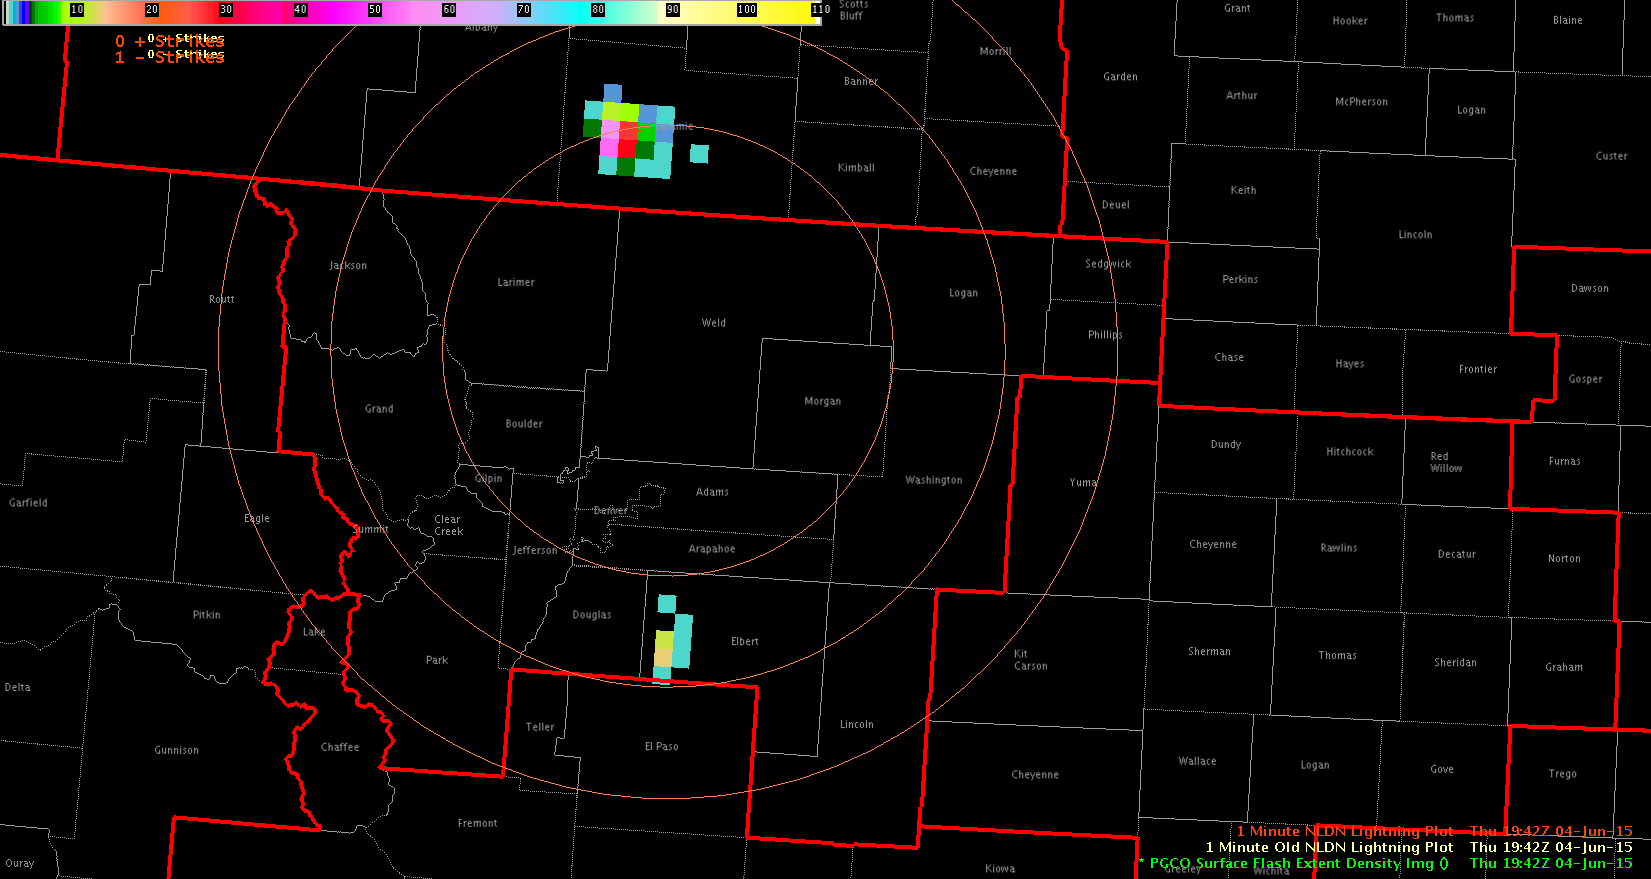
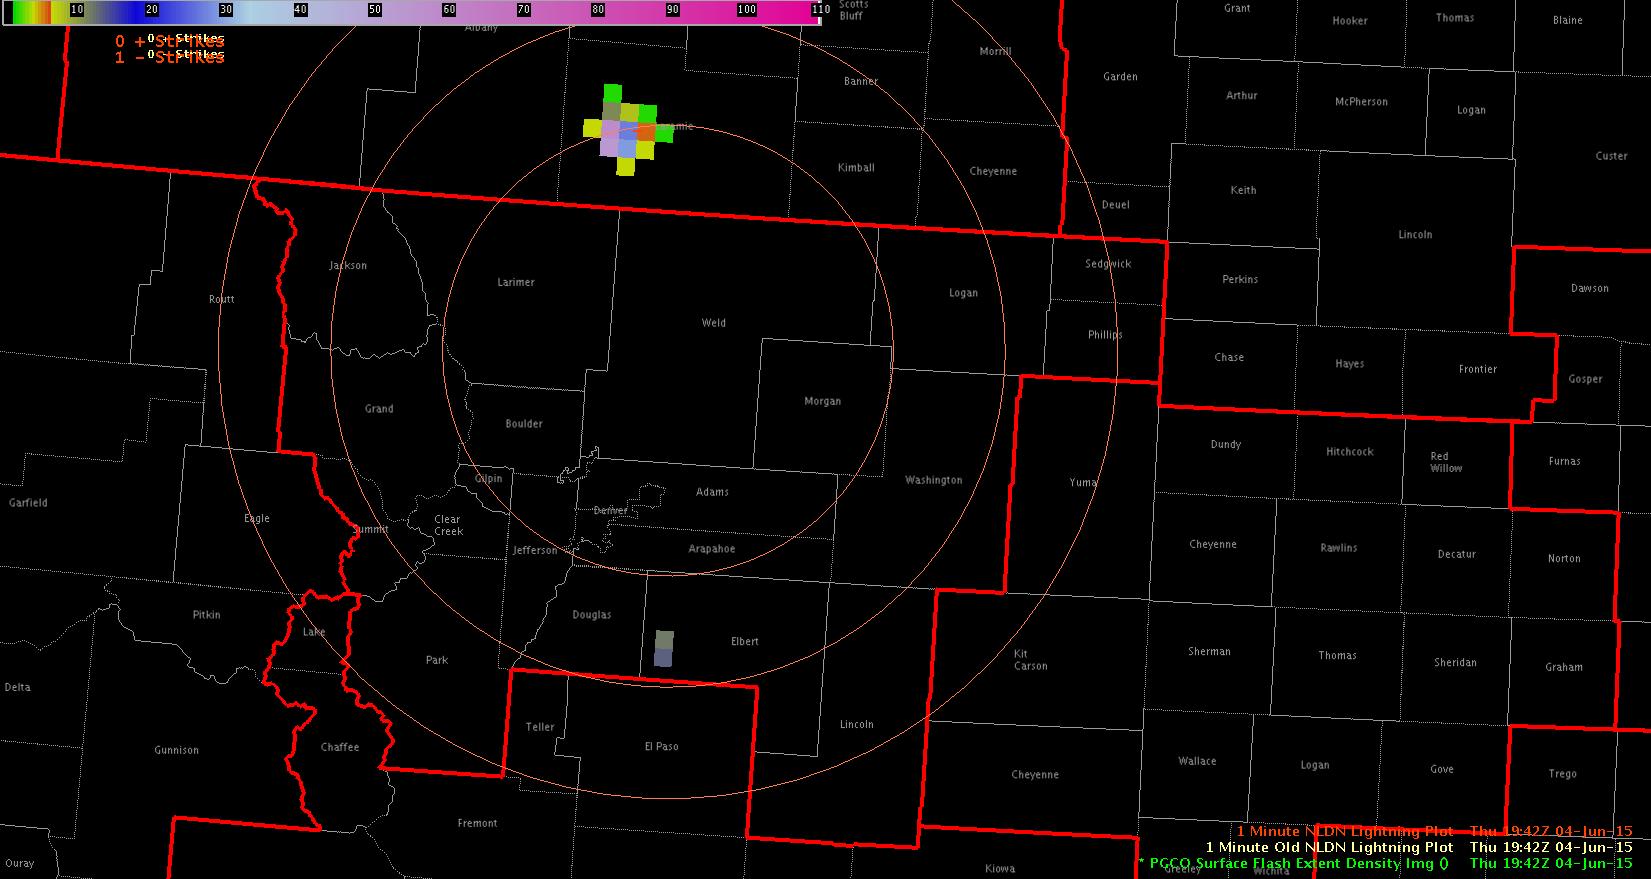
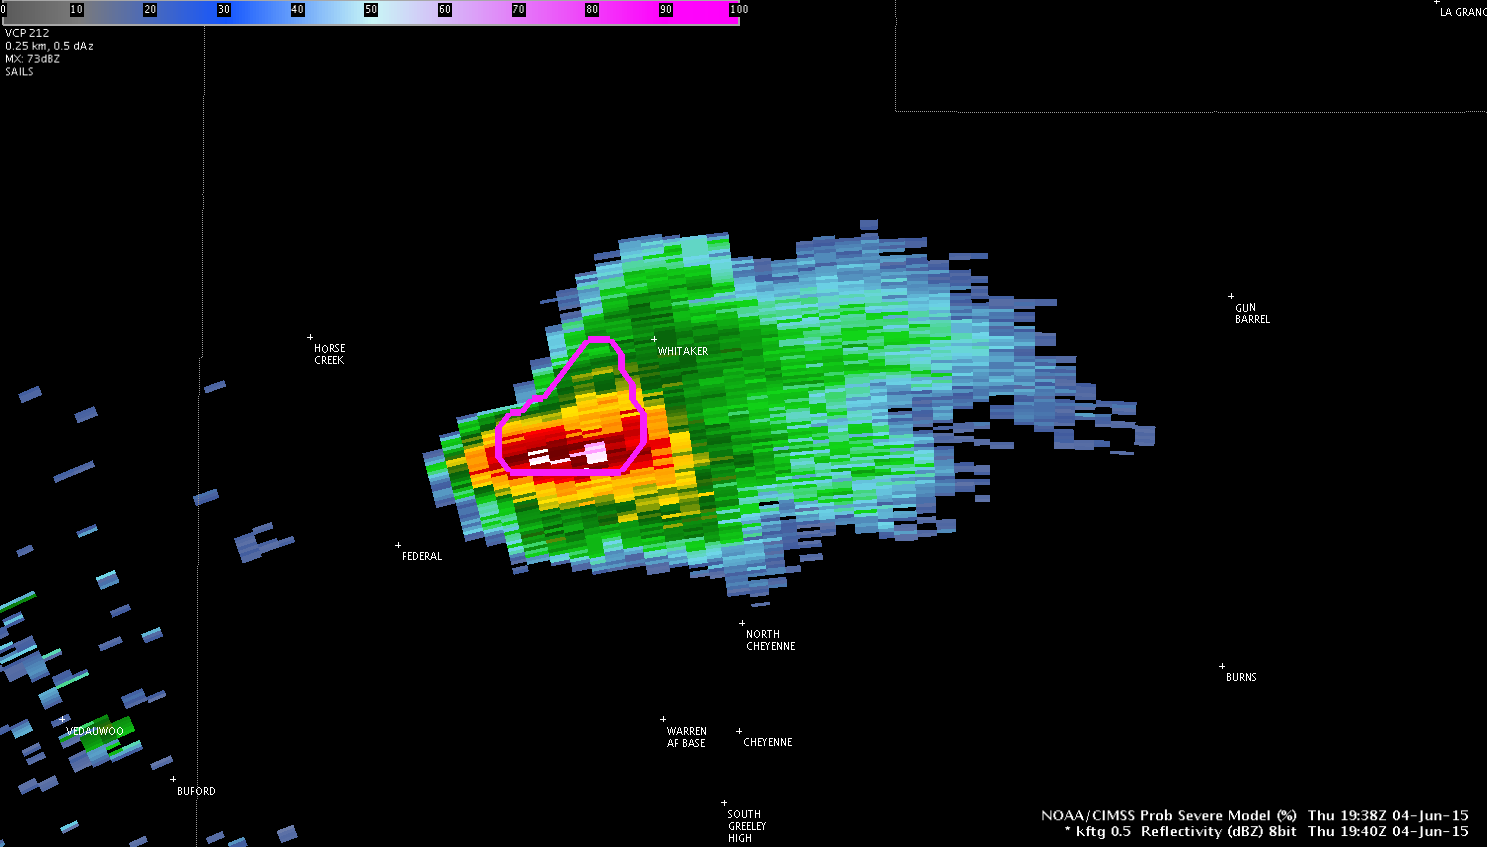
This is an example where the CI product performed very well. At 1915Z, the CI probability increased from nothing to 61% (yellow) and 70% (yellow-orange) over two spots in the Boulder FA. In the next satellite scan (15 min later), you can see the significant cloud growth that occurred in the exact area where the 70% CI product had been. This storm continues to grow in the proceeding images and eventually becomes severe. The cell that showed 61% CI also intensifies significantly, but it takes a little longer (about an hr).

I was pretty pessimistic about the CI product after using it yesterday in the southeastern part of the country where there were widespread discrete and multicells. There were so many areas that the CI picked up on that it just become too busy to be of much use to me. However, my faith has been restored in the CI product after seeing how well it is performing out west today. I think that the utility of the product will depend on the type of the convection expected and the coverage of the expected convection.

CIsuccess

(Click image to see animation)

-Helen Hunt

Tags: None

ENI cell tracking

Cell tracking is inherently difficult, here is an example of how it can lead to conflicting data.Screenshot-CAVE:GID - D2D -3 Notice the two cells to the in the upper left image.  These cells congeal in the image below. Screenshot-CAVE:GID - D2D -2


We both had timeseries set on the individual cells above.  When they combined the resulting time series of each did not seem to match each other.

TF_timseries Screenshot-CAVE:GID - D2D -1

What this means is that when you are looking at time series of merging storms, you will need to reset your point for the time series to work and be aware of what is going on when you use the data.

MacGyver and Cattywampus

Tags: None

Ultimate 4-Panel Display

I call the image below the ‘Ultimate 4-Panel Display’. I probably would have incorporated the ENI data somewhere into my display, but I wasn’t allowed to use it. This 4-panel might be a good recommendation for forecasters.

Upper Left: PGLM Surface Flash Density w/ range rings

Upper Right: GOES 1-min Vis w/ CI

Lower Left: Lightning Jump

Lower Right: 0.5o Reflectivity w/ Prob Severe

4Panel

-Helen Hunt

Tags: None

Clouds inhibiting convective initiation…for now (GLD)

GOES-14 1-minute satellite imagery showing bands of cumulus clouds covering most of the CWA early this afternoon. This appears to be inhibiting convection, at least for now.  However, some breaks in those clouds may be moving into eastern areas from KMCK to KHLC.  These areas will need to be monitored for possible towering cumulus development over the next 1-2 hours.

The 1-minute satellite loop shows this nicely.

GLD_1min_Vsbl_Loop_4Jun15_2008Z

(Click to animate above image.)

CoonieCatEye/Jason Williams

Tags: None

Comparing PGLM Color Tables

When comparing the default, LMA1 and LMA2 color tables for viewing the PGLM lightning data, I found that I don’t really like any of them. All three images below show the PGLM data at 1942Z using the various color table options. The highest pixels (58 & 53) in the northern storm show up as the the gray/green colored pixels which are in the center of the default color curve. I would have assumed that the bolder blue hues would have been the higher values in this case, which is why I don’t care for the default color table. For the same reason, I don’t like LMA1 or LMA2 either. Improving the color table will be important moving forward with this product.

PGLMdefaultDefault

PGLM1LMA1

PGLM2LMA2

-Helen Hunt

Tags: None

First SVR for GID

Probsevere jumped to near 70% with this storm.  Large core of 50+ dBz at 30kft.  The -30 is around 24kft based on the LBF sounding.  There was also a jump in lightning according to the ENI timeseries and data.  Decided to issue a warning for this storm.


Screenshot-CAVE:GID - D2D

MacGyver

Tags: None

Seeing between sfc obs with LAP CAPE

currentsCAPE

We don’t have many obs in our CWA, but we do see that temps are around 90F just outside our CWA. Looking at LAP CAPE, we do see a CAPE gradient not just to our SE but also within our SE CWA. This does make one wonder if warmer temps have indeed made it into our CWA that we aren’t able to see with the lack of obs, but can infer from the higher CAPE values.

Jason Williams

Tags: None

Severe indicated cell produces first HWT warning near Cheyenne

cys_svr_0604

vii_capture

A prodigious lightning producer early developing north of Cheyenne has a CIMSS indicated prob severe nearly 90 percent.  The cell is exhibiting strong inflow along with sustained high lightning levels as shown by the GLM Mapper, PGCO Surface Flash Density regional mapper and MRMS Verically Integrated Ice (click second image for loop).

John Pendergrast

Tags: None