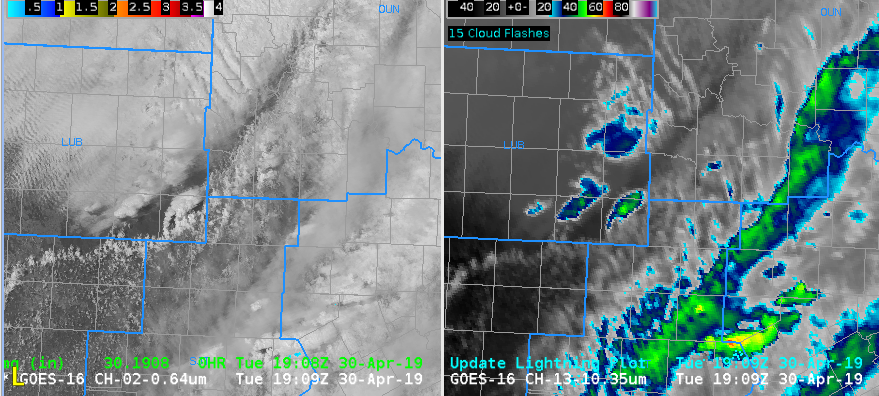
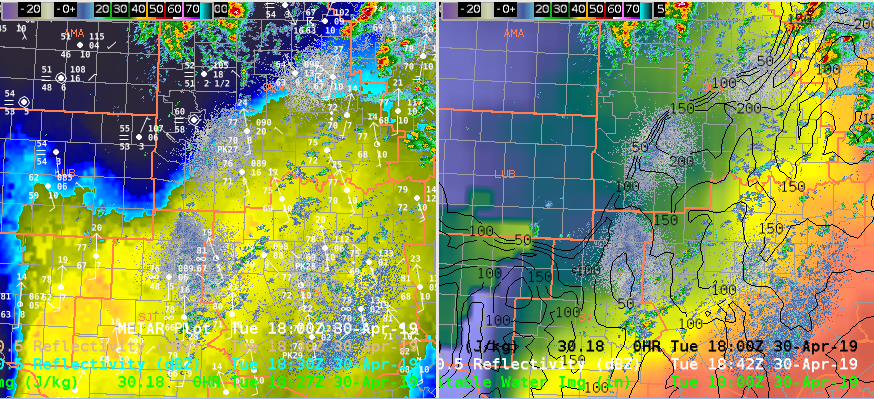
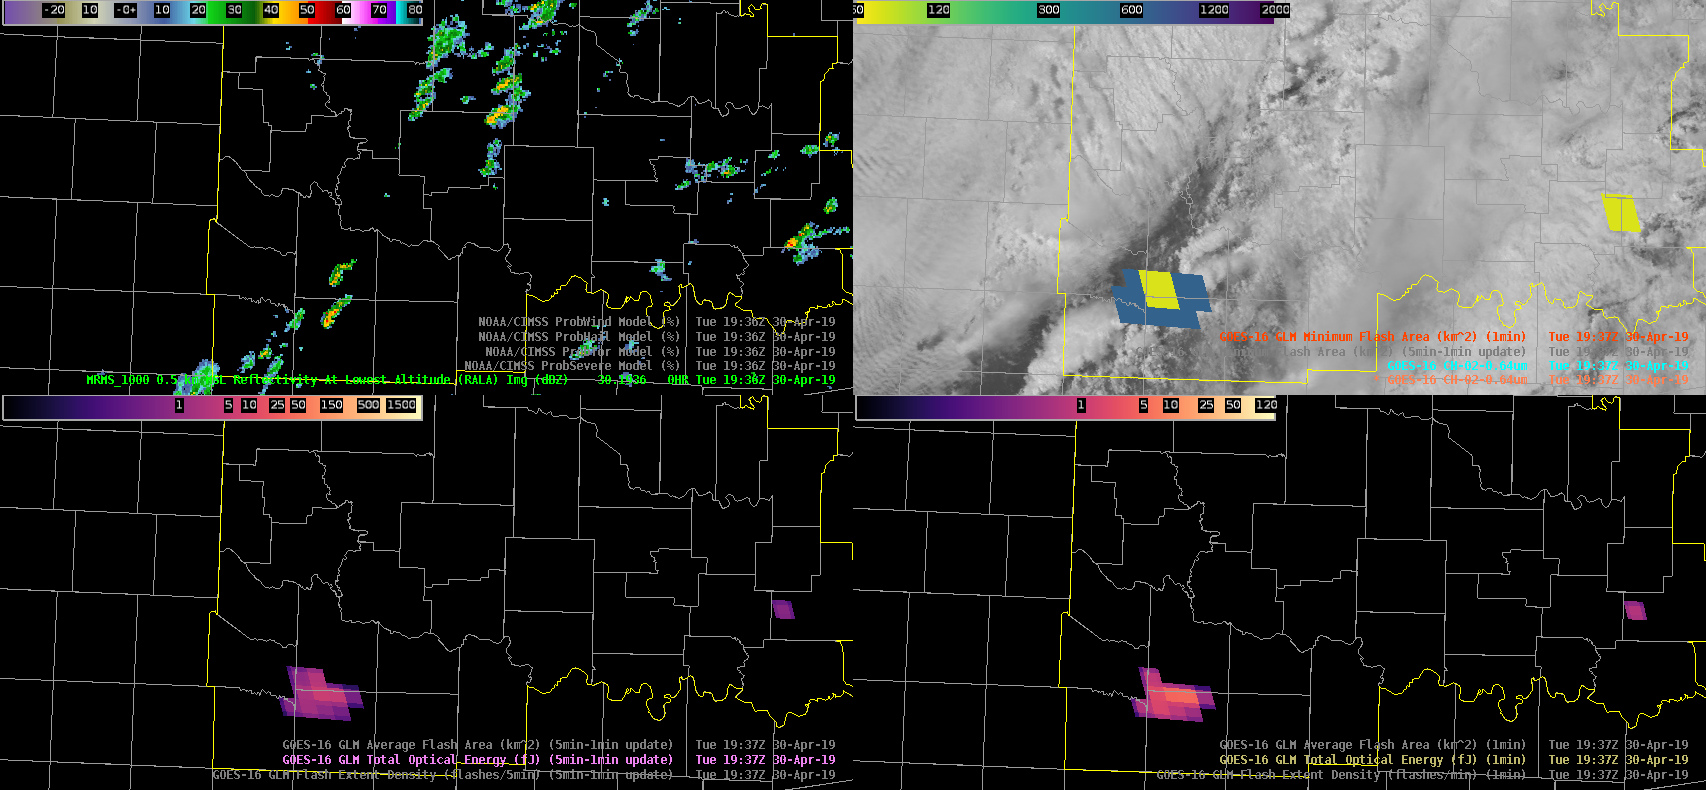
Beginning to see CI in the southwest portion of OUN’s CWA. ProbSevere has progged a 3-4% tornado probability for two areas: the SW storm and a few weaker/young storms in the central CWA. GLM minimum flash area along with total optical energy clearly indicate that the SW storm is the most promising of the two with more persistent updraft(s). Subsequently, 0-2km merged AzShear has perked up with the storm in the southwestern portion of the CWA. Given the storm’s favorable environment (ample 0-3km CAPE, bulk shear, and SRH), this storm warrants watching. Based upon the combination of GLM data, ProbSevere/AzShear, and 1 minute satellite imagery, a forecaster can quickly hone in on the most pressing storms at the moment.
–Stanley Cupp
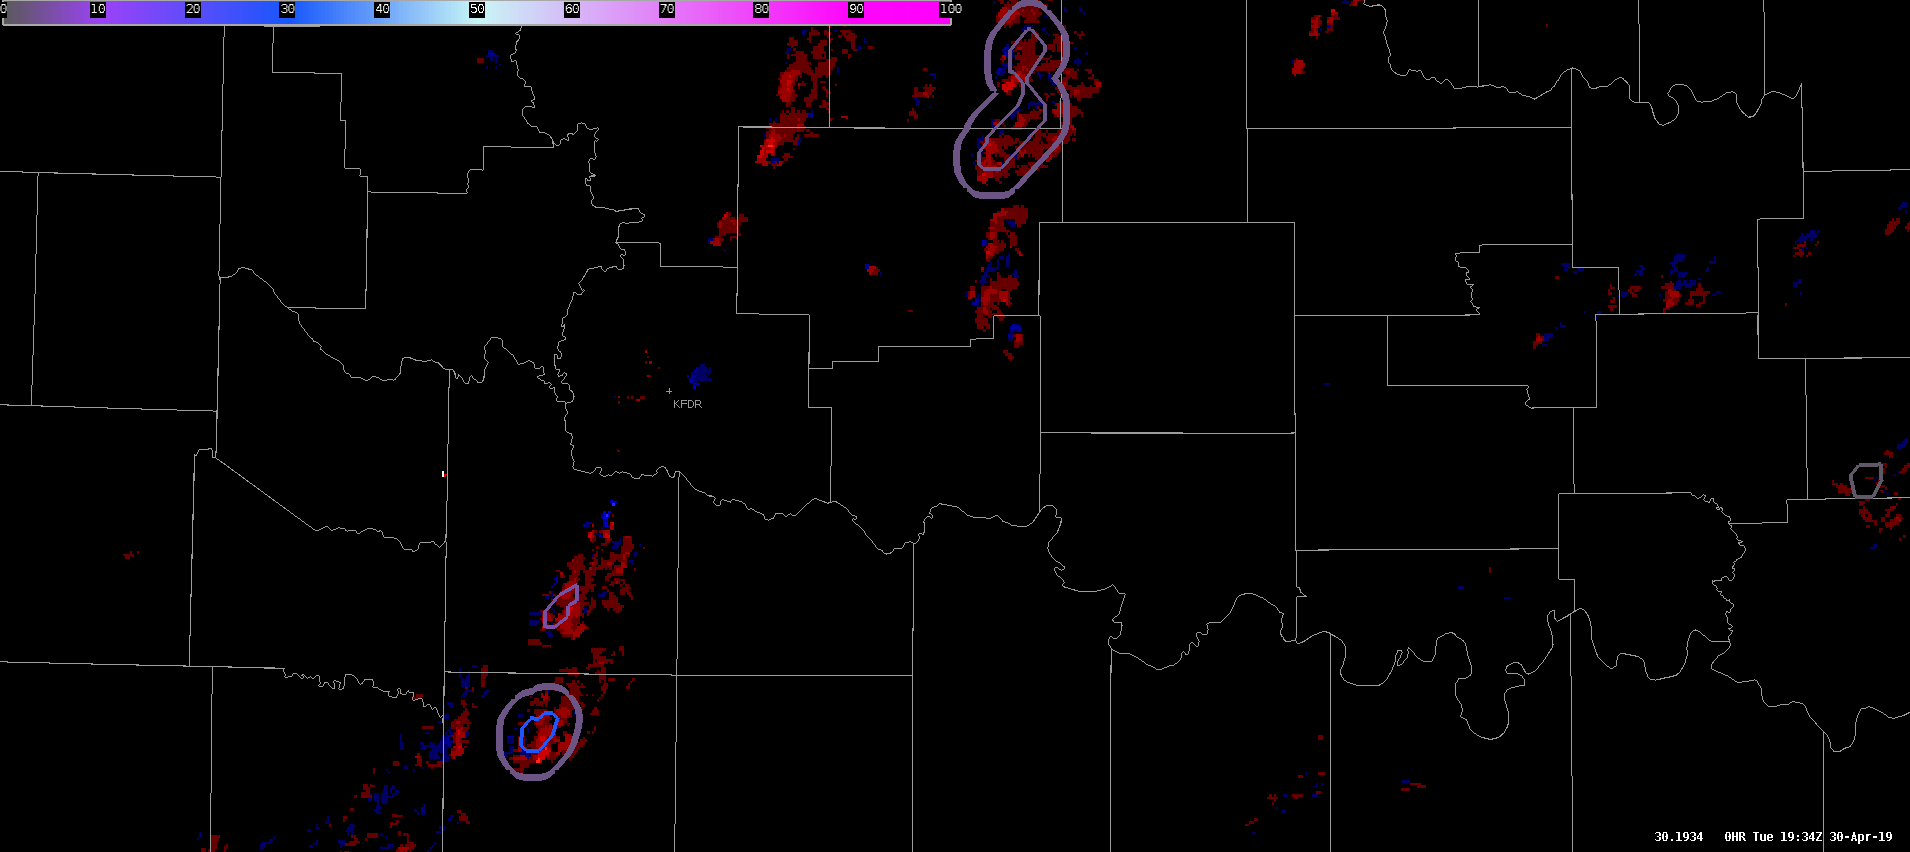
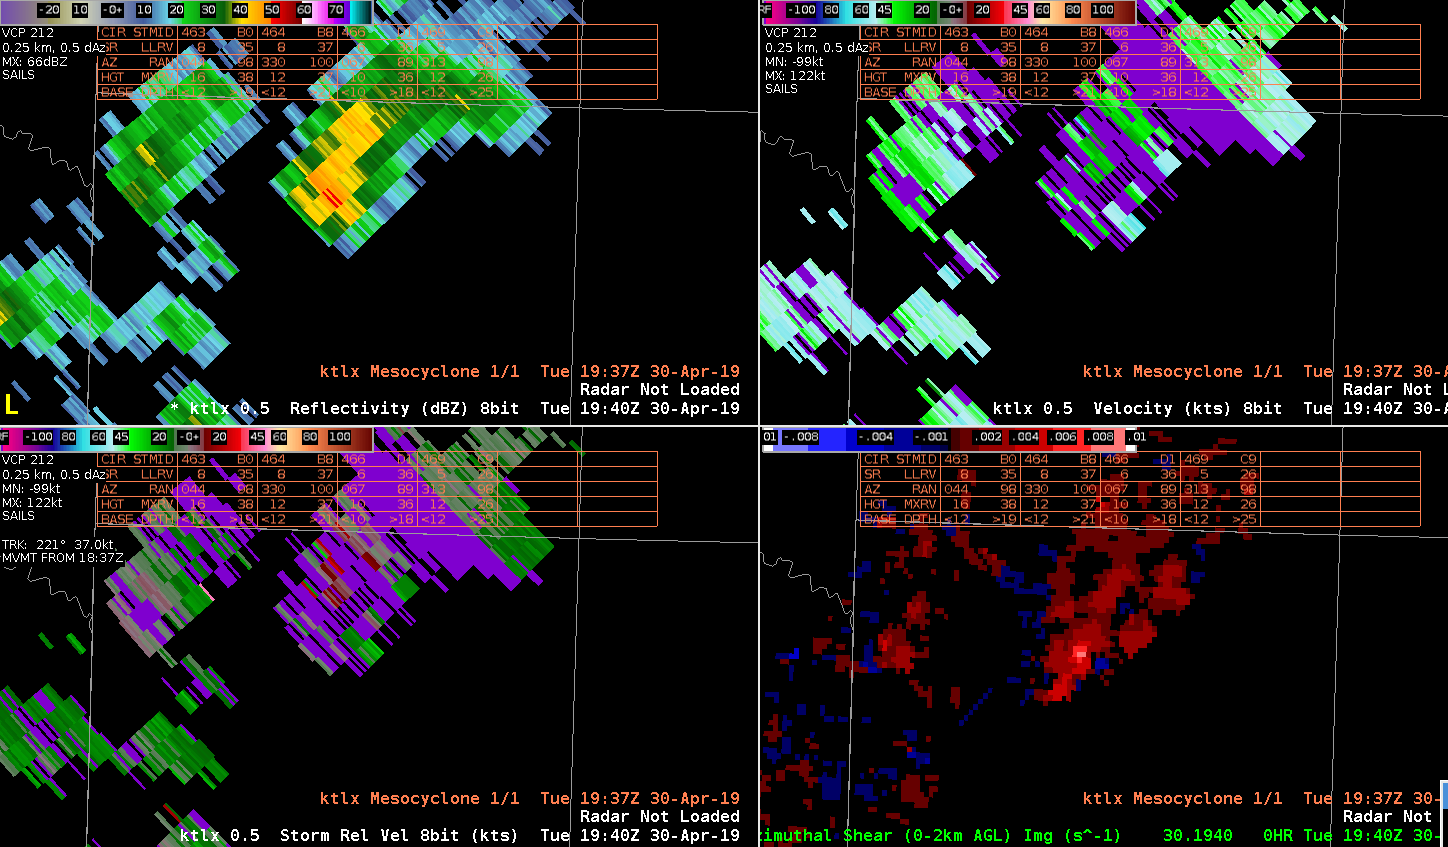
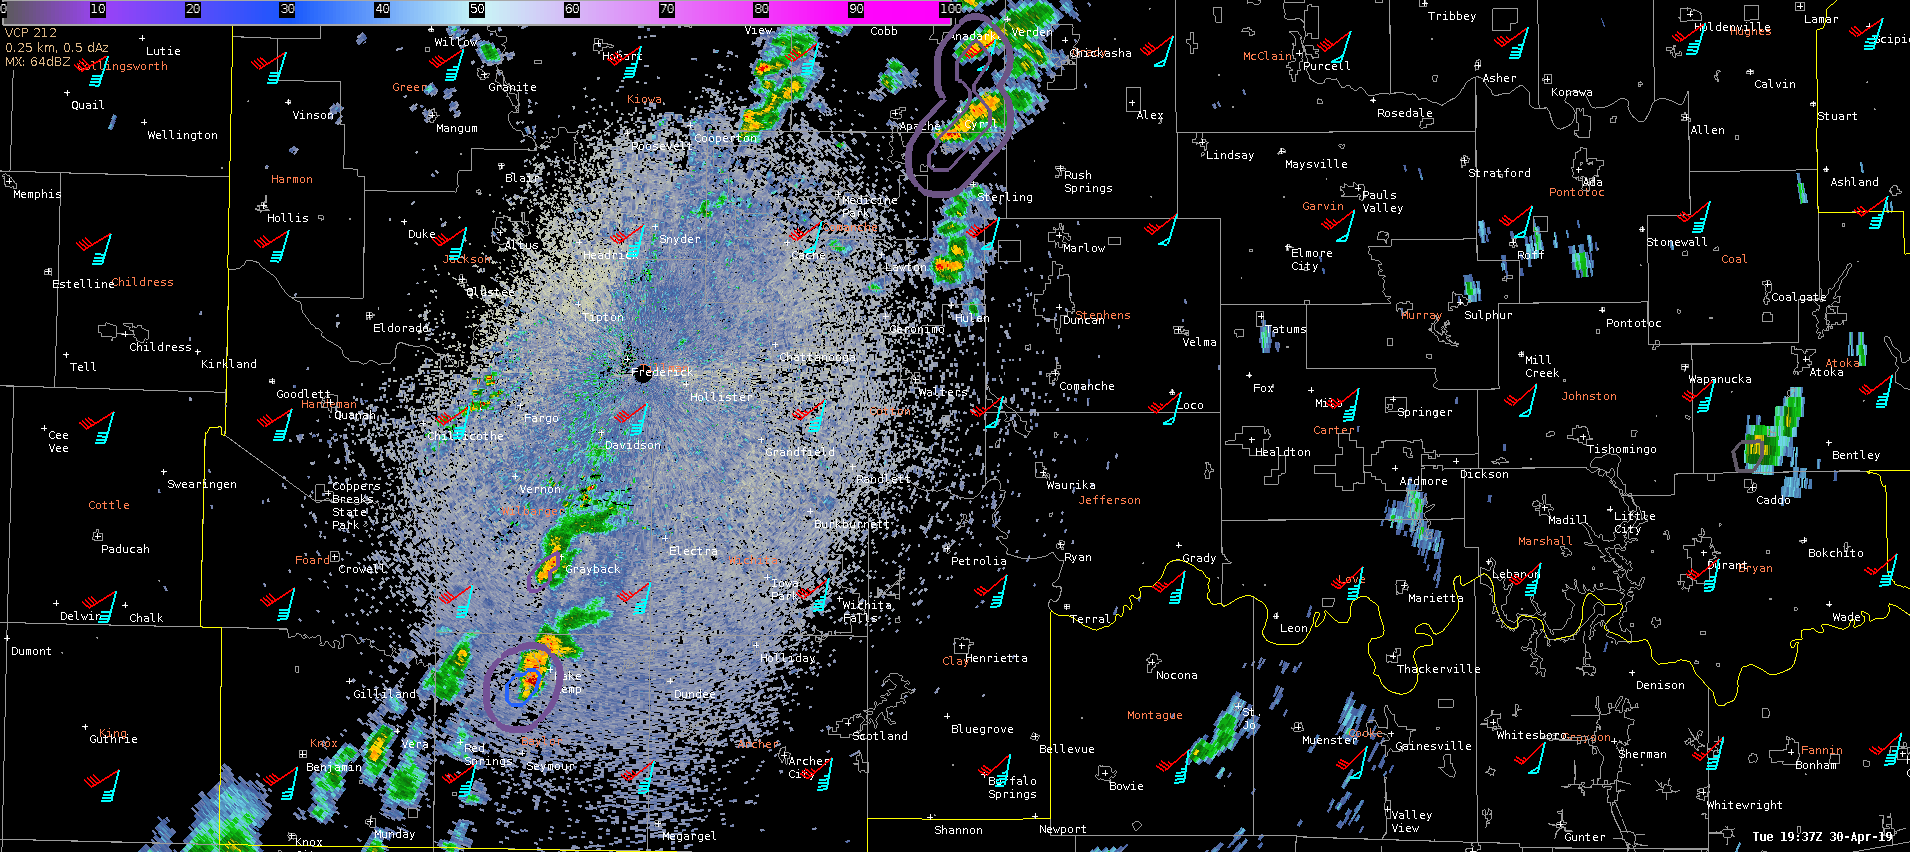
1937z KFDR base reflectivity with ProbSevere overlays (double contour –> tornado prob progged)
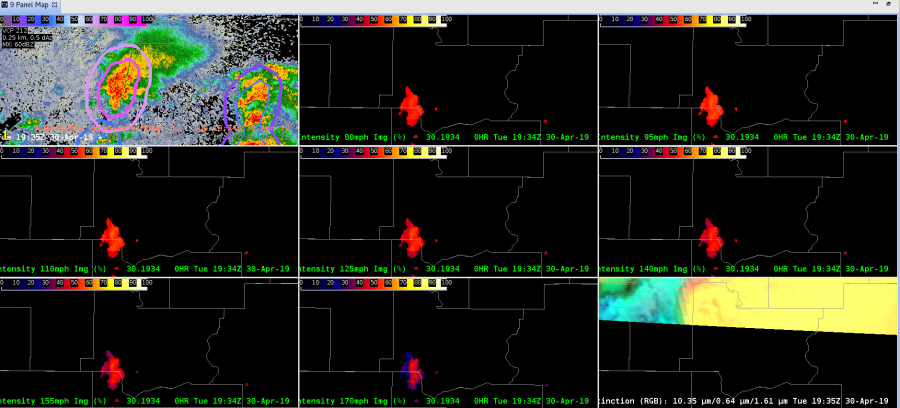
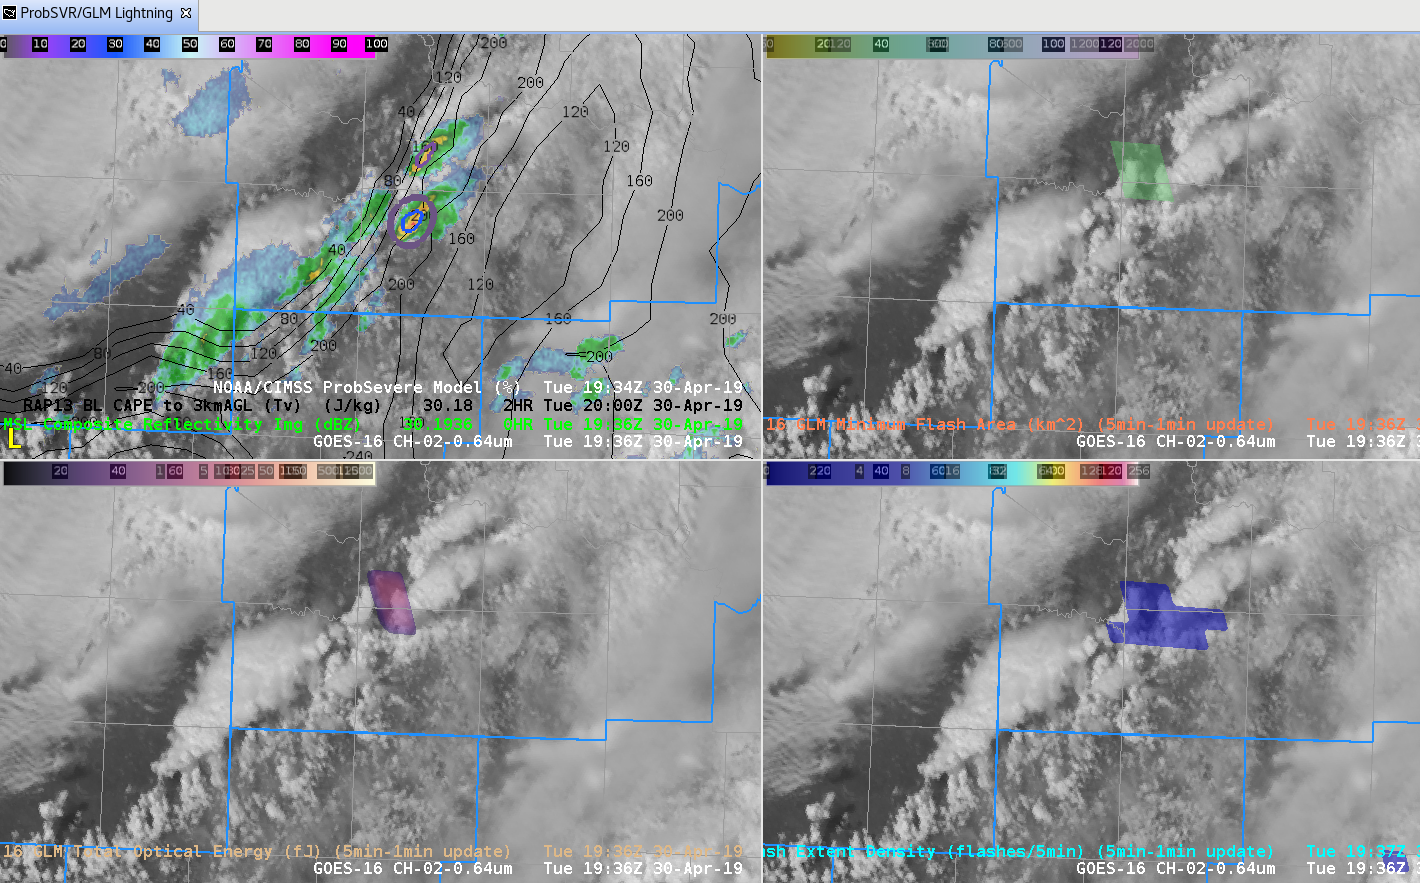
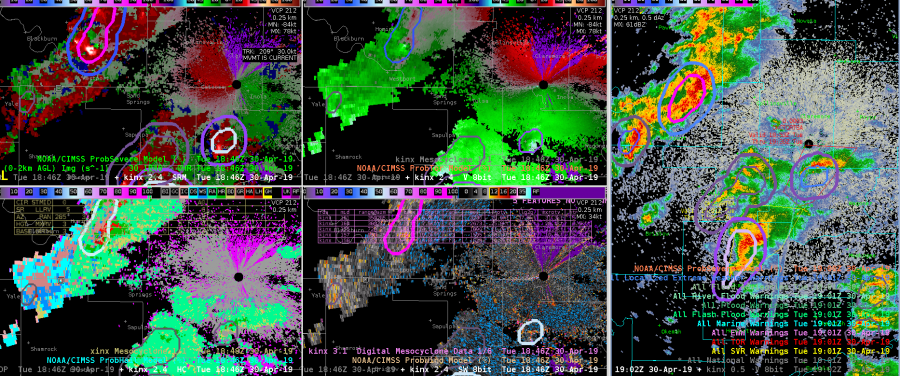
Top left: MRMS RALA; Top right: visibile sat plus 1 minute minimum flash area; Bottom left: 5 minute total optical energy w/ 1 minute updates; Bottom right: 1 minute total optical energy
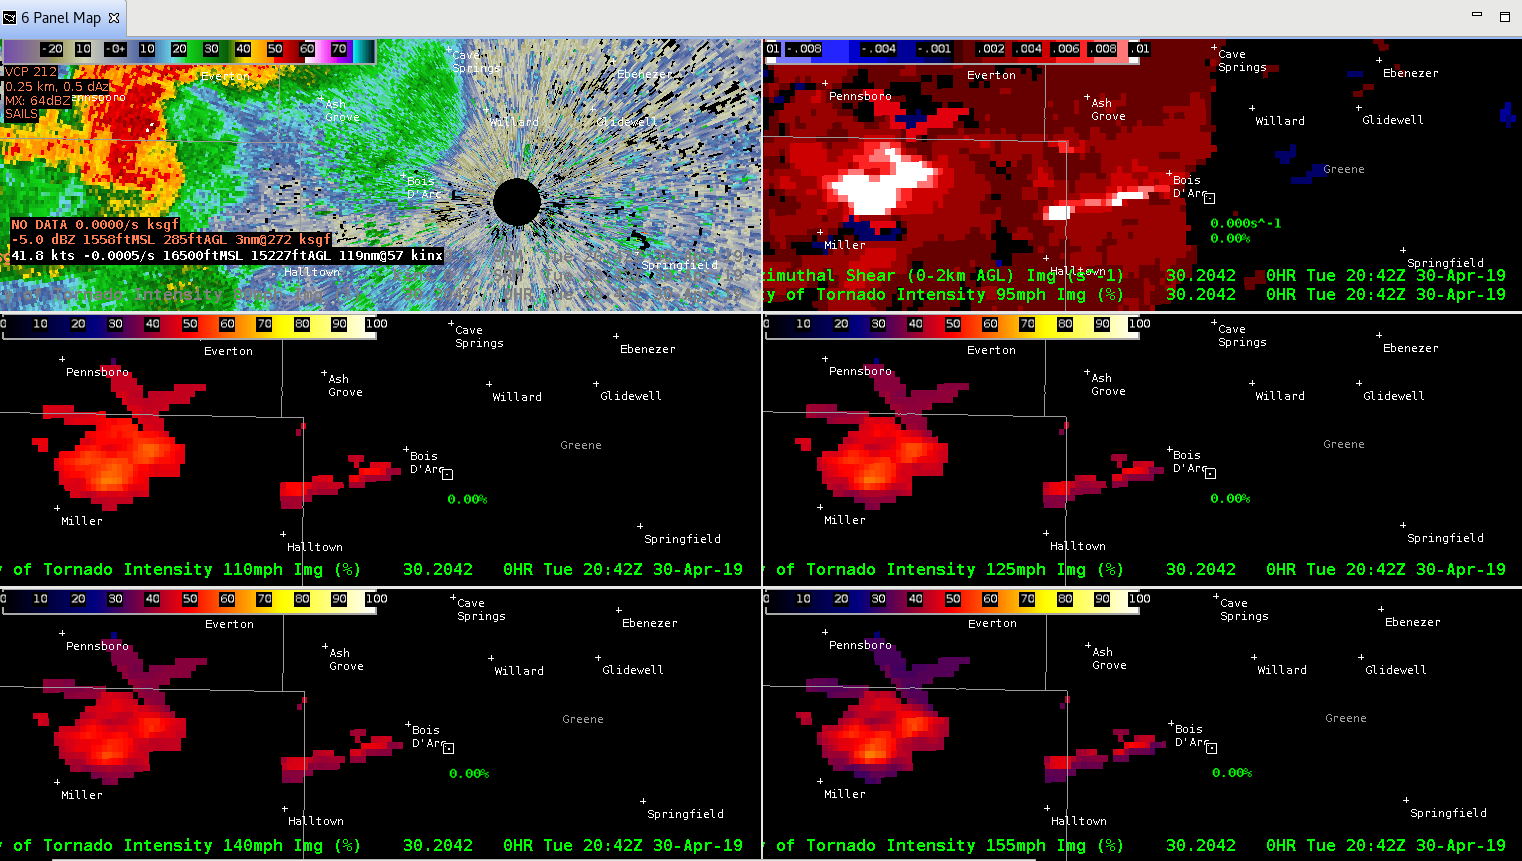
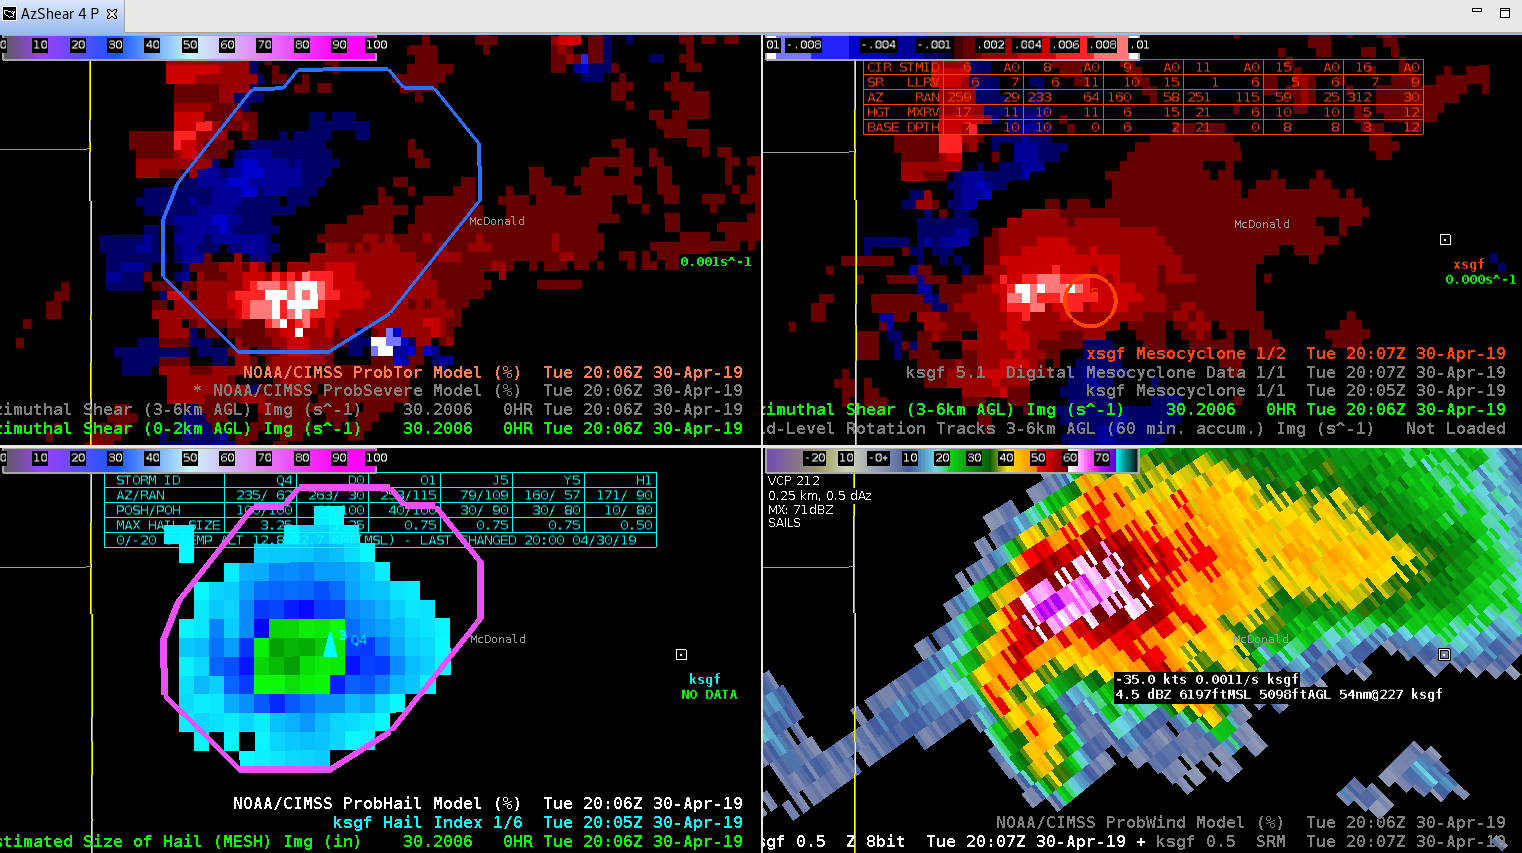
0-2km merged AzShear