An official website of the United States government
Here’s how you know
Official websites use .gov A
.gov website belongs to an official government
organization in the United States.
Secure .gov websites use HTTPS A
lock (
) or https:// means you’ve safely connected to
the .gov website. Share sensitive information only on official,
secure websites.
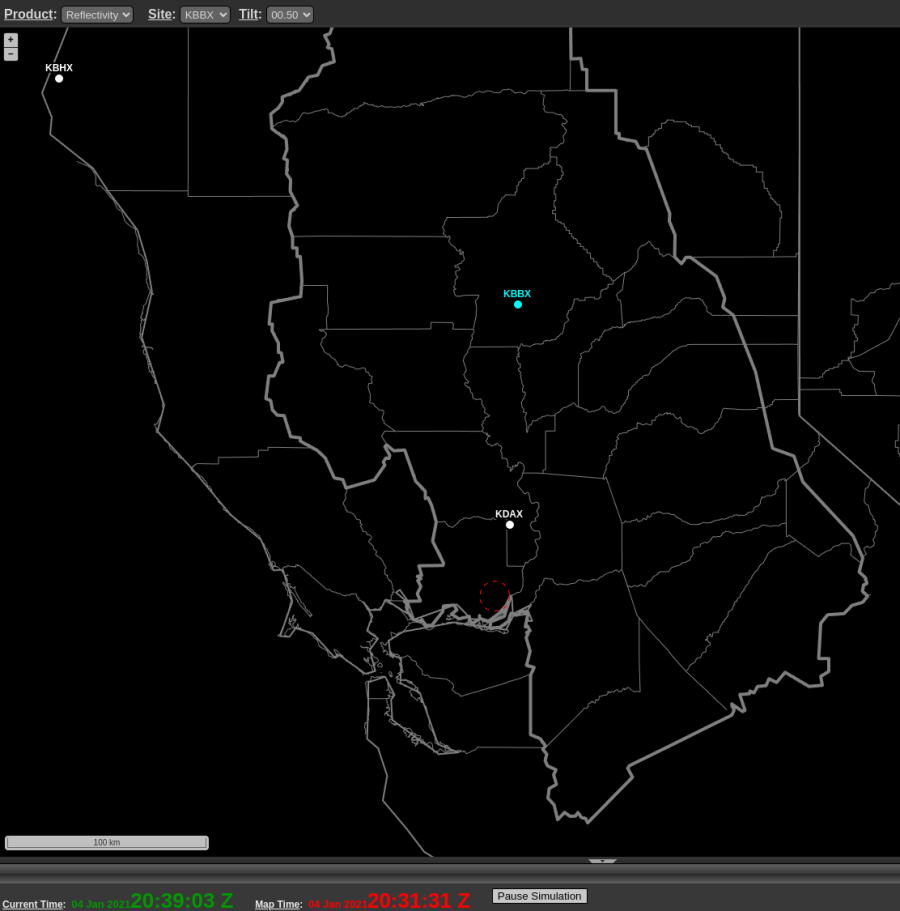
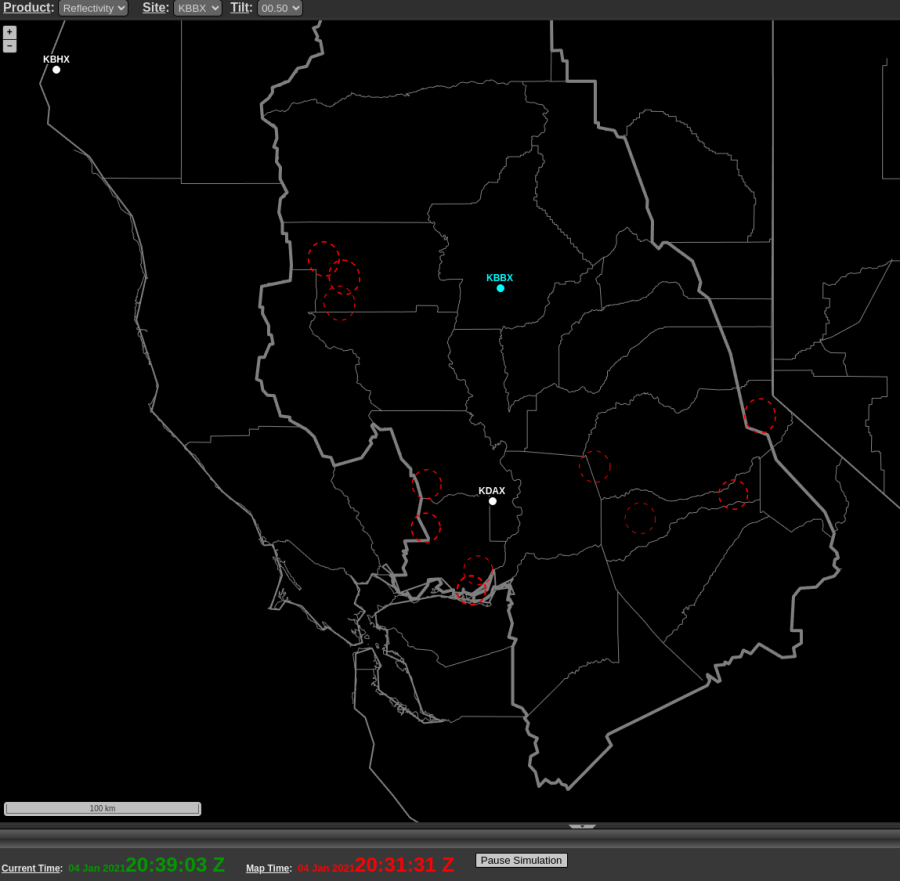
Comparison of TORP object markers in Central California.
First image is the PHI tool with “Display Aggressive Filtered” turned off.
Second image is the PHI tool with “Display Aggressive Filtered turned on.
Most of the object markers align with the edges of the mountains and it’s highly likely terrain blockage clutter is resulting in these erroneous markers.
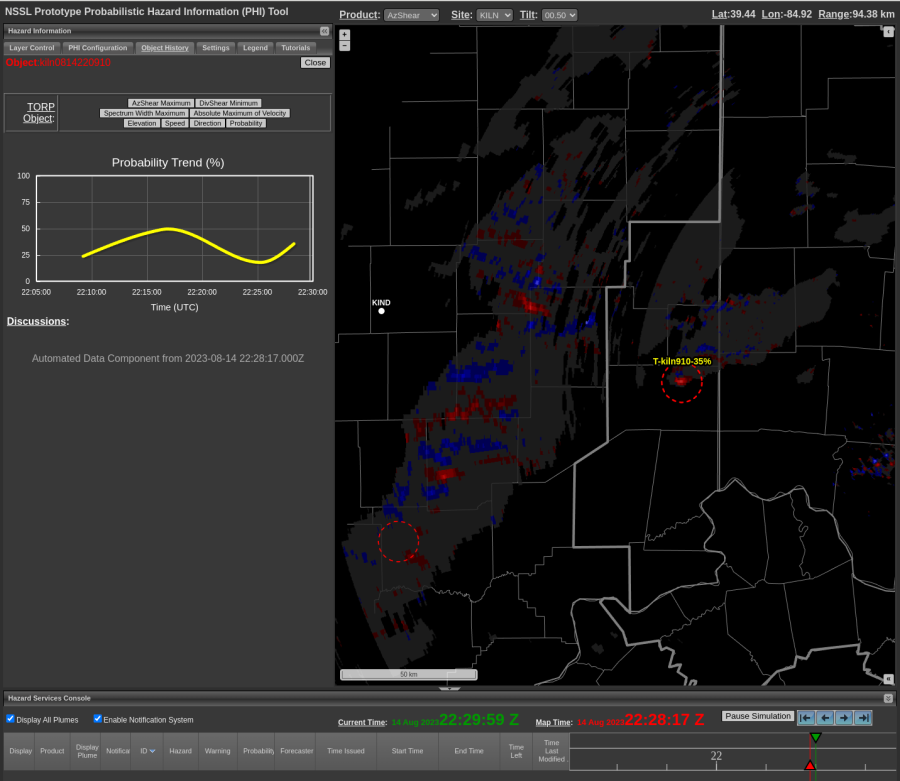
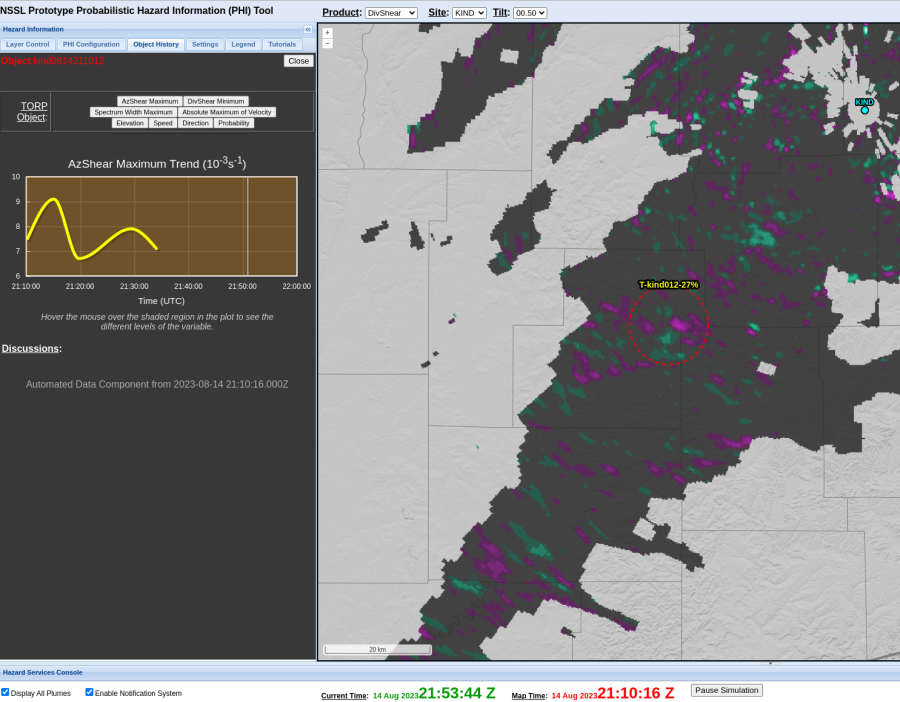
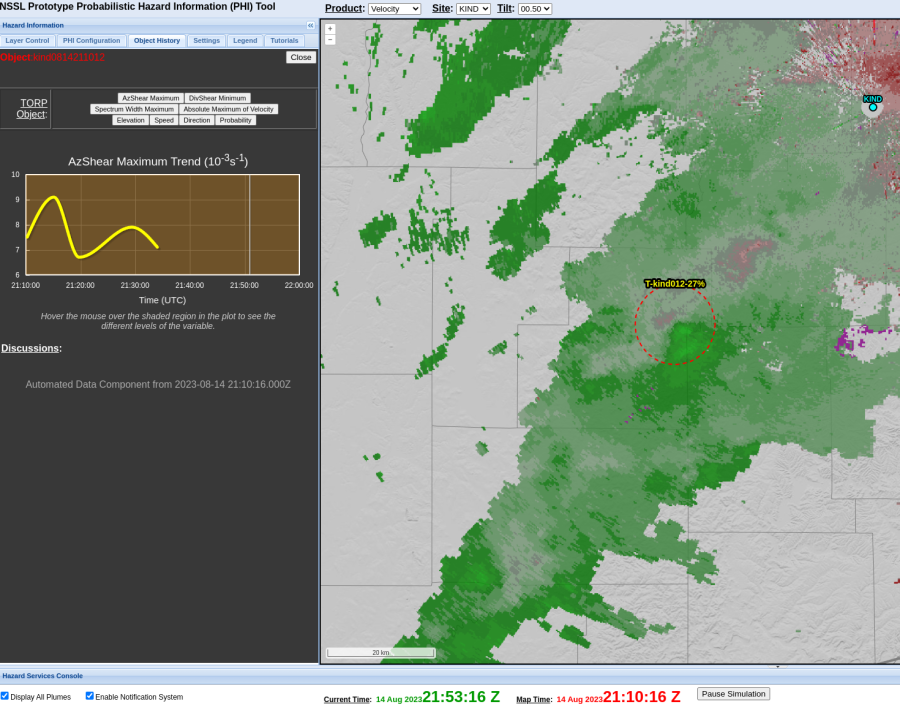
AvShear plot at 2228z and a TORP trend graph. A tornado was reported around 2230z.
This example is from a shallow supercell case. The cell exhibited weak but grdually increasing Vrot, but Vrot was generally less than 30 knots. AzShear (pictured) and TORP were useful in capturing the uptick in rotational intensity. The decision to issue a tornado warning was made around or just prior to 2215z (but AWIPS hiccups prevented it from going out until closer to 2225z). The decision to warn was aided by a rotational signature in AvShear (the image below is from 2228z, not the time that aided warning decision) and TORP increasing to between 40-50%. A tornado was reported around 2230z.
Looking back through the data after receiving the tornado report at 2232, there was a peak in Torp probability of 50% around 2217 meaning if that threshold was used as a decision point of going with a warning, given other radar data supported a warning, it would have provided 15 min of lead time. VR Shear never got to 20kts and while there was a couplet the values were not that impressive and no strong gate to gate signature. Also of note the DivShear continued to show a stronger signal with higher values than AzShear in this weaker storm case. I think this case also shows the importance of mesoanalysis and knowing that there was a boundary (warm front) this storm was attached to.
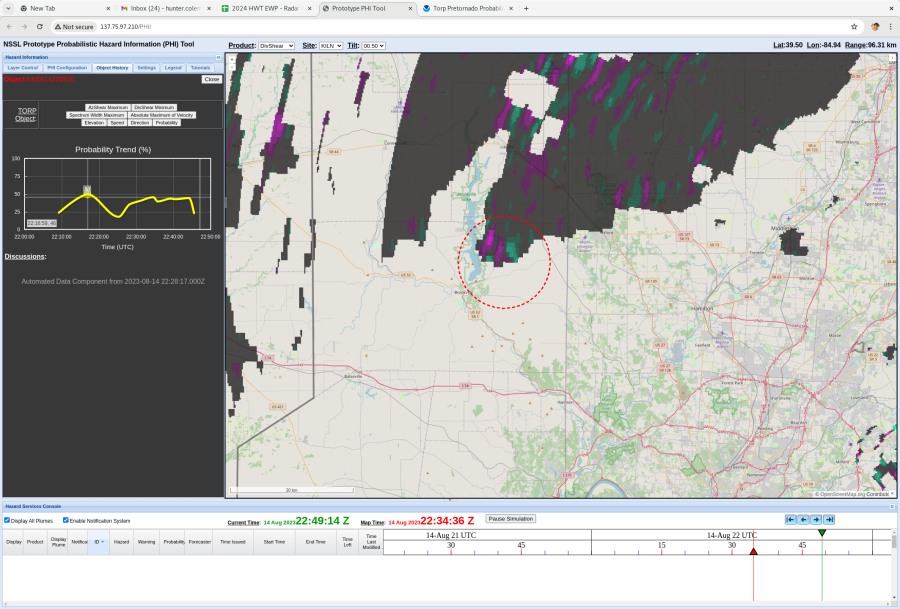
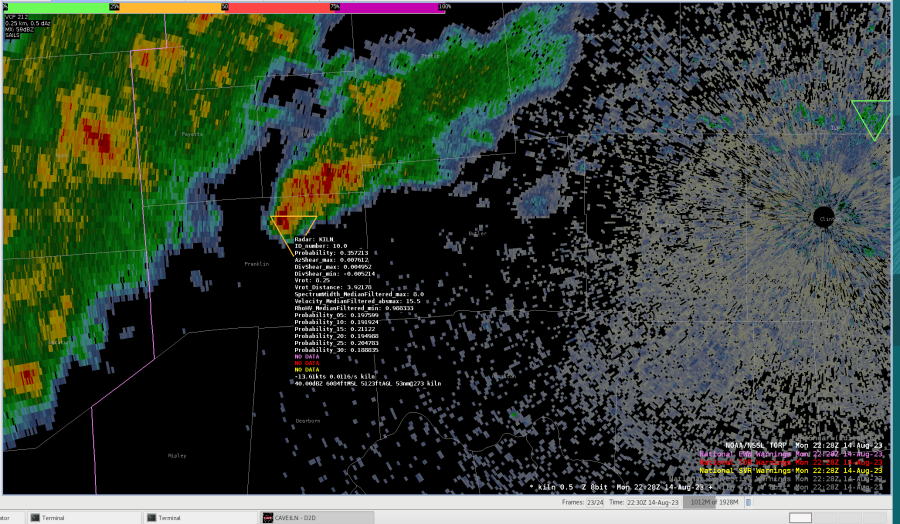
A new plugin was made available to us for this afternoon case that adds pretornado probabilities from 5-30 min at 5 min intervals as seen in the sampling on this image. This is interesting information that I am curious to see how it does through this event. This would be great to have available to warning forecasters if it shows skill.
A storm that has been meager to this point along what we believe to be the warm front is picking up strength and signals in the DivShear and to a lesser degree the AzShear caught my eye around 2210 UTC. There is a developing weak velocity signature as well but this might be the first time I have seen the DivShear pick up on a signature more aggressively than AzShear.
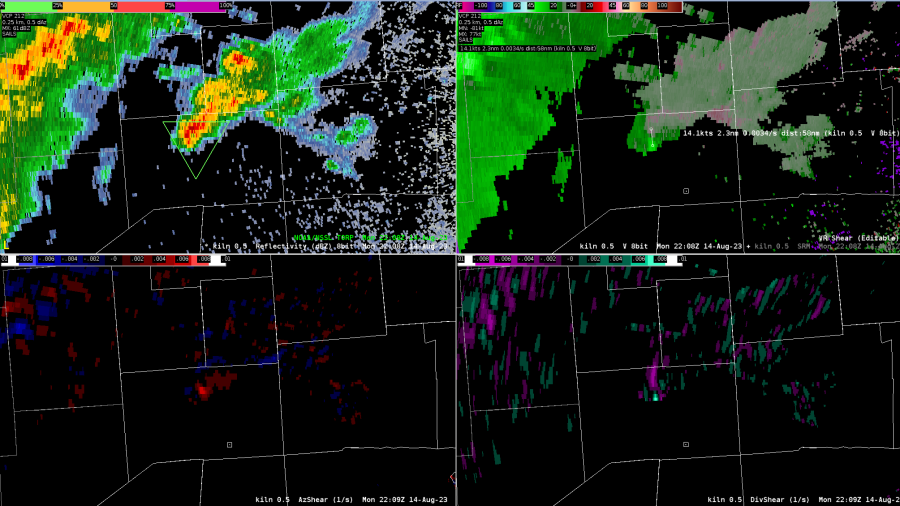
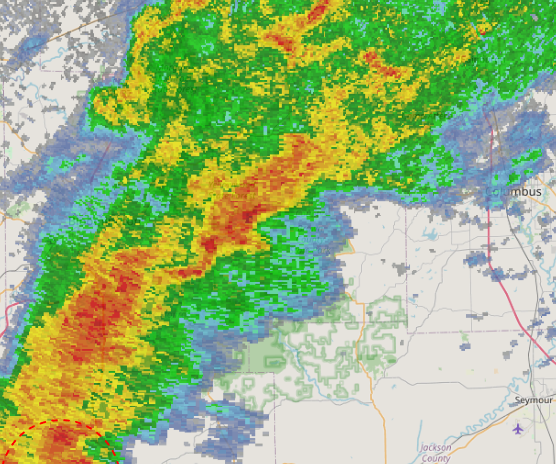
Several weak and broad circulations can be noted on BV/SRM products with this broken line of thunderstorms along an eastward moving cold front. Both the AzShear and TORP products are catching on to these features, but remain largely unimpressed at the moment. The ~20% TORP probabilities match fairly well with my thinking.
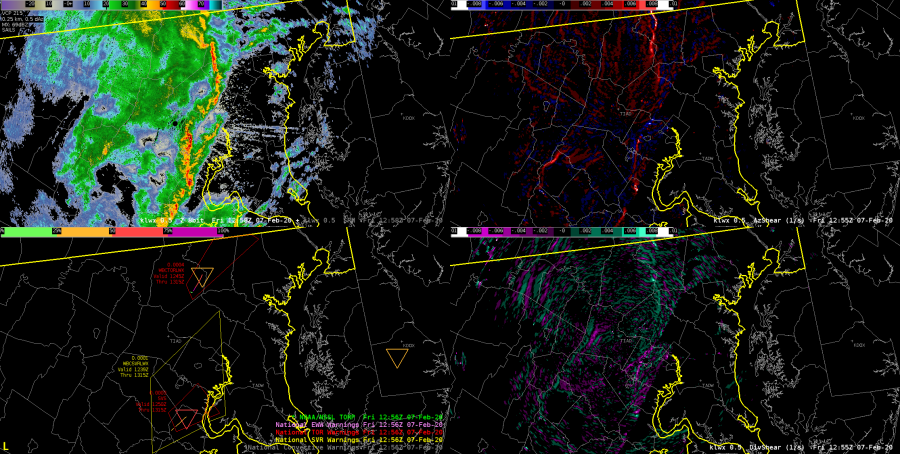
KILN Z/V/SRM/CC 4 Panel at 2202Z.KILN AzShear at 2203Z.
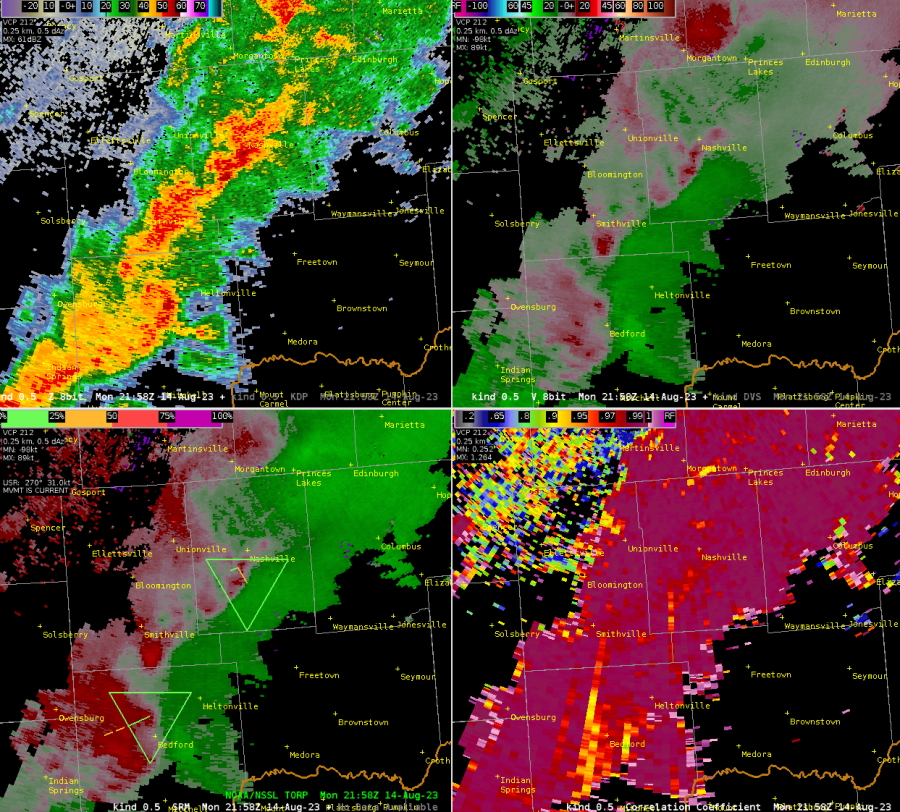
The generally unorganized convection at the beginning of the test case period is becoming more organized with increased Reflectivity values and increased MRMS VII indicated better updraft development as the upper energy from the approaching trough moves into the region. My eyes were drawn to this area from increased values of AzShear and DivShear. Torp values are identifying objects but not meeting my filter criteria of 30% probability.
At the very beginning of the scenario, Torp and AzShear were indicating a significant area of concern in the SW portion of IND’s CWA. Velocity data did not indicate a threat, but if I was warning operator I would have issued a warning for this particular cell/area.
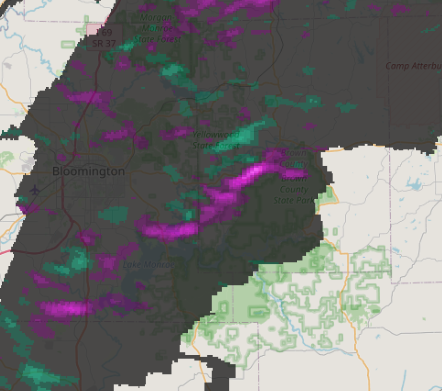
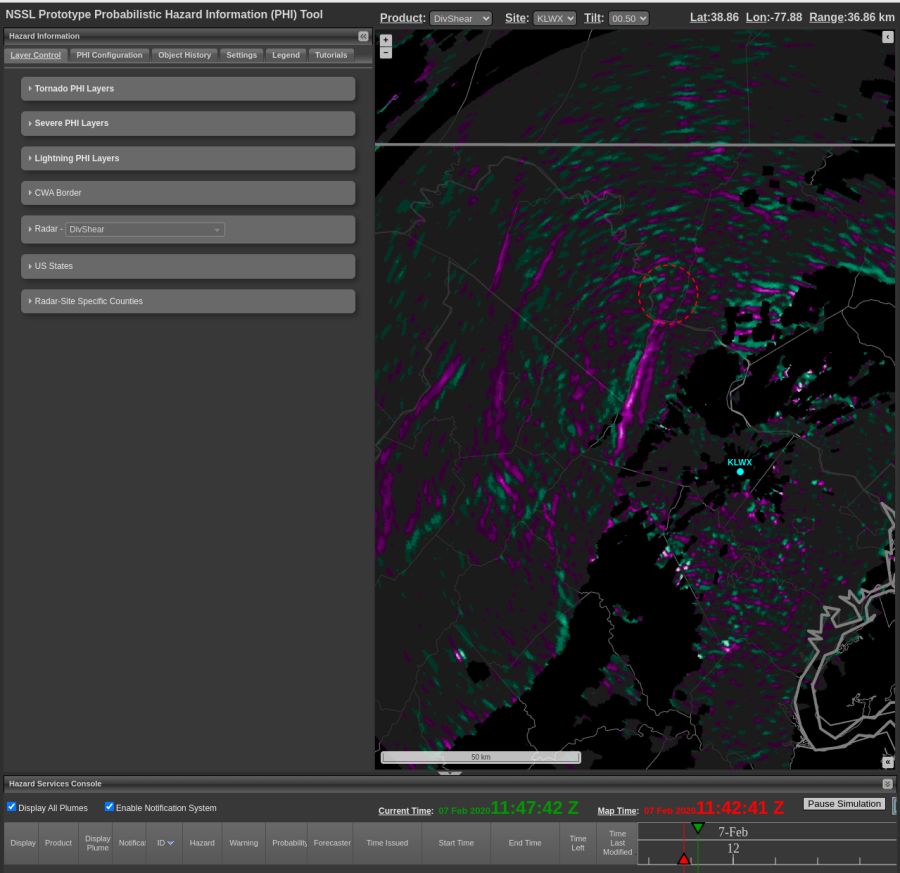
For this case, the pre-case briefing made the environment seem unfavorable for severe weather. One potential sign that storms were stronger than anticipated was in the DivShear field, which showed a corridor of enhanced convergence along the leading edge of a rather uninspiring line of storms (reflectivity not pictured):
DivShear field at 1142z
Another note on the DivShear (and AvShear) fields. There have been some discussion about potentially filtering by Zh >20 dBZ, but this was a case where large areas of stratiform rain meant the filtering would have had little impact on the output. In the image above, there is quite a bit of noise. Most of the time, I found DivShear and AvShear were easiest to use when first identifying an area of interest in base products and then investigating AvShear/DivShear.
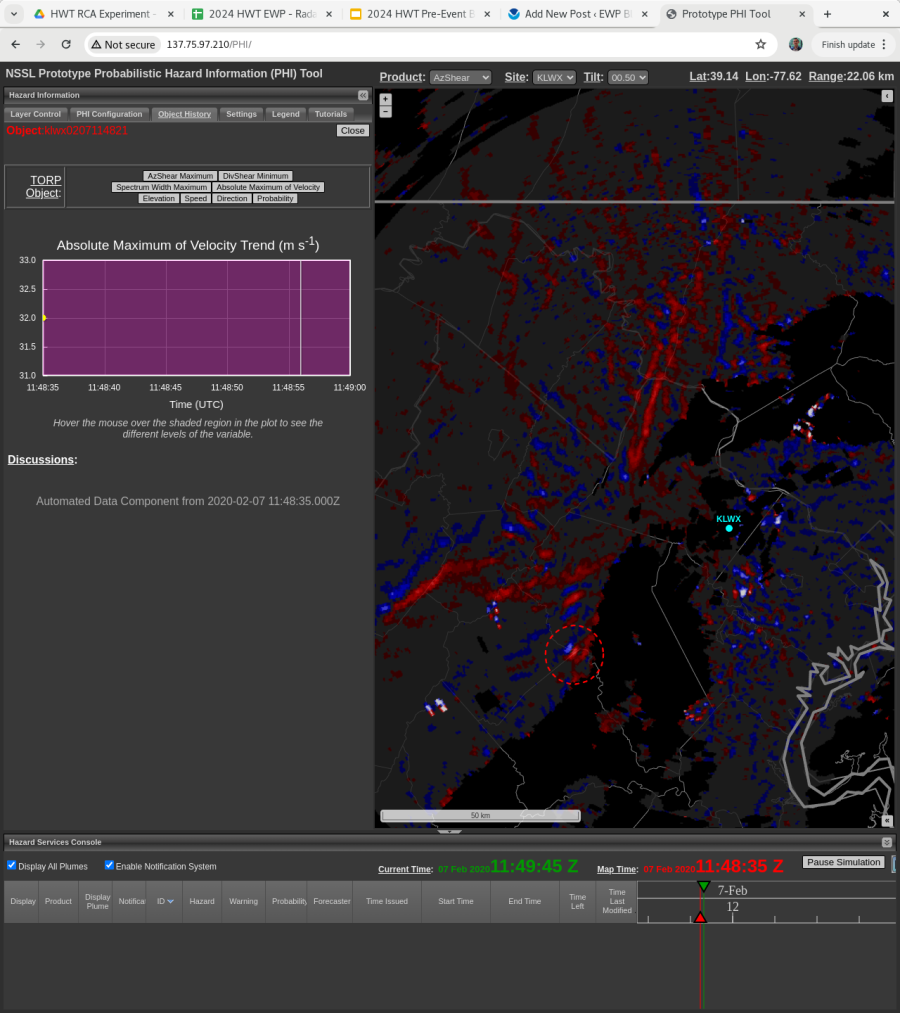
I also found TORP objects to be a useful way of identifying areas in the AvShear/DivShear field that warranted further investigation. Without the TORP object in the example below, there are several other areas in AvShear that I may have tried to investigate prior to the area of greater importance.
AvShear plot at 1148z with a TORP object circled
Here is another example of this in the DivShear field. There are several areas of legitimate interest, highlighted by the TORP objects. Further to the west of these objects, there are higher magnitude values of DivShear, however these ended up just being noise:
DivShear plot at 1157z
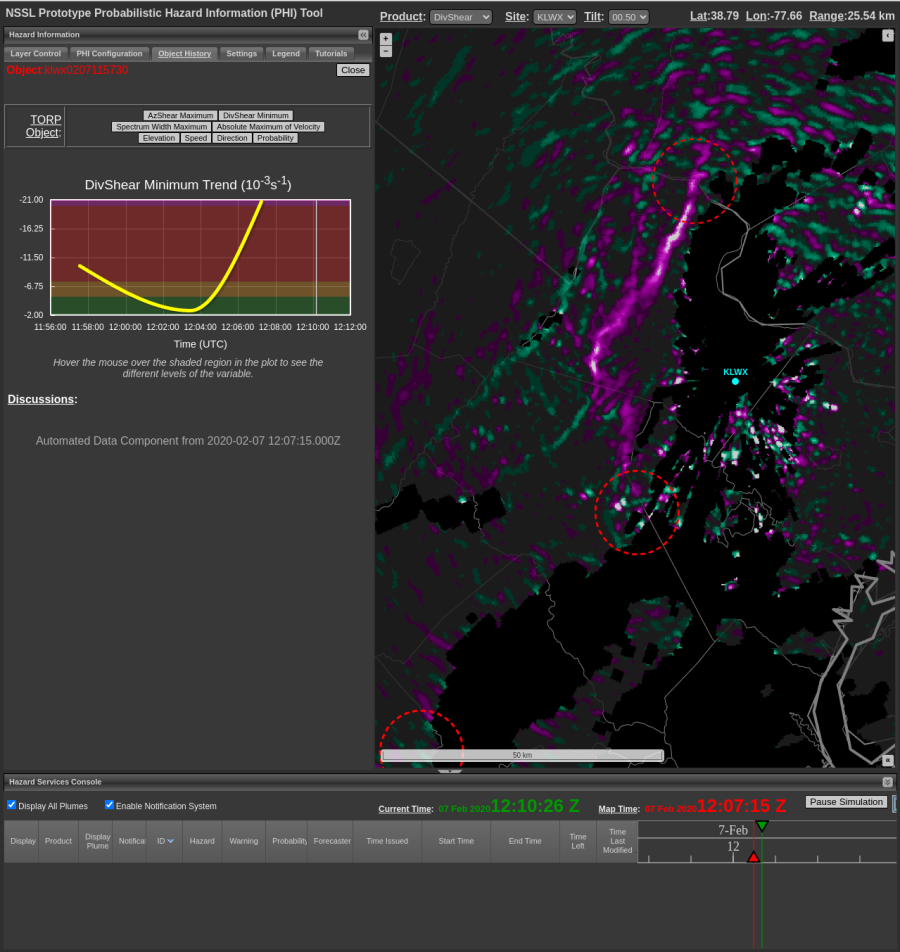
Here is an example of when TORP/DivShear factored into my warning operations. This segment of the line to the southwest of the LWX radar had shown signs of strengthening in the base fields, including signs of a descending rear inflow jet, (Zh decreasing on backside of the line), several line breaks, a tightening Zh gradient on the leading edge of the line, and an area of at least some rotation in each of the lowest four scans (0.5, 0.9, 1.3 and 1.8). However, given the expectations that the background environment was unfavorable, I was hesitant to push out a tornado warning. As I was monitoring this line segment, TORP values increased to near 40% and the DivShear minimum trend also showed a sharp increase. I ultimately put out a tornado warning for this area. To my knowledge, it did not go on to produce a tornado, but I still felt like the collective radar trends, both base and TORP/LLSD products, warranted a warning.
DivShear plot at 1207z with a DivShear minimum trend graph for the TORP object SW of KLWX radar.
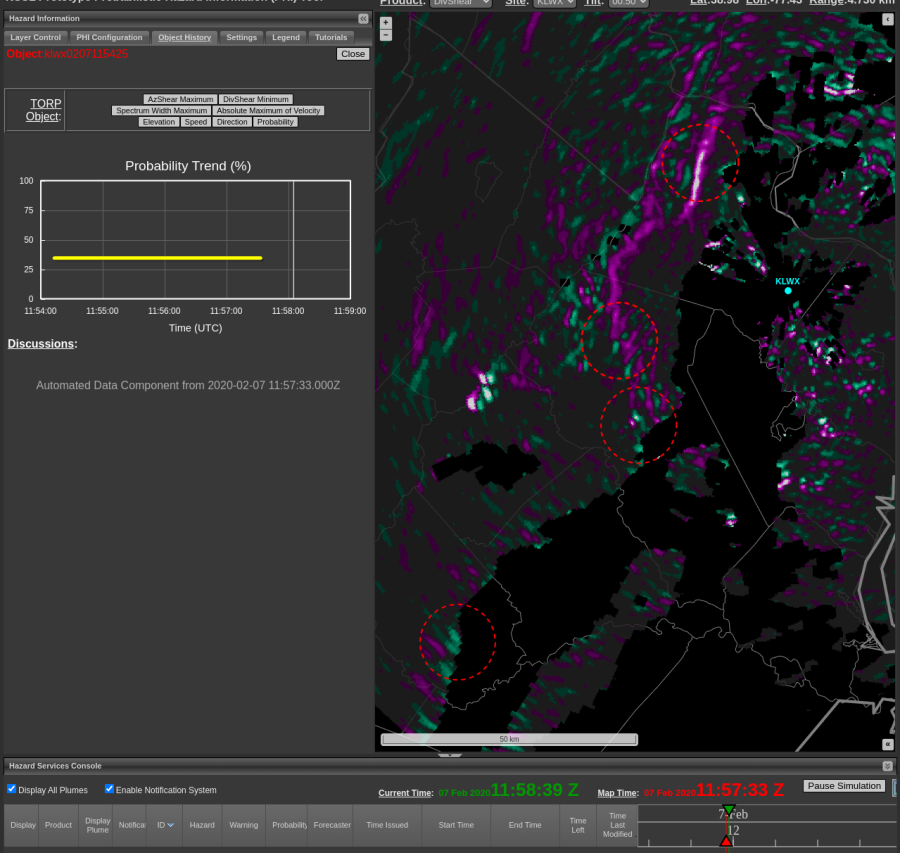
I continue to find the trend plots very useful. While my attention was on the storm immediately SE of KLWX, the storm farther SE ramped up to TORP values near 50%. However, subsequent scans showed TORP values trending lower and I was able to hold off on a tornado warning. In general, TORP has been useful for situational awareness, especially when there are many areas of interest.
Reflectivity plot and TORP trend for the far SW storm
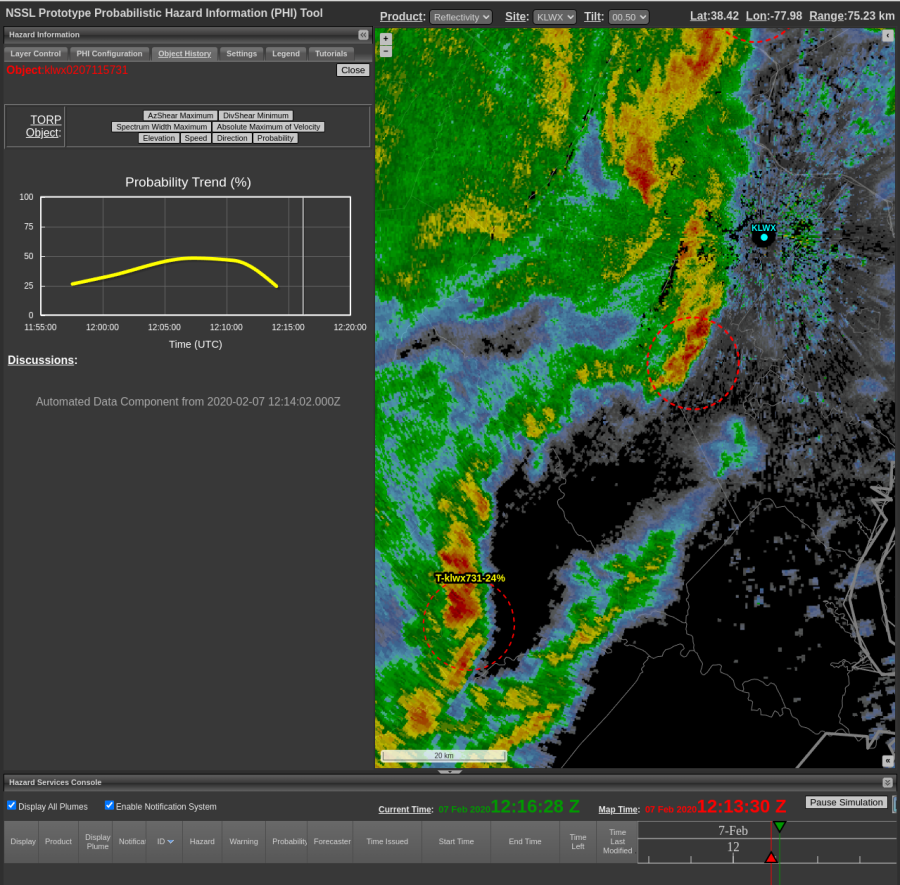
Here is an example of the TORP trend on a storm that actually produced a tornado damage report. The velocity image is from right around the time of the first damage report. The TORP trend graph shows values increasing through 1217z, to near 50%. This increasing trend occurred prior to damage being reporting, and may have been useful for increasing lead time (although personally I did not catch it in real-time during the simulation).
Velocity and TORP trend prior to first tornado damage report.
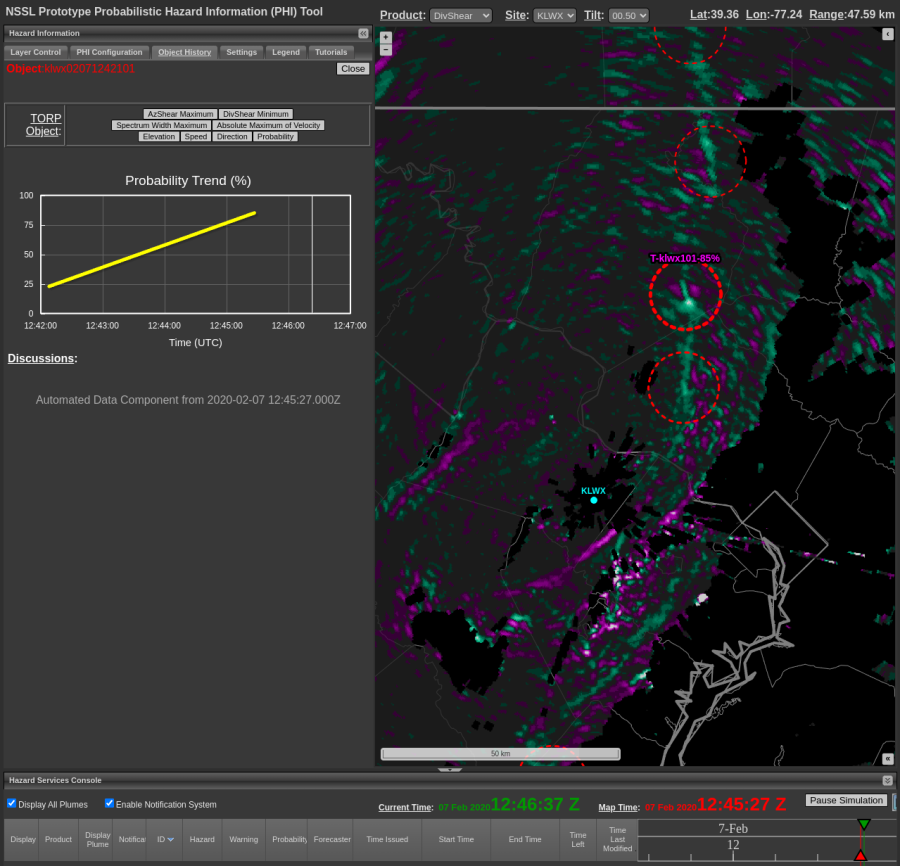
DivShear showed an increase in magnitude at 1245z, which was around the same time TORP values increased to 85%. The AzShear plot (not pictured) also showed a favorable increase around this time, so in this specific instance I’m not sure DivShear added more than just looking at AzShear, or even just looking at TORP, except perhaps for further increasing confidence in the AzShear signal. During the simulation, a tornado warning was already in effect for this area, but had it not been I certainly would have issued based on the increase in all three of TORP, AzShear, and DivShear.
DivShear plot and TORP trend at 1245z. A simulated tornado warning was already in effect.
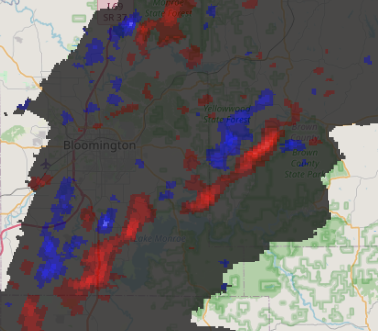
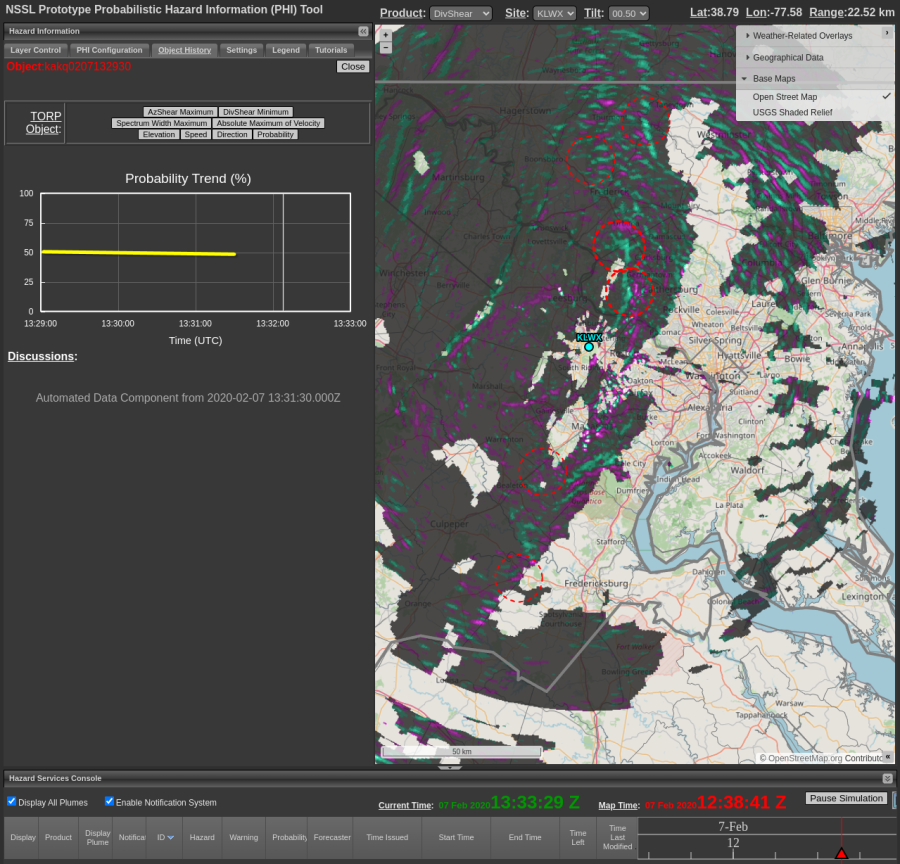
It does appear that DivShear is prone to the impacts of line orientation with respect to the radar. Here is an example of two images showing this phenomena. When the winds associated with the line are nearly perpendicular to the radar beam the strong convergence signal along the line is no longer apparent. I would be curious to see if DivShear can provide some utility to severe wind warning operations, as this is an area of warning operations I find quite challenging, but I don’t have a strong opinion on the DivShear utility in this regard after just one simulation.
DivShear at 1238z when the line was oriented such that winds were largely perpendicular to the radar beam.DivShear at 1323z, when the winds were oriented at a more favorable viewing angle relative to the radar beam.
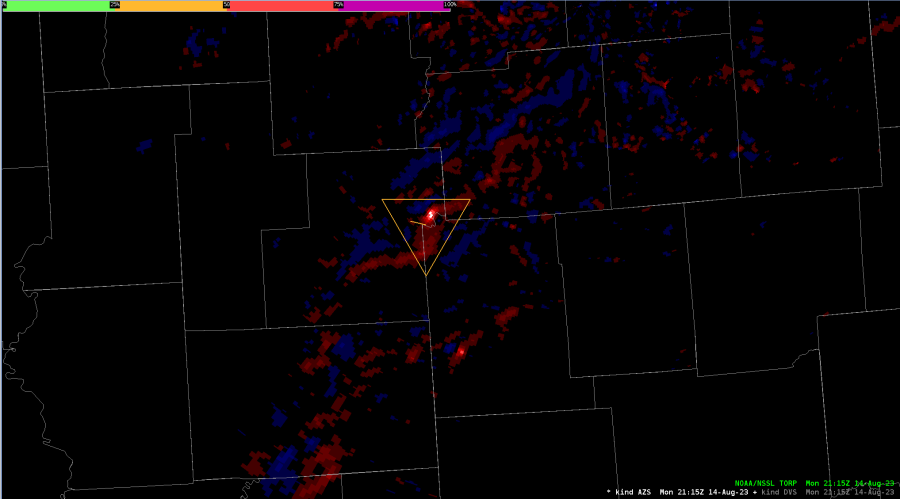
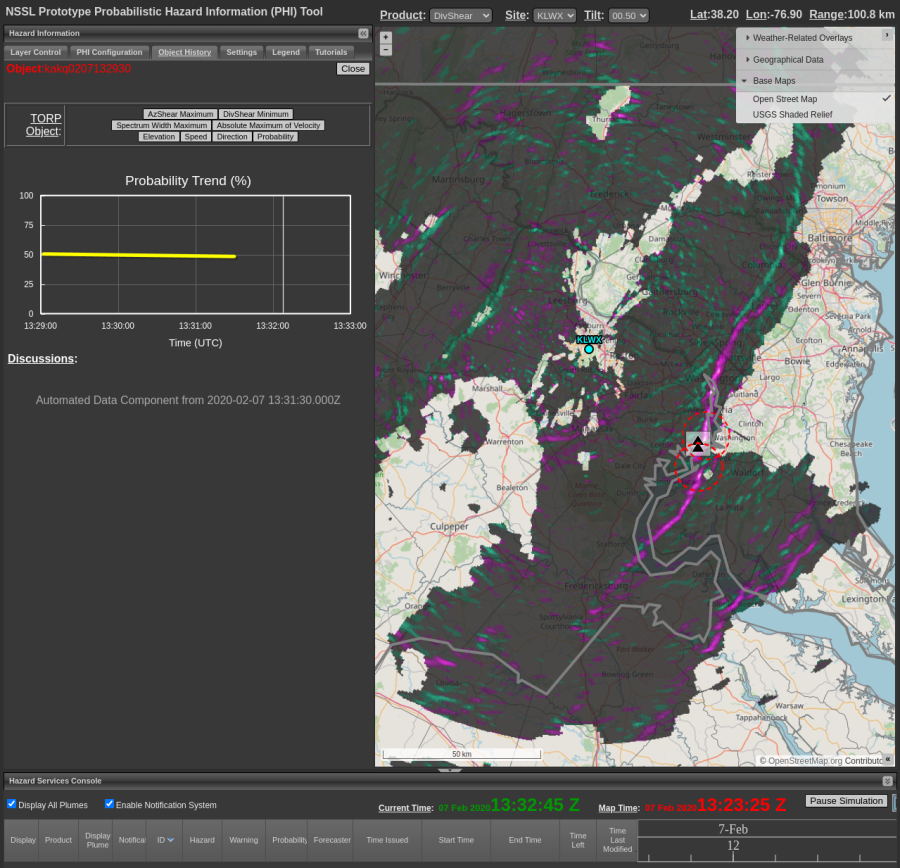
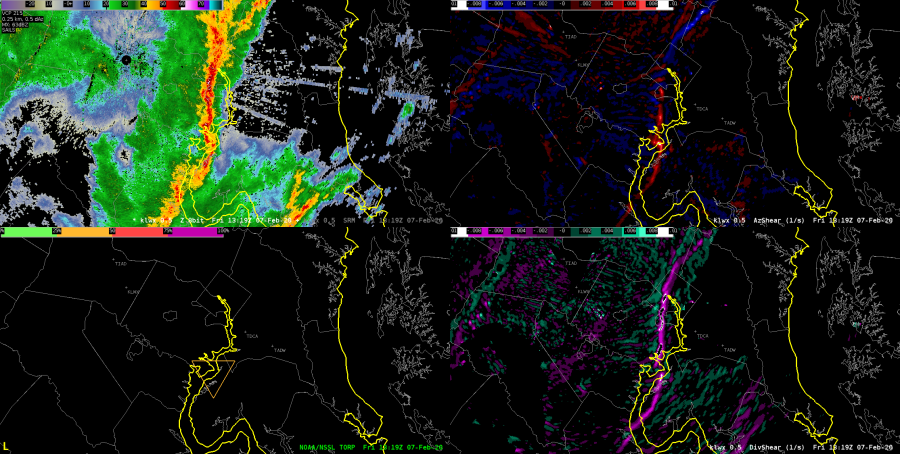
Finally, late in the simulation we had a new TORP plugin available in AWIPS. This plug-in would plot TORP detections as a triangle (becoming dashed if the detection was more than 3 mins old). It would also plot a trail for a given detection. I stepped back in time and snagged some images of what this looked like earlier in the simulation when circulations were stronger. The bottom left panel shows two areas where TORP values were around 50% and had a history of TORP values of at least 25%. I felt that both of these areas warranted tornado warnings. I will also note that, near the KDOX radar, there were several spurious detections in close proximity of the radar, with values of 25-40%. These were easily ignored after a quick reality check (i.e. no storms near that location), but these TORP values are above the threshold that I personally have been using to filter out lower probability objects and could draw the radar operators attention away from other important areas.
An AWIPS 4-Panel showing base reflectivity (top left), AzShear (top right), TORP and simulated warnings (bottom left), and Div Shear (bottom right).
Here is another example of the TORP plug-in in AWIPS. I was able to successfully resize the triangle icons for TORP detections, which seemed a little large initially, especially in areas where multiple detections occurred in relatively close proximity.
A TORP detection at 1256z. This four panel shows the same fields as the image above.
Through two simulations, I feel like TORP values of 50% or greater have typically corresponded to areas were I would be keeping a close eye on the need for a tornado warning if only using the base products. Also, I don’t have any images showing ProbTor from this case, but that’s because I did not find ProbTor all that useful, as it often encompassed a large segment of the line. TORP was far more useful than ProbTor for this case due to its ability to pinpoint smaller areas of interest within the line.
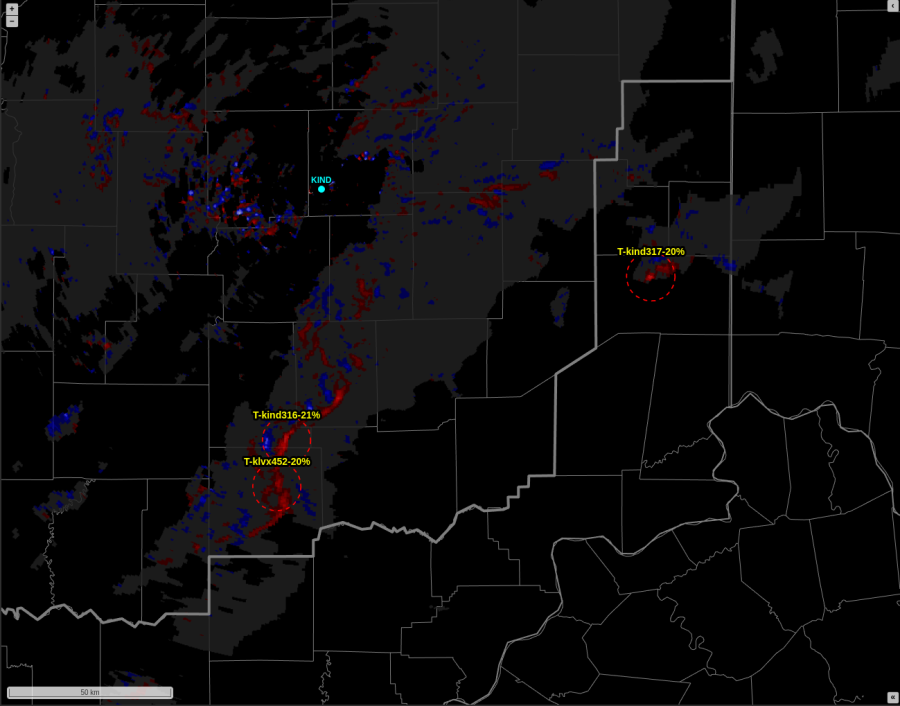
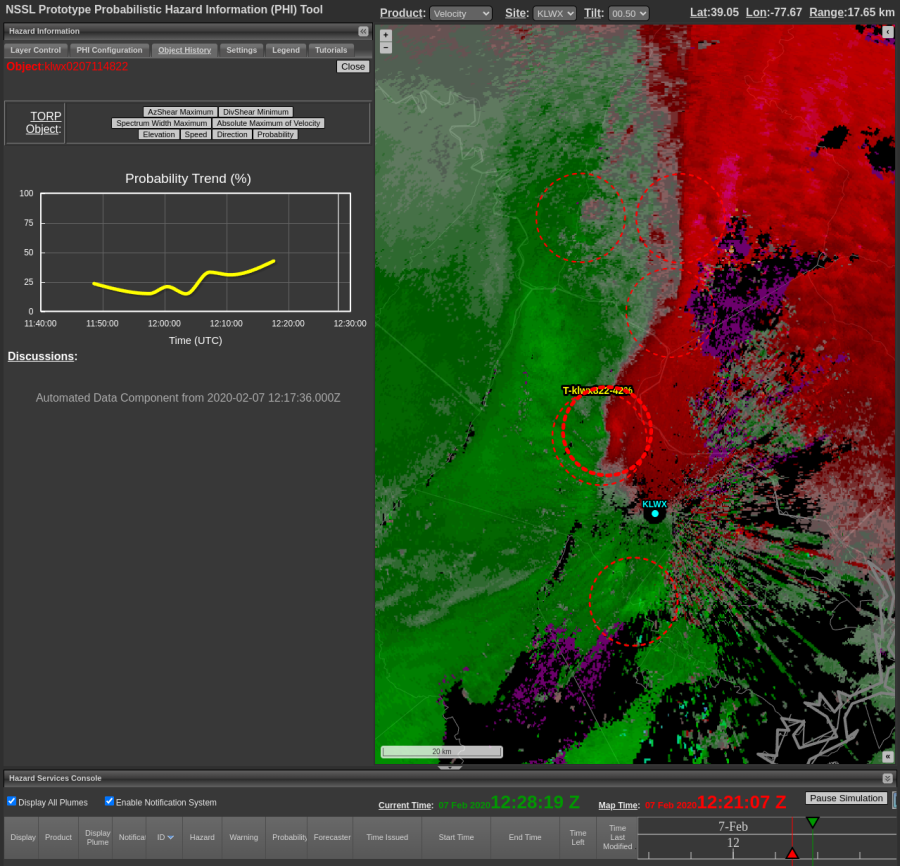
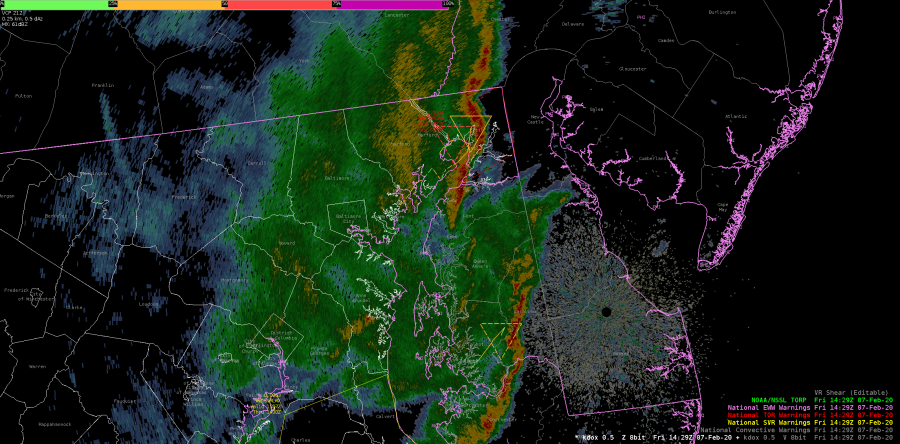
Midway through this archived case we gained access to Torp tracks which I tried to show here, although it is hard to see even after lowing the brightness of the radar image. It is a nice feature to provide track history and probability value information overlaid with the radar data for quick reference of how the object has been trending.