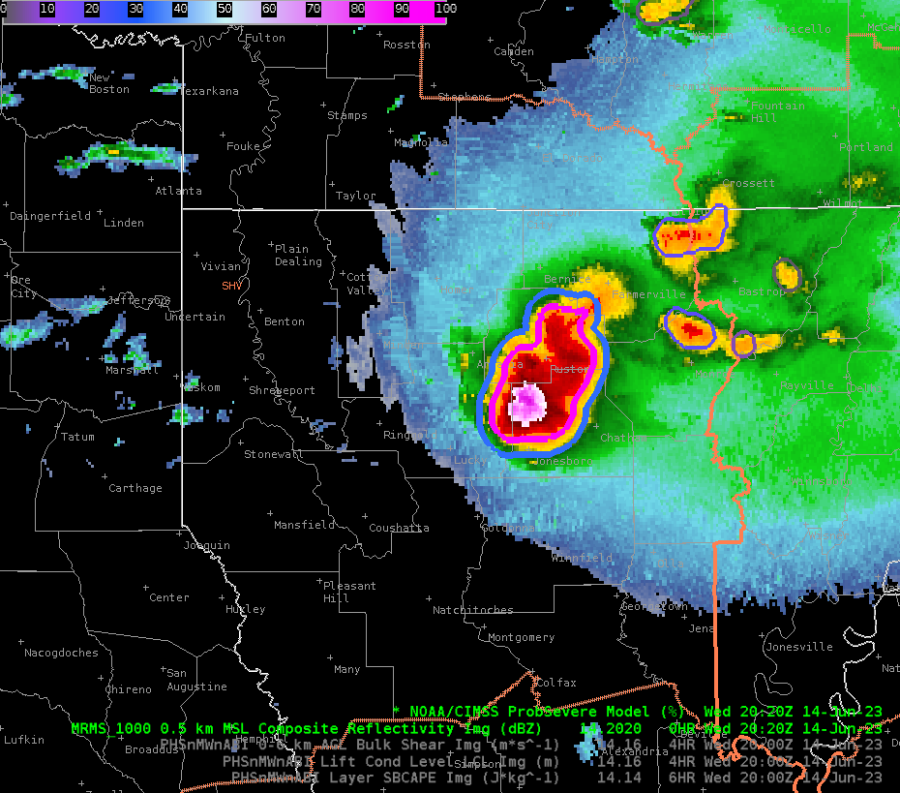
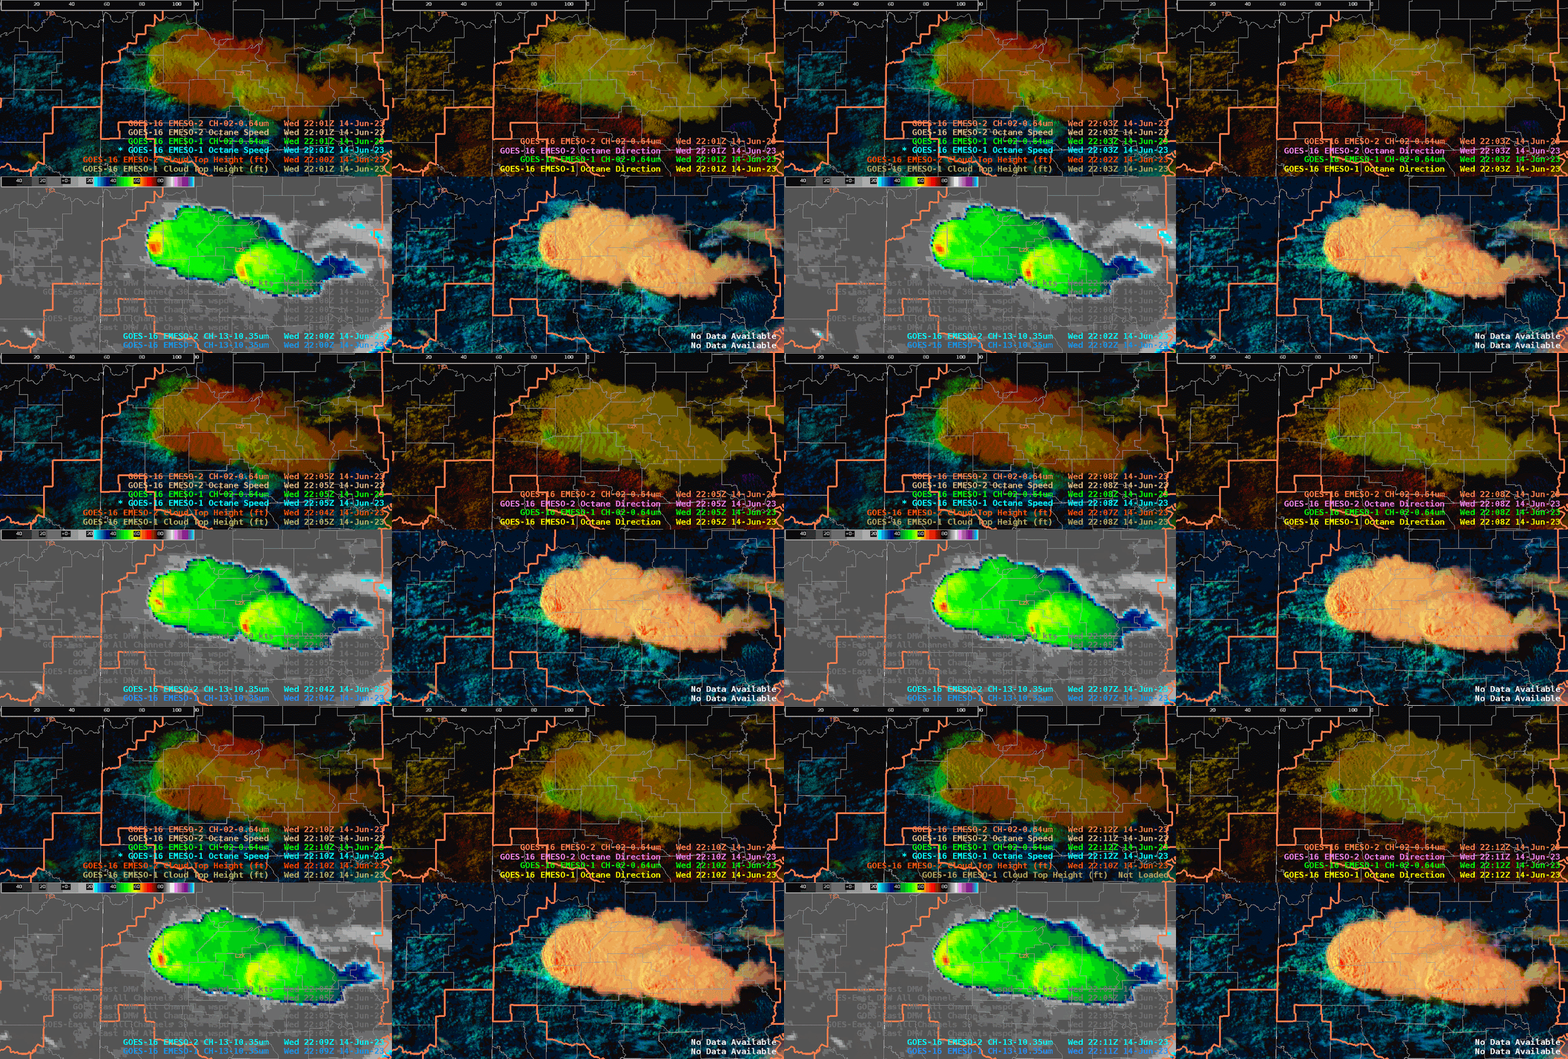
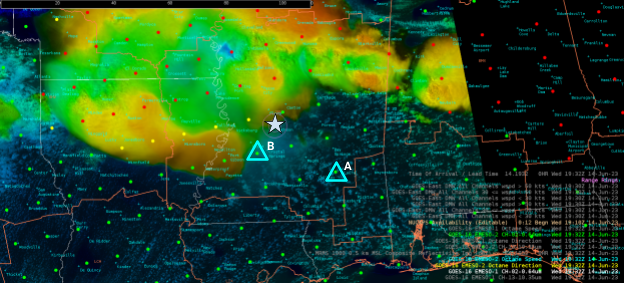
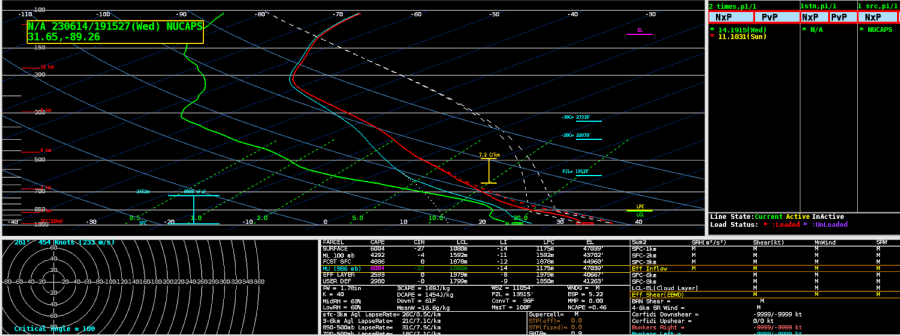
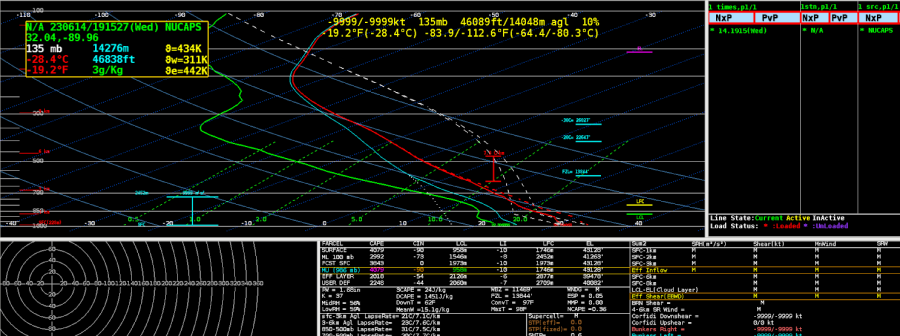
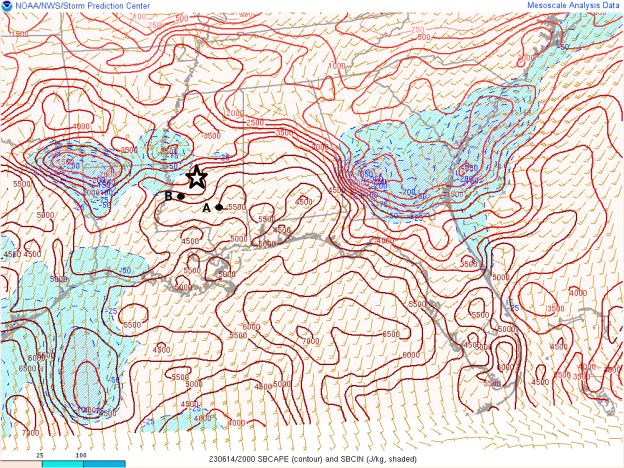
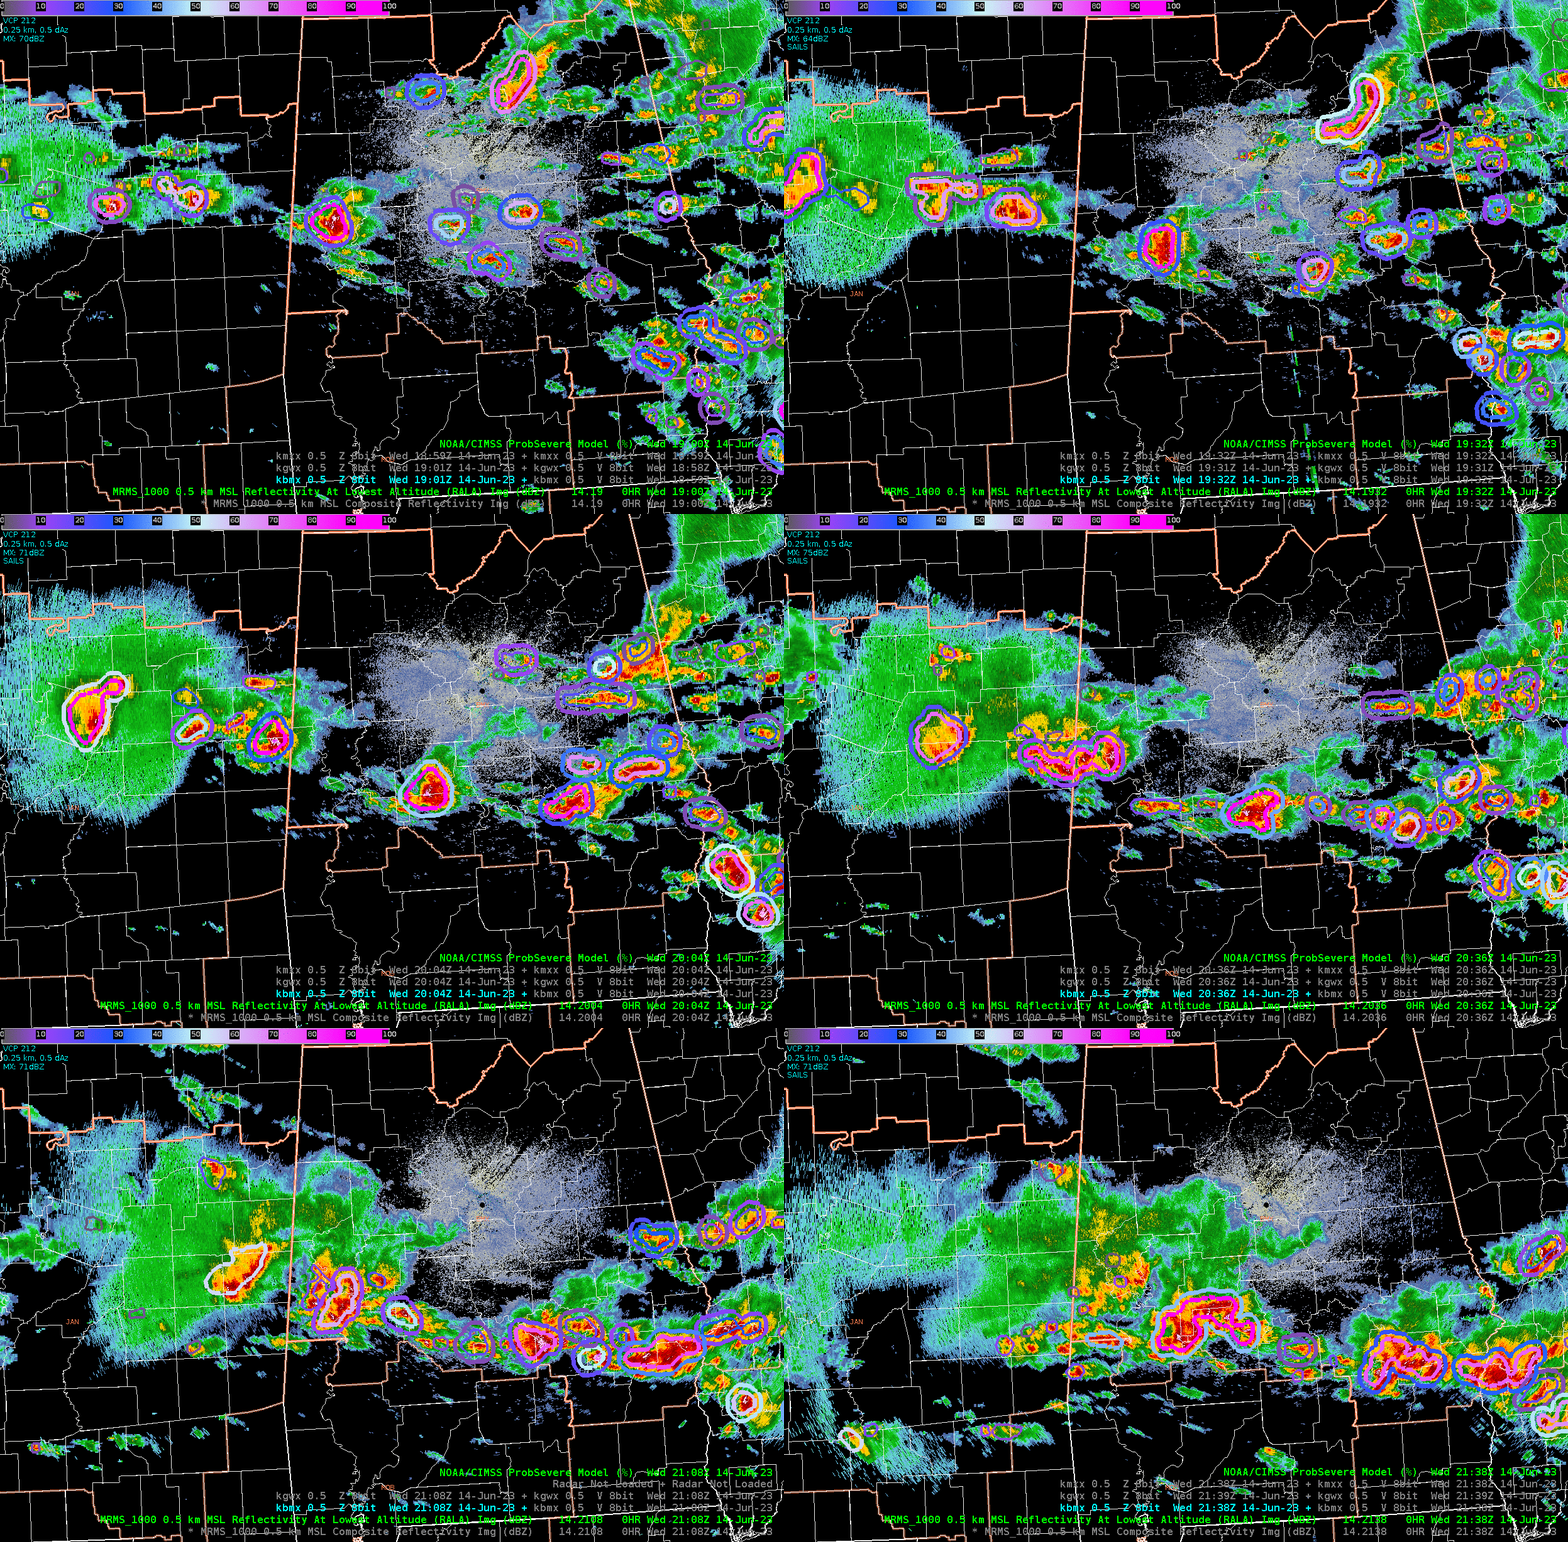
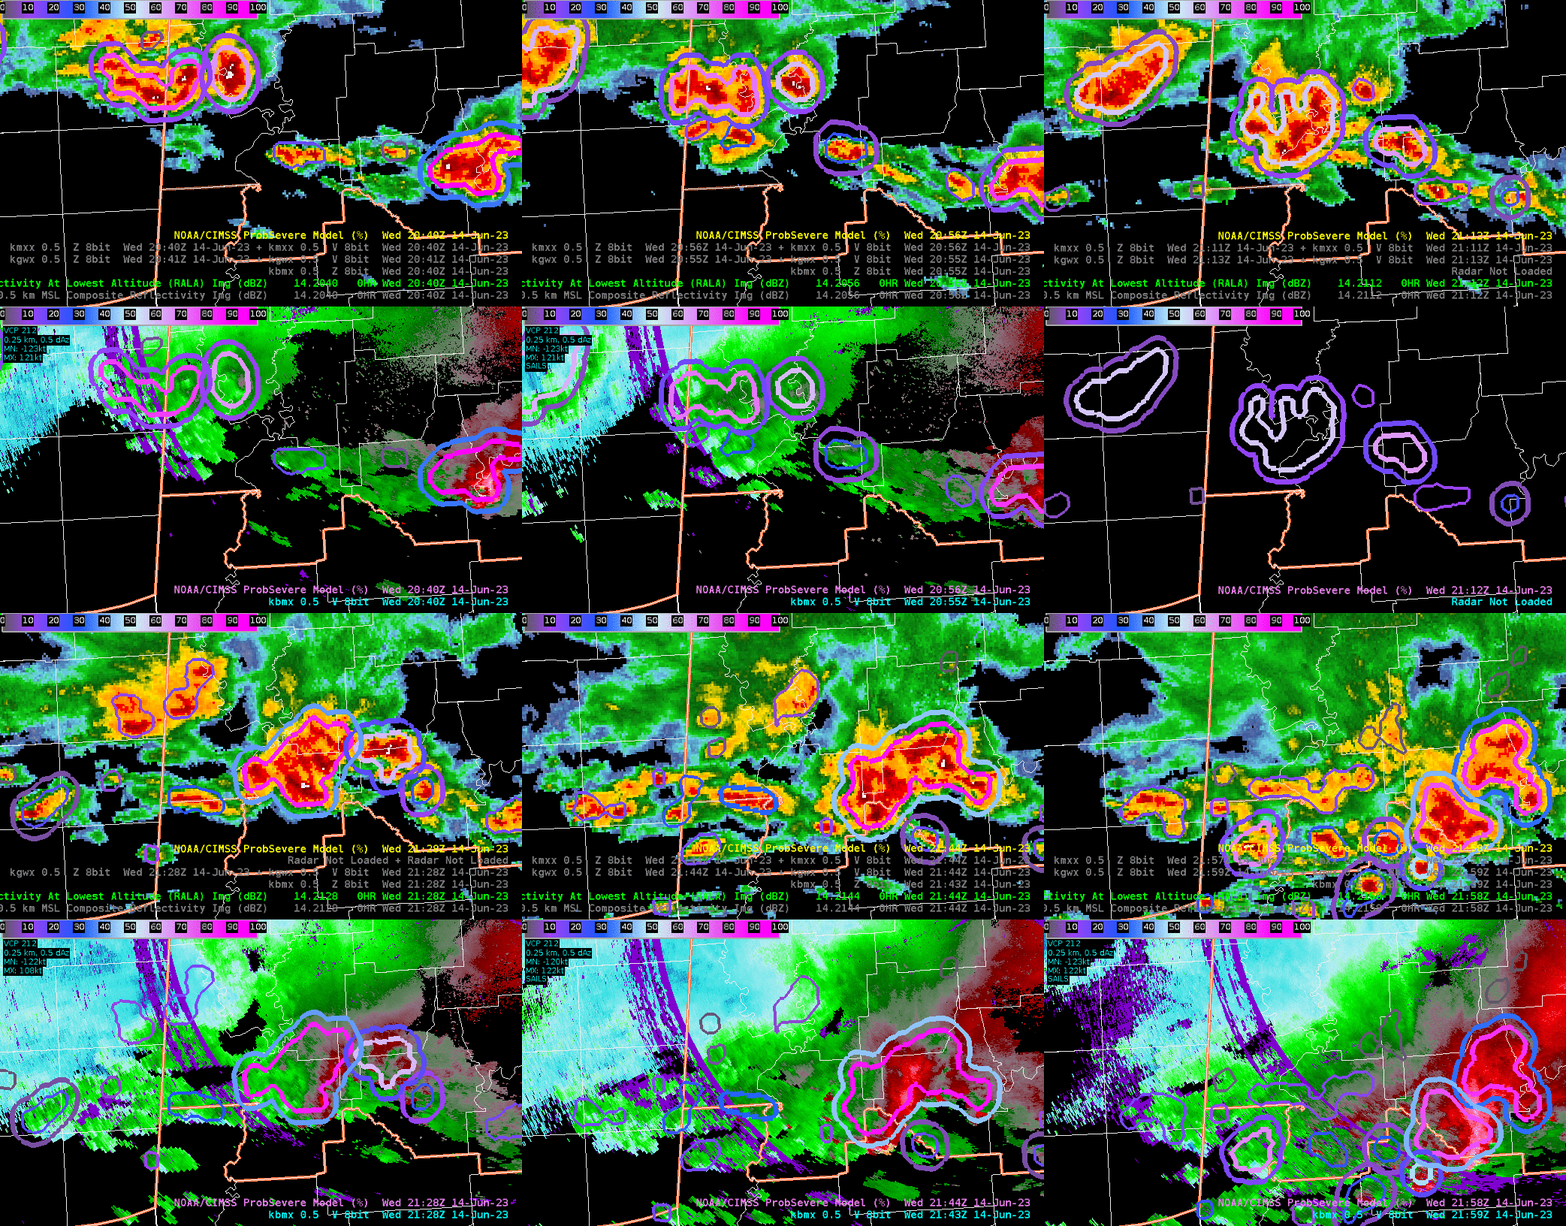
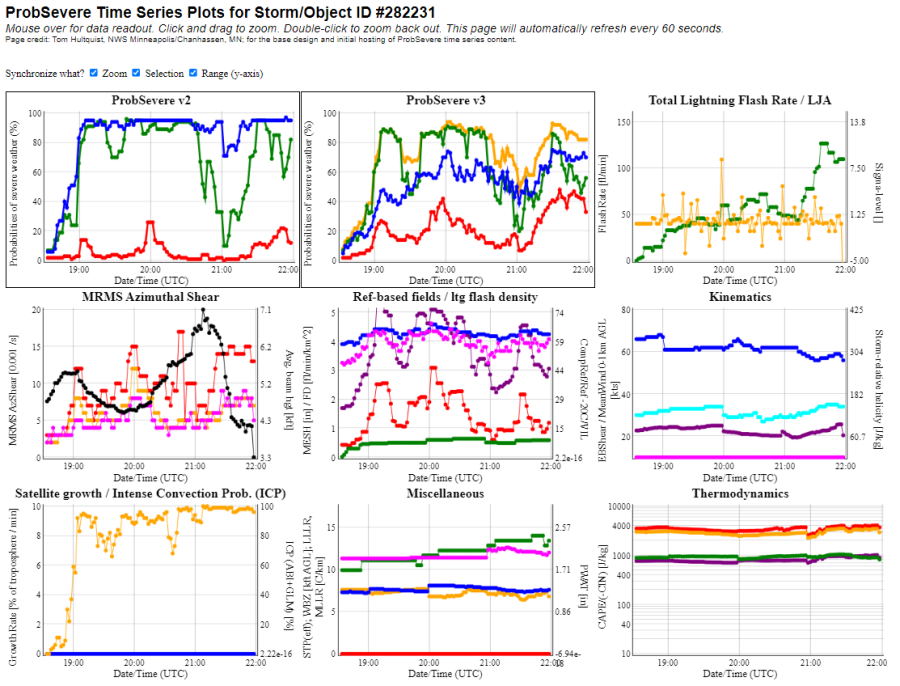
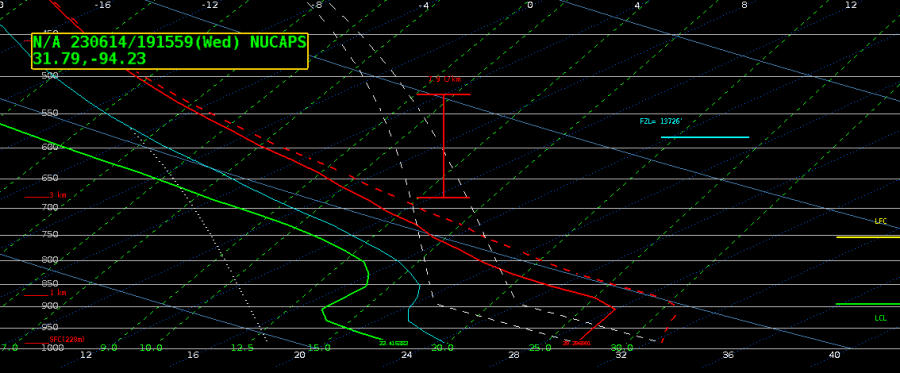
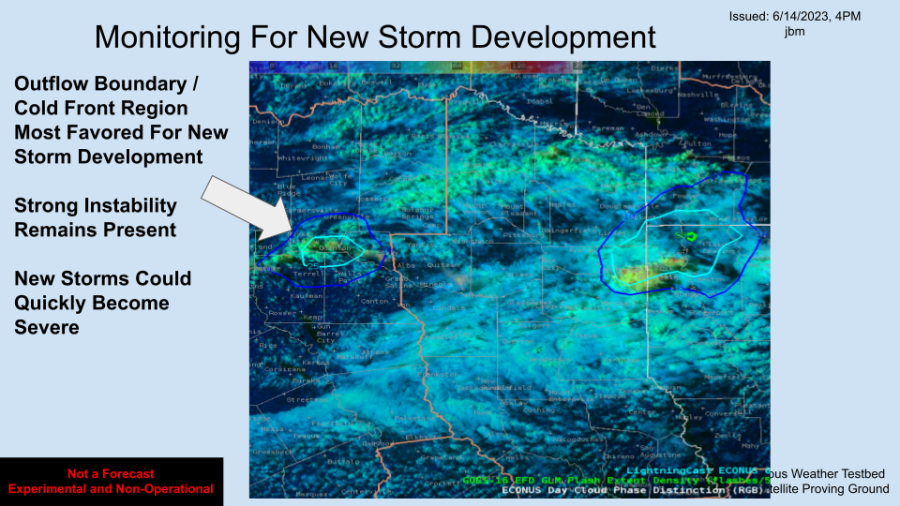
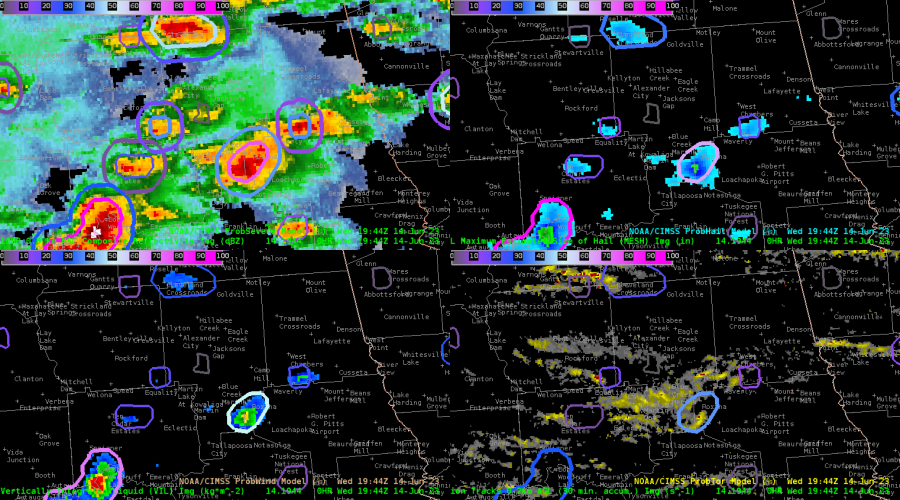
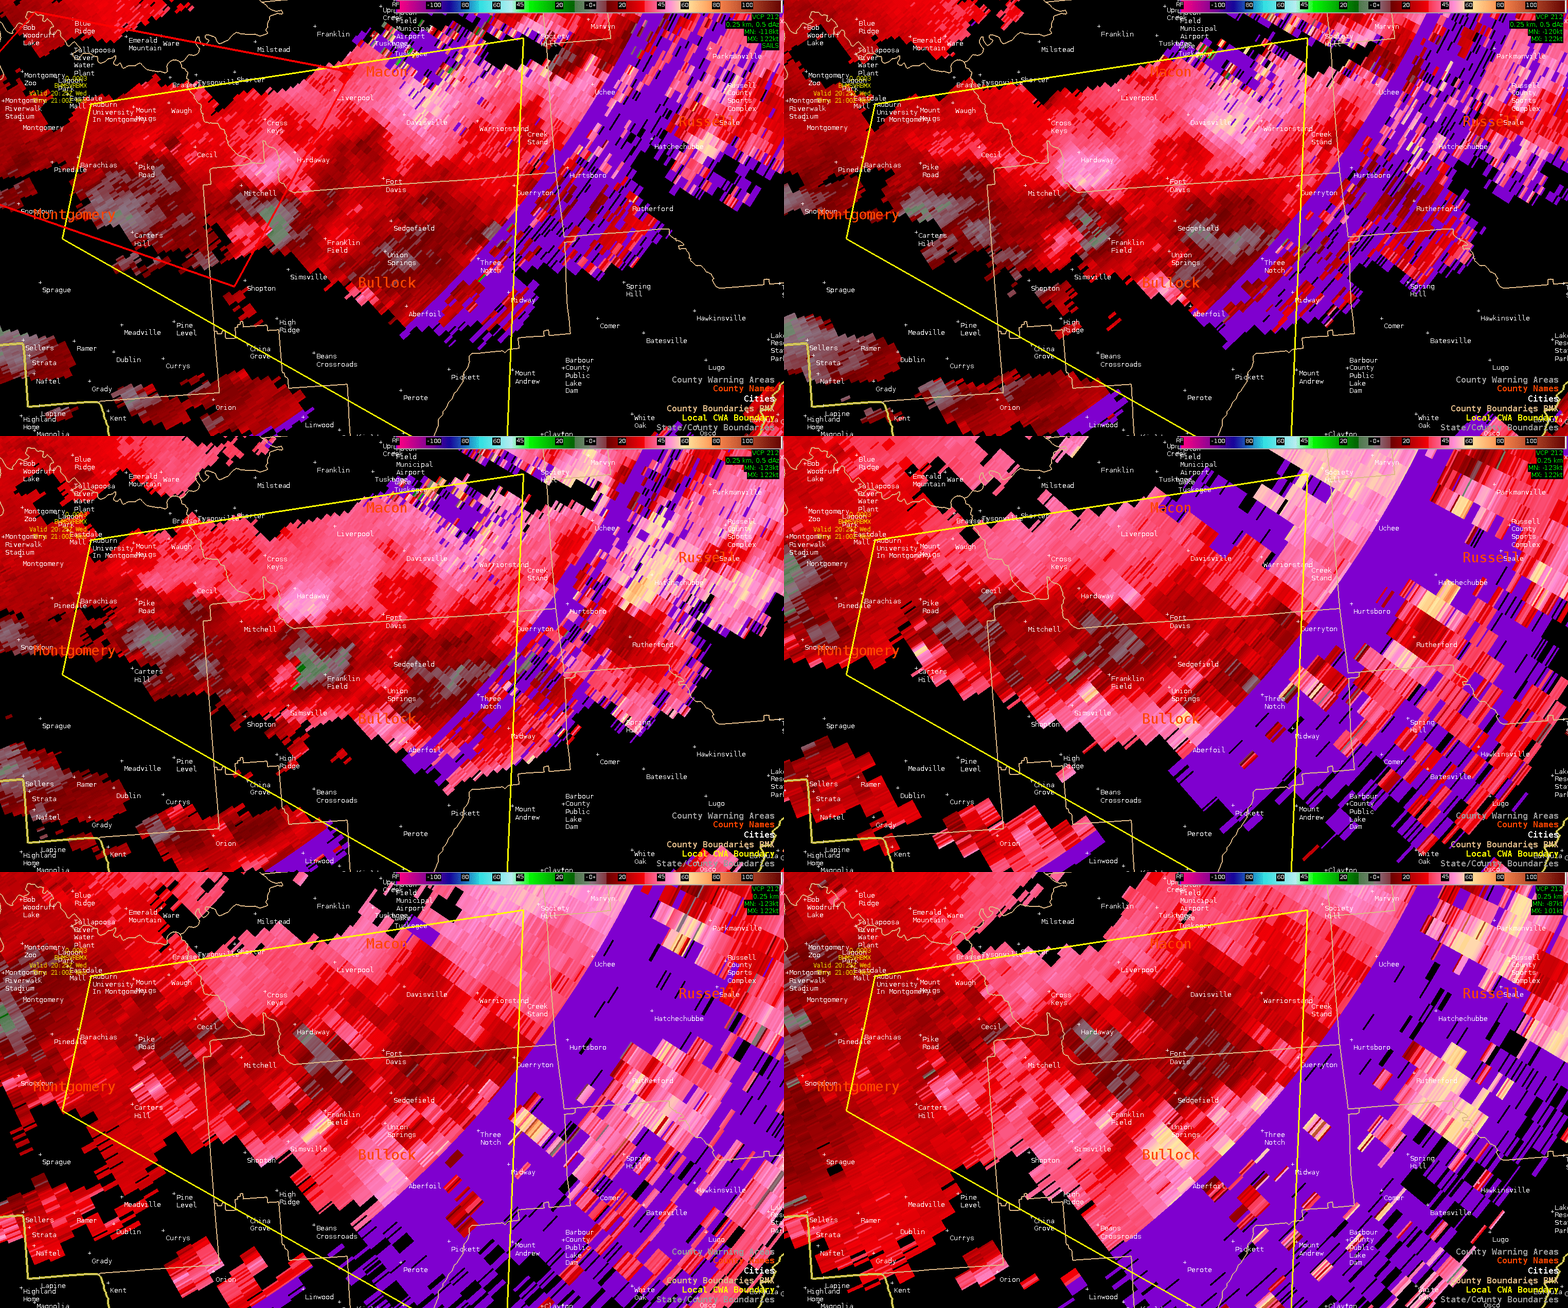
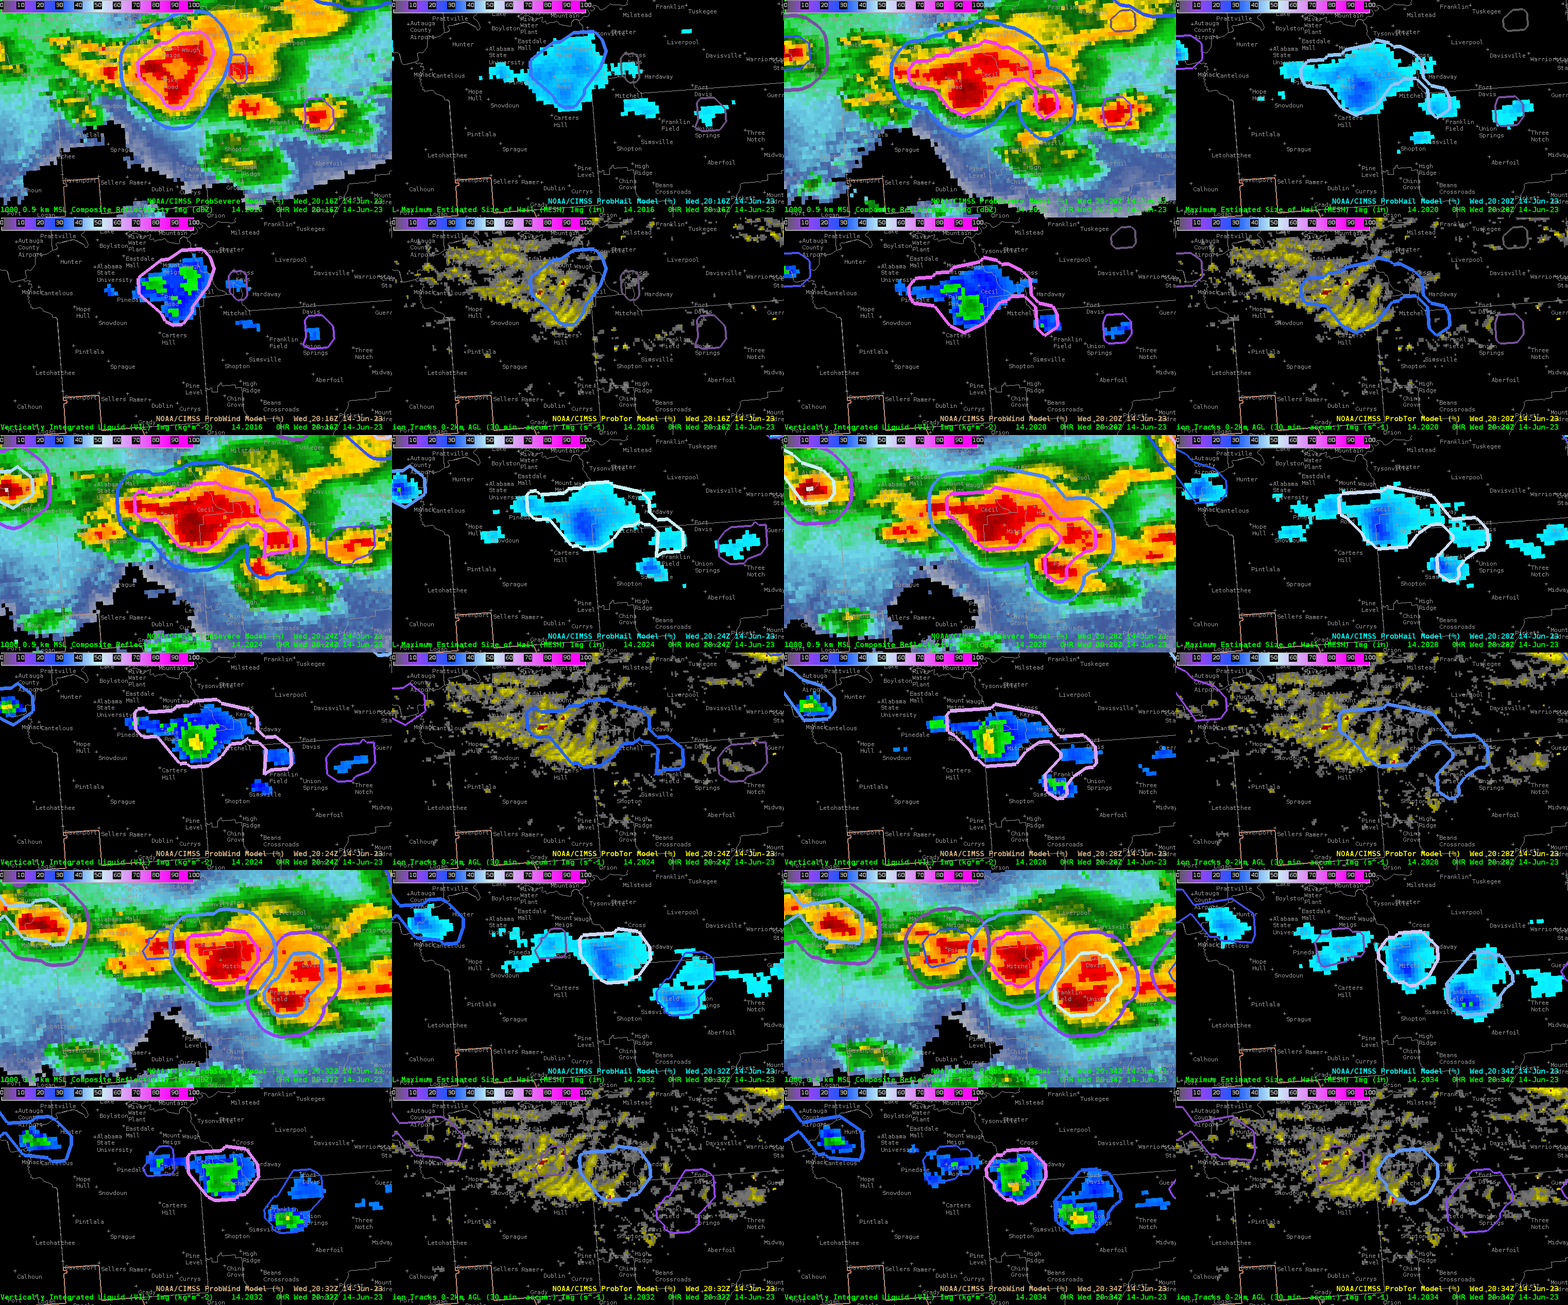
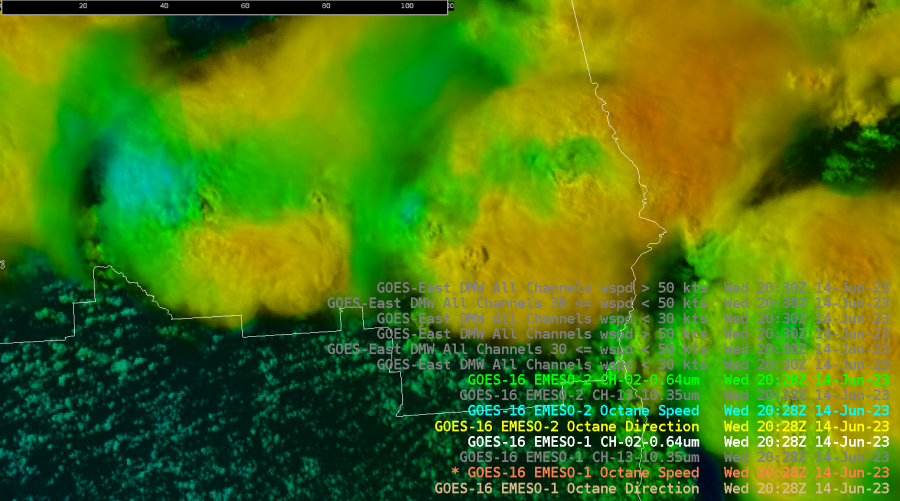
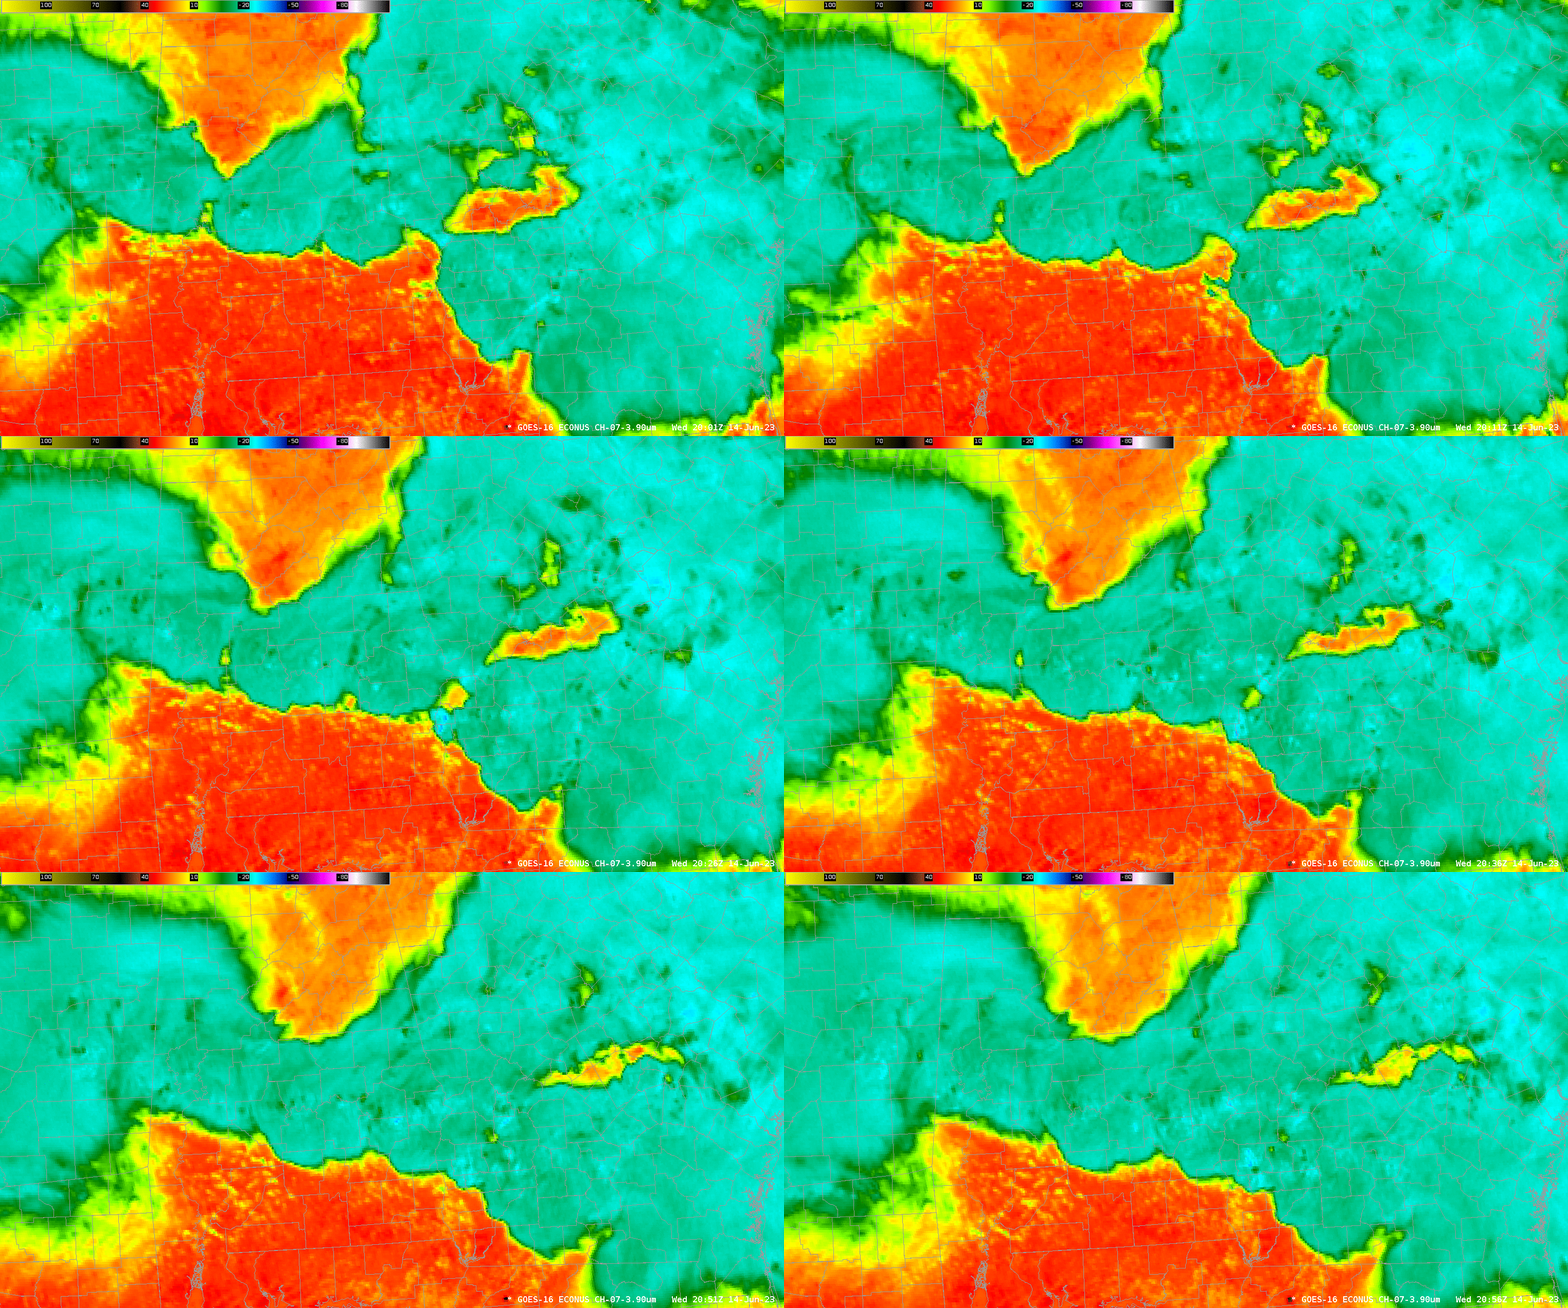
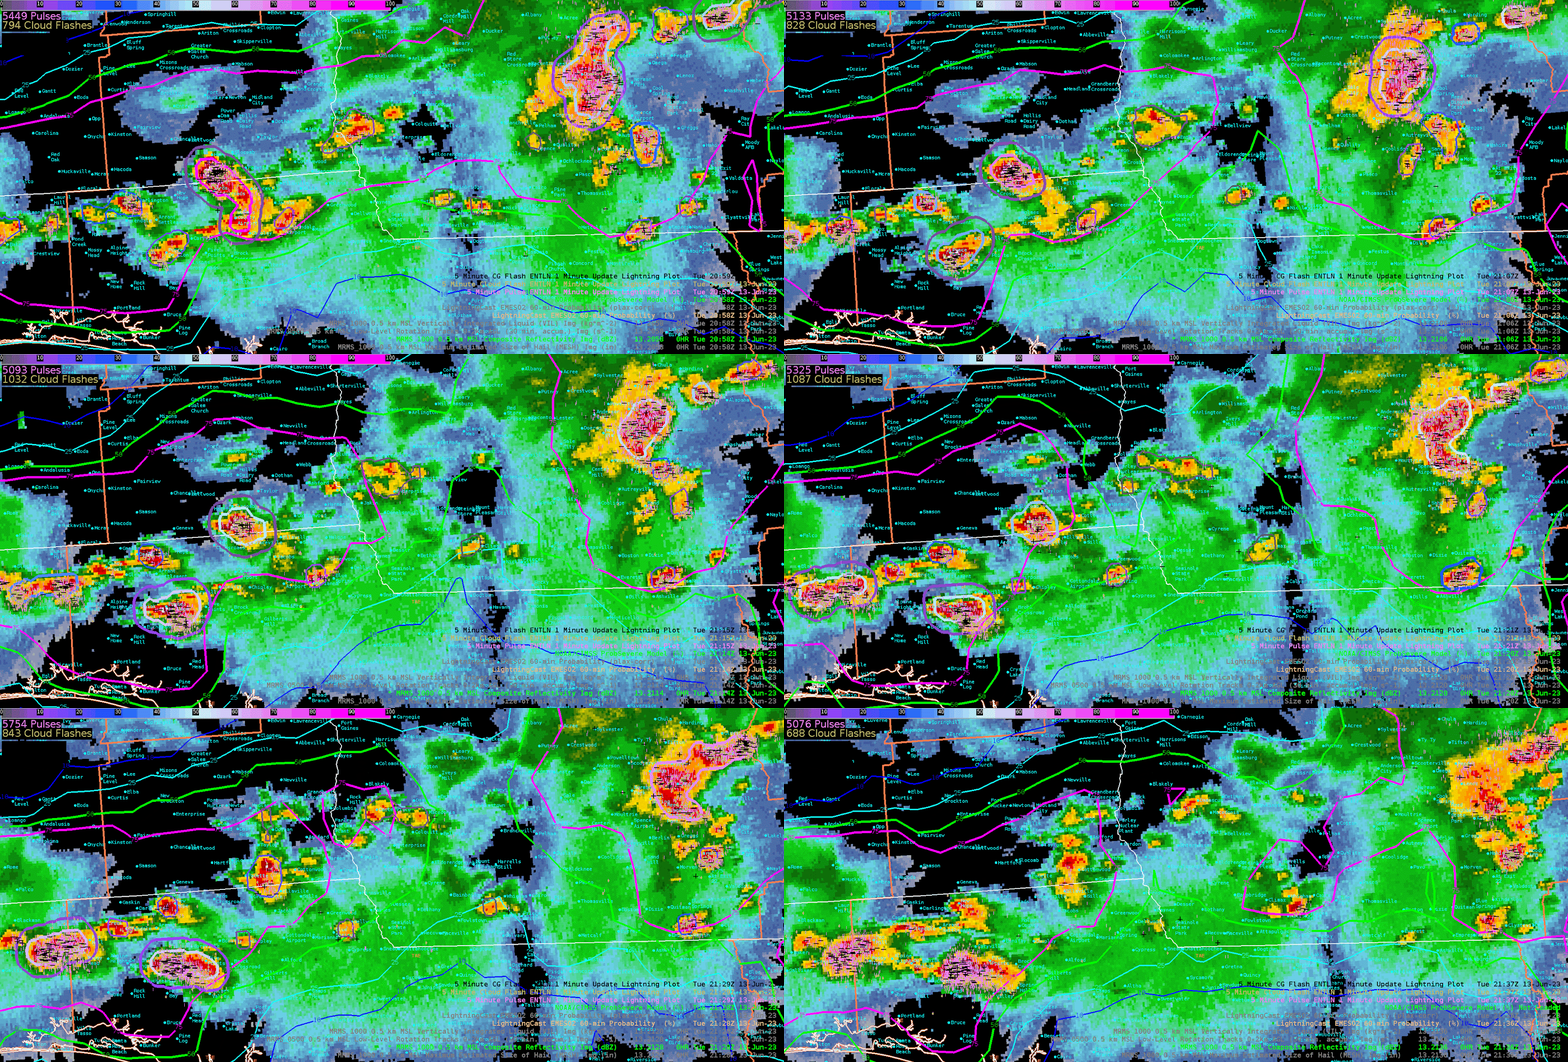
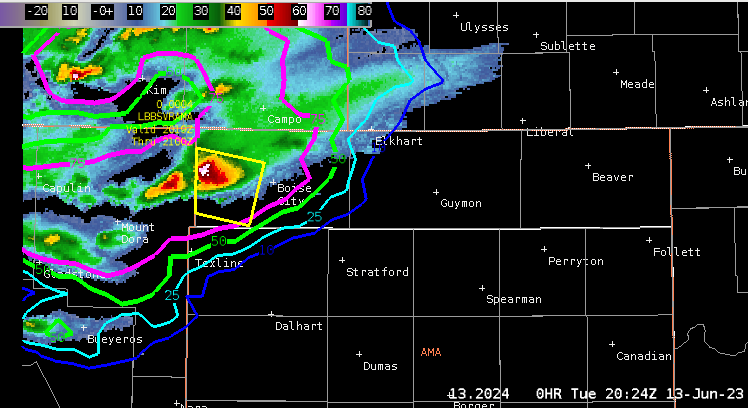
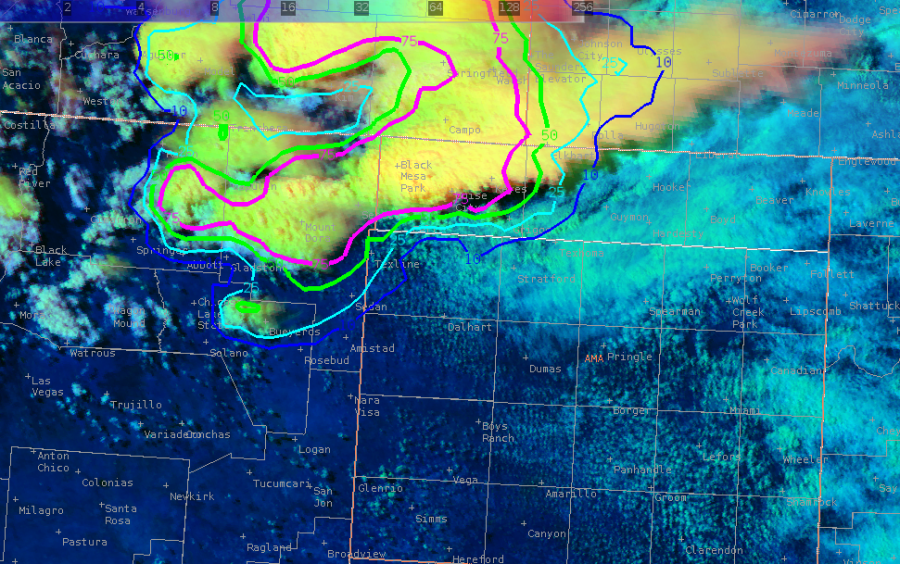
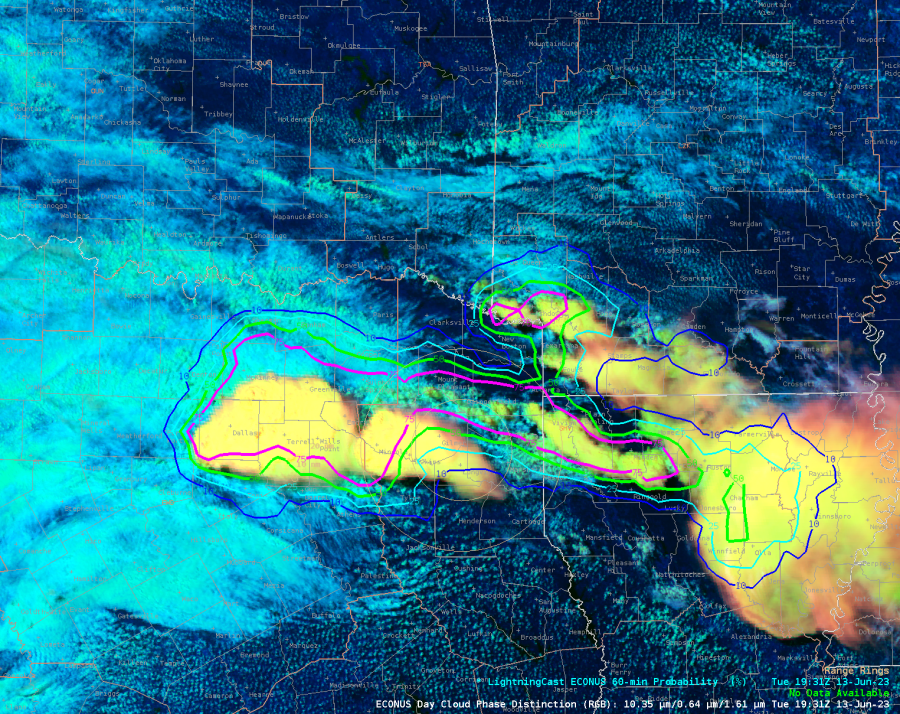
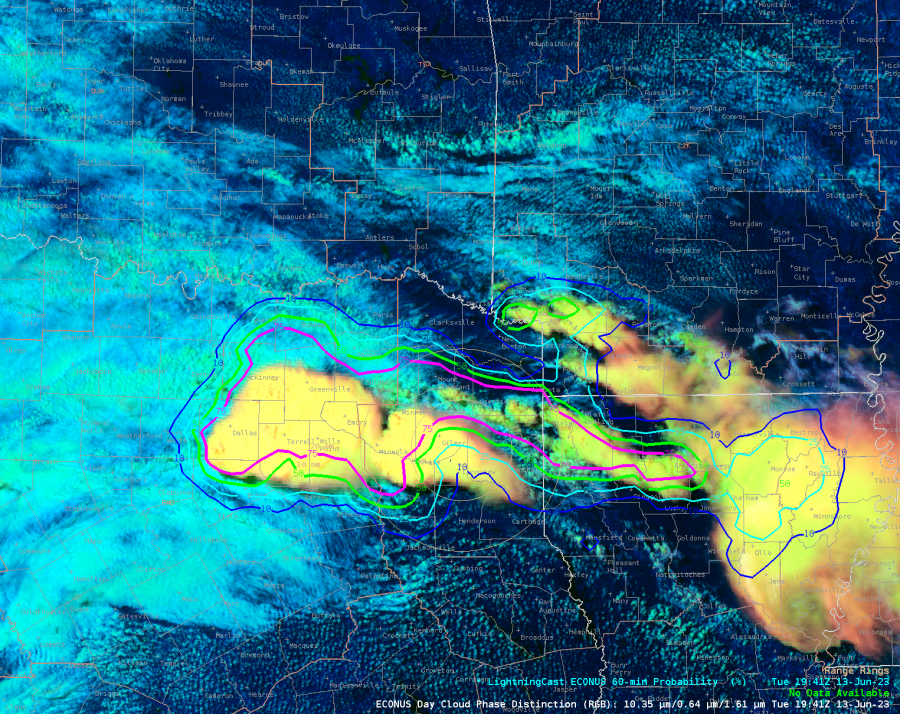
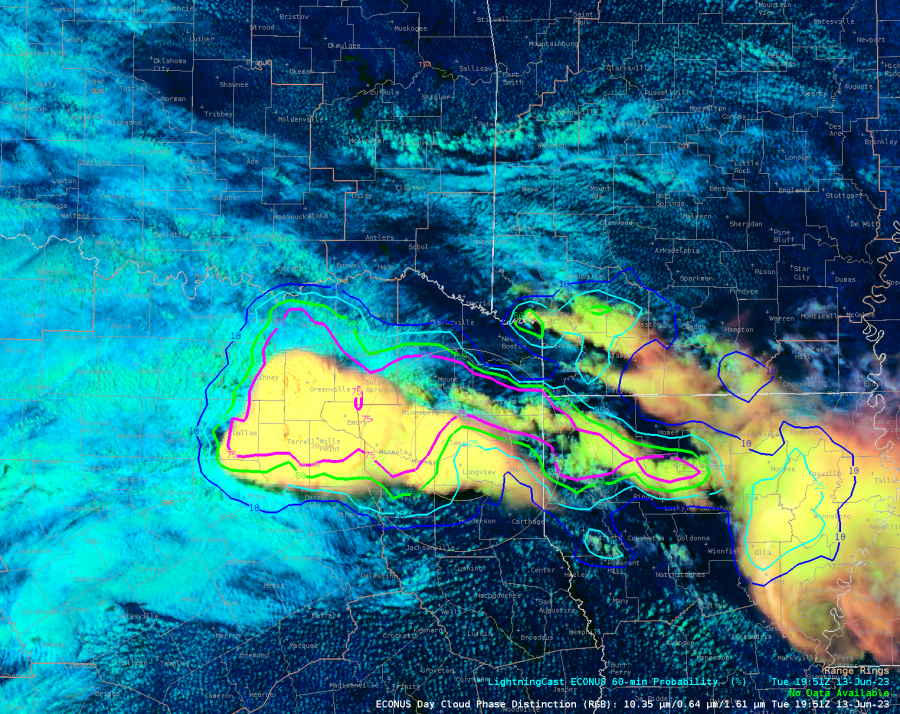
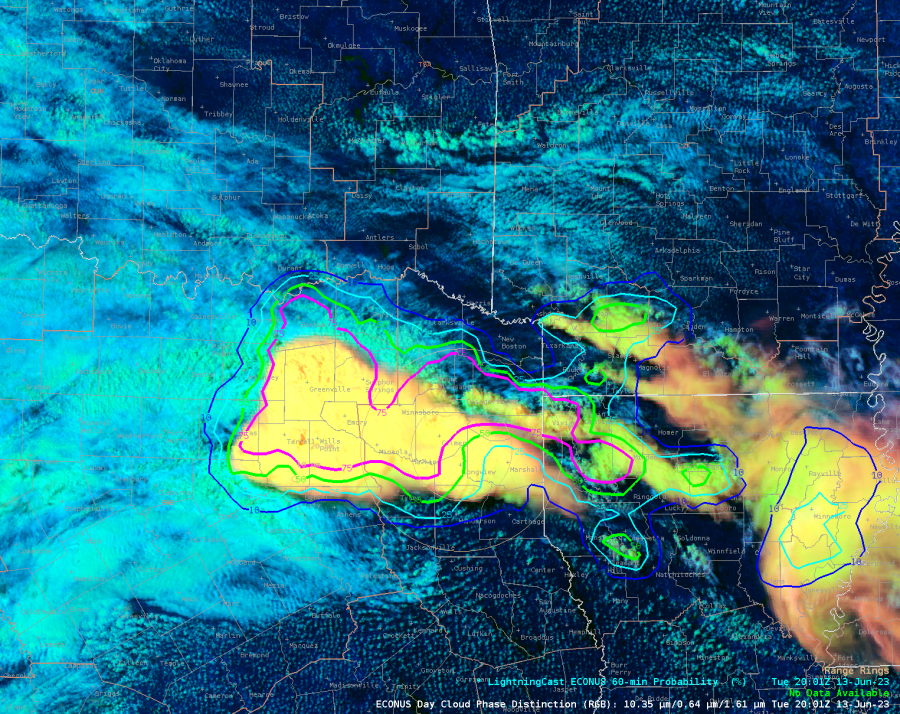
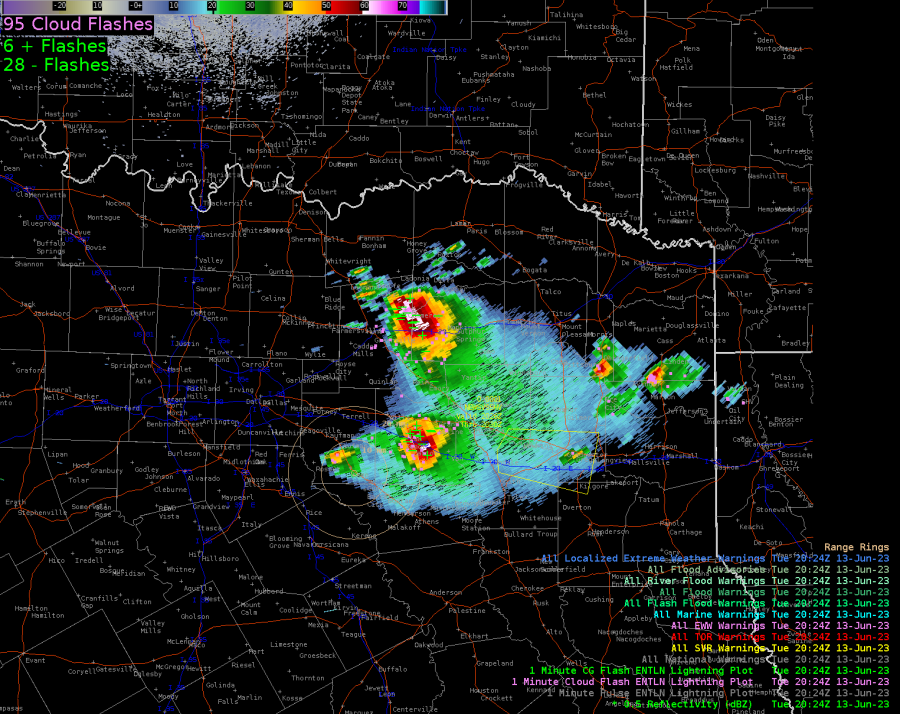
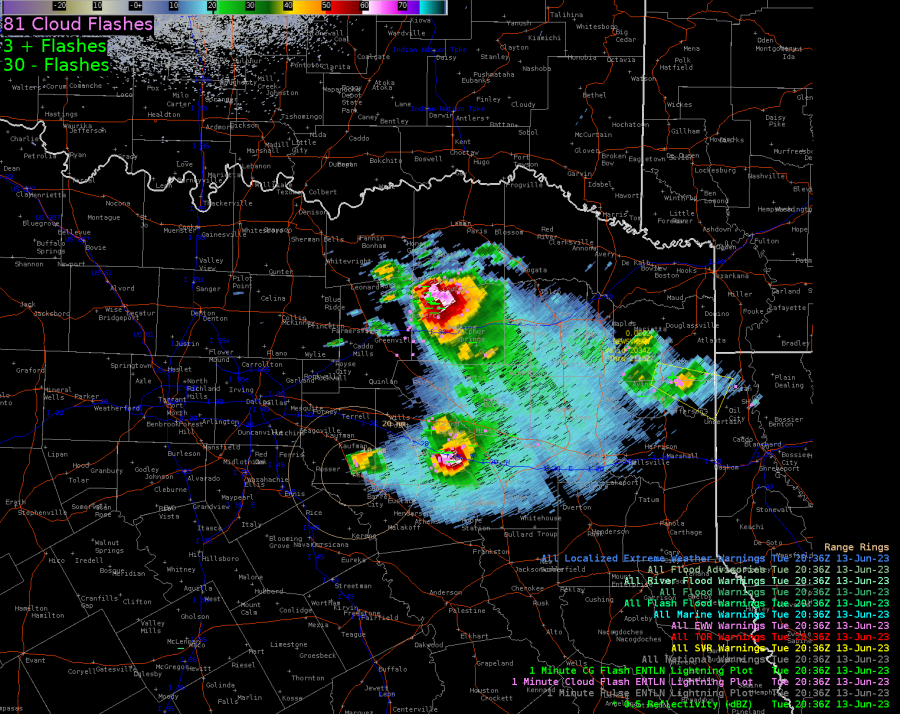
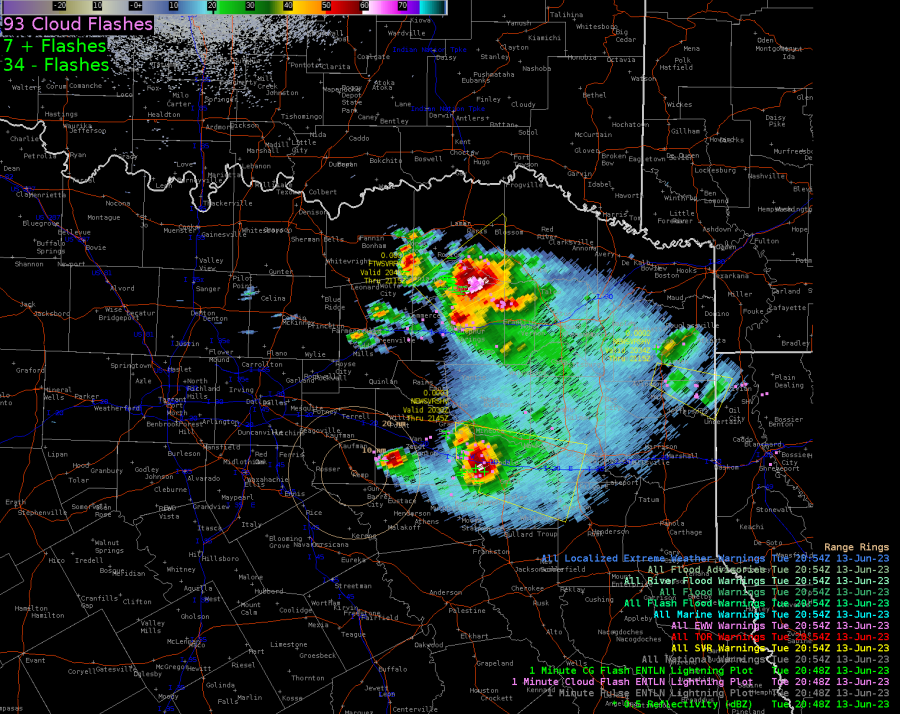
Overall, I used OCTANE, PHS, ProbSevere 3 and LtgCast today. NUCAPS wasn’t really accessible. Worked the DSS event, an Air Show, which was canceled due to severe thunderstorms all afternoon producing tornadoes, large hail and damaging winds. DSS for this event would have been done days ago.
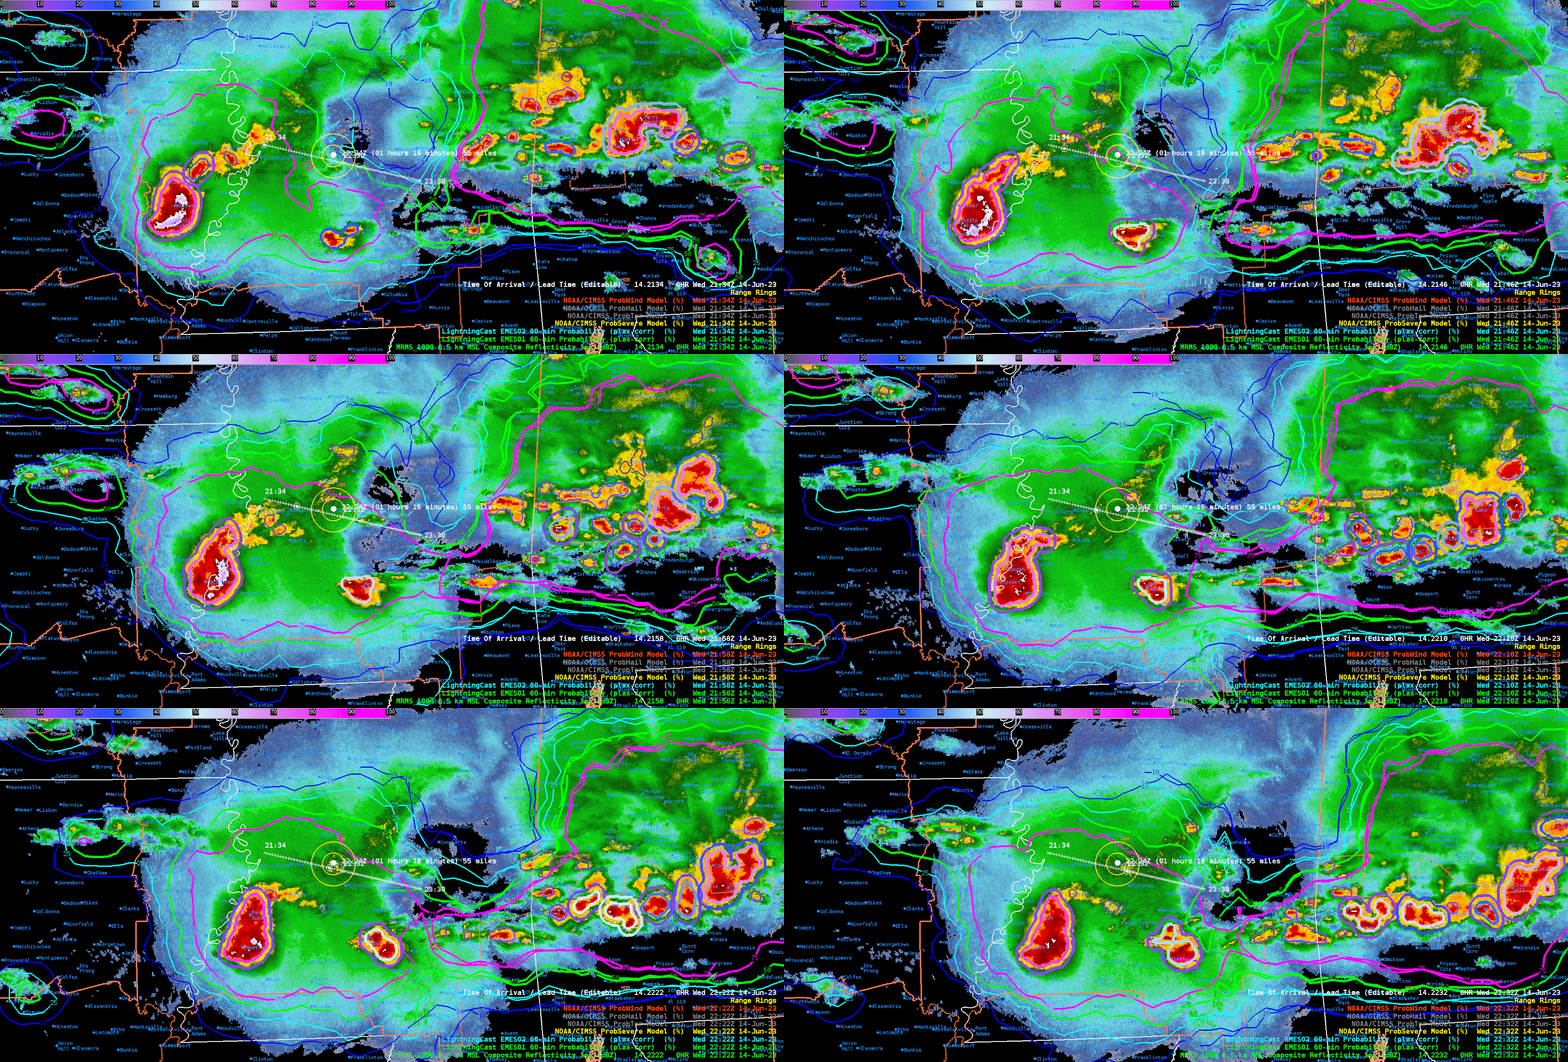
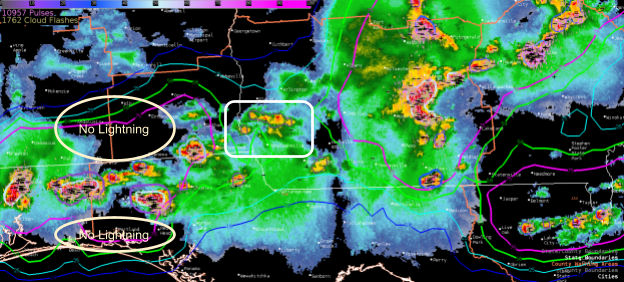
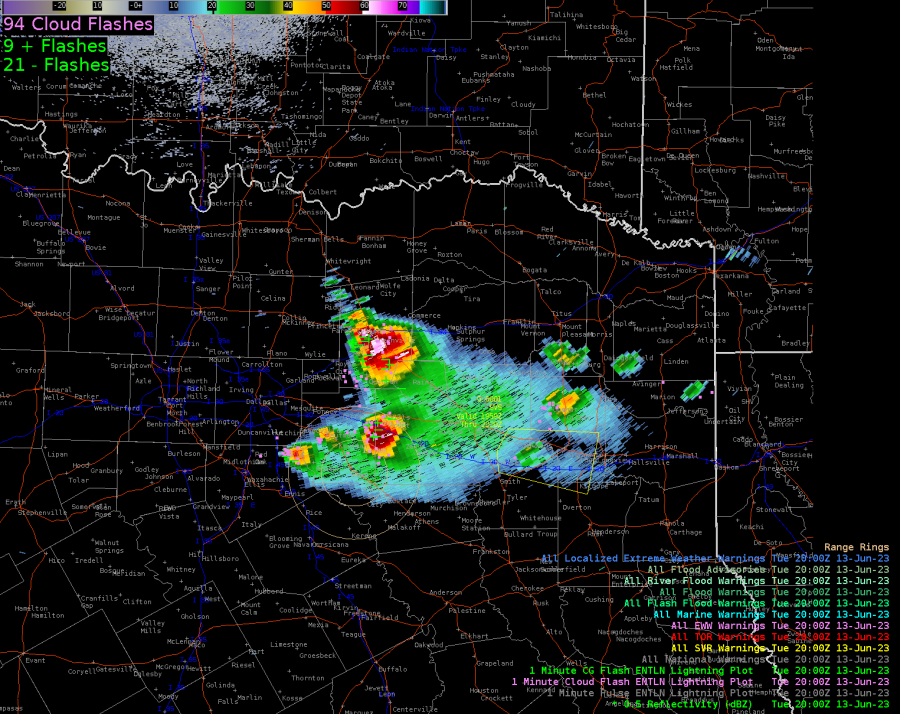
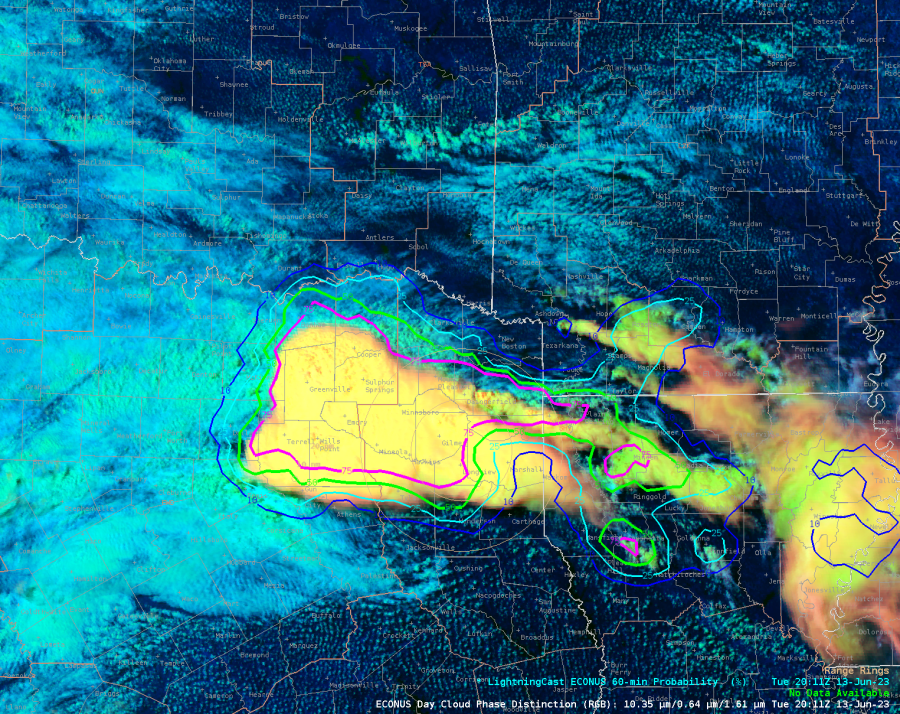
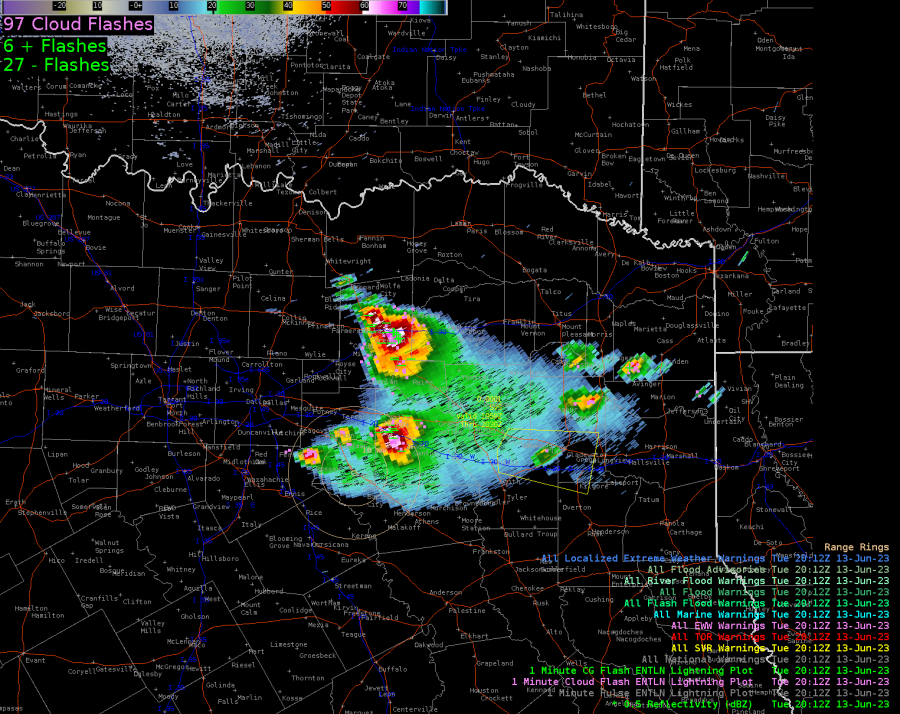
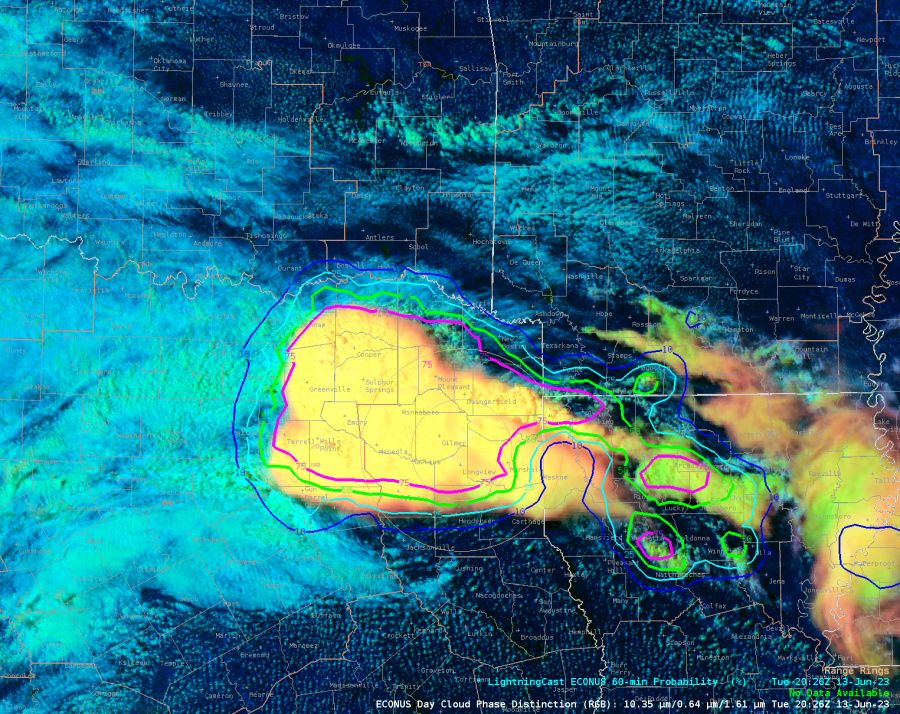
Below is a shot of LtgCast on a radar background and ELN measured lightning, the +/- are positive and negative ground strokes, and the cyan dots are in-cloud. It is interesting how the 75% probs lead out into southwestern Georgia though the showers there are more stratified and lightning isn’t expected, yet it gave about 45 minute notice of lightning strikes; that’s a good thing. But how useful is this? It predicted a few single lightning strikes tens of miles apart scattered across 100 miles which isn’t really useful; would you stop all outdoor activities across ¼ of Georgia for a few stray strikes? Would you clear the baseball field because a lightning strike will hit in the next hour somewhere within 50 miles? Not likely, but knowing there is some chance is valuable information for an event coordinator for risk analysis. If they can make minor changes to activities with little or no impacts, it helps, especially if it’s an area where lightning isn’t expected. What would be a big plus would be an estimate of flash density/frequency expected to go with the probs. That gets back to tracking the convective cells to predict areas of dense lightning. We have radar and ELN’s for that.
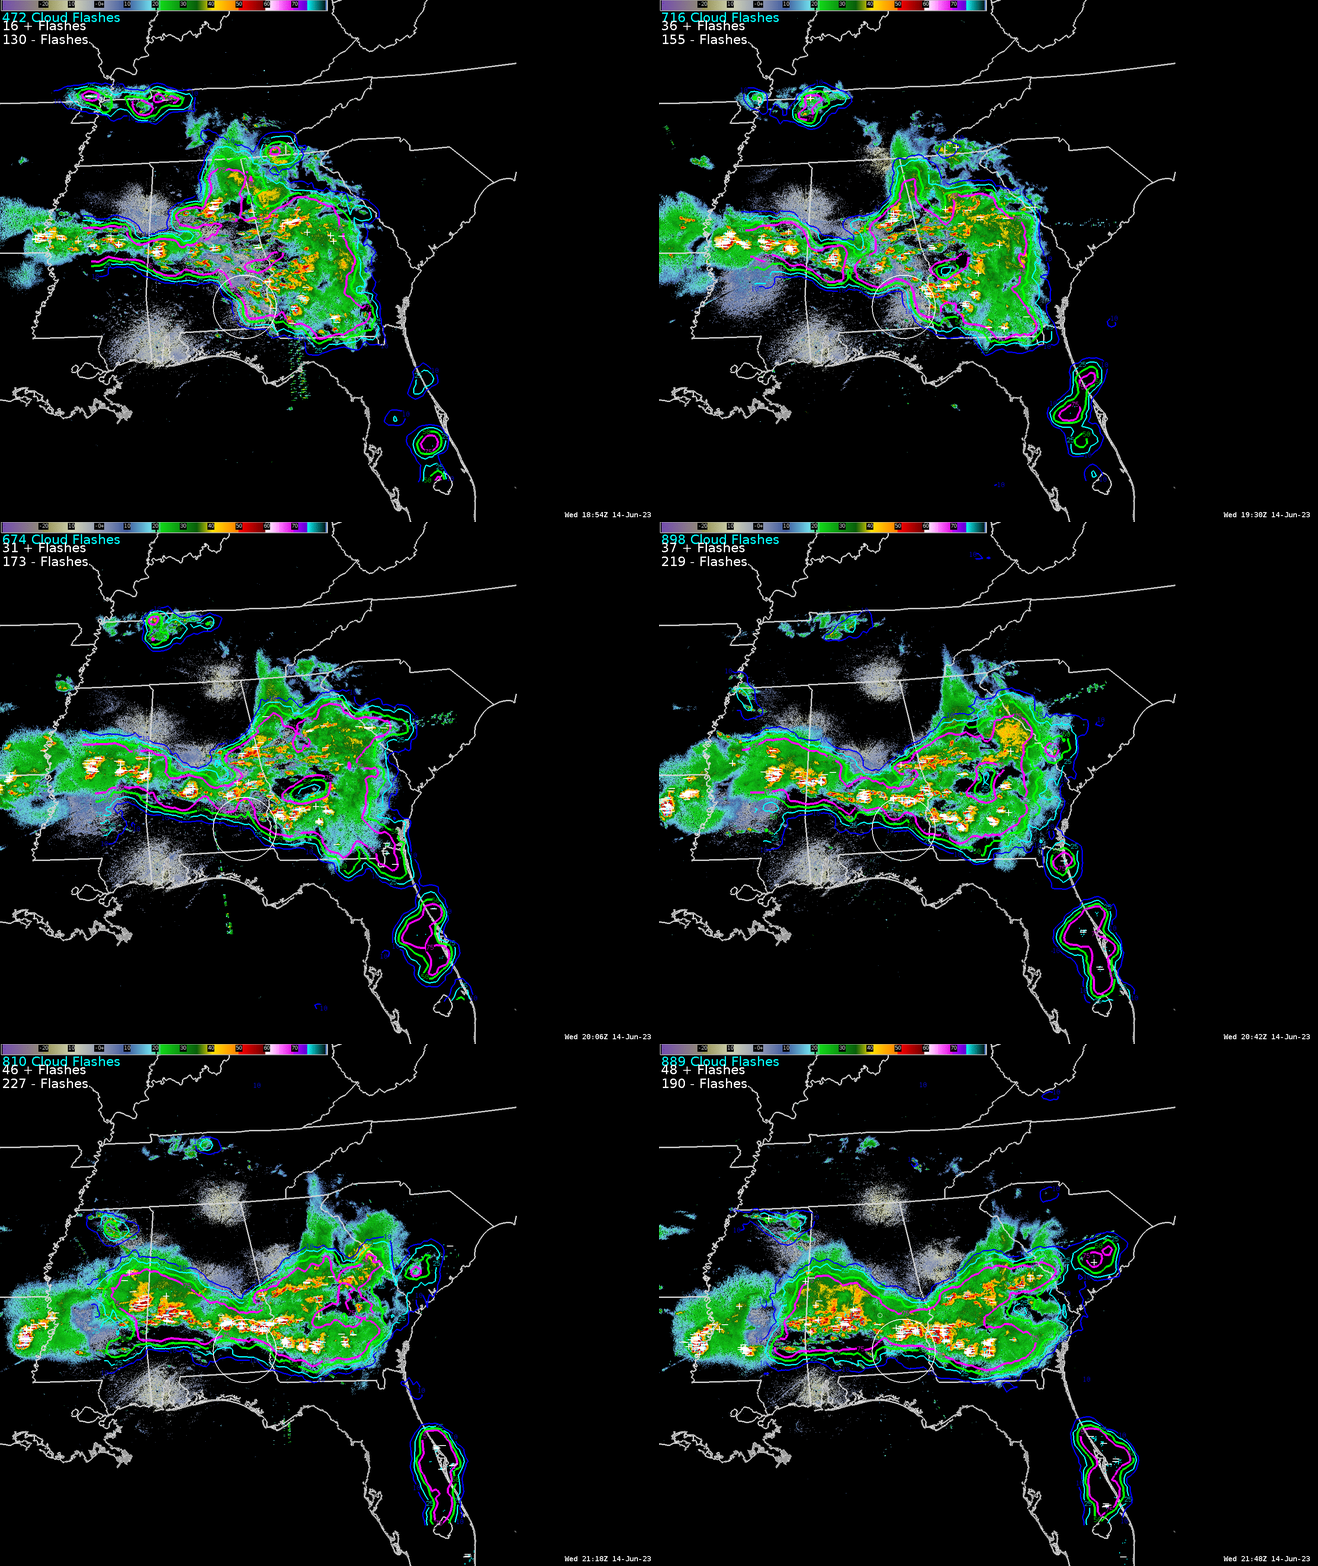
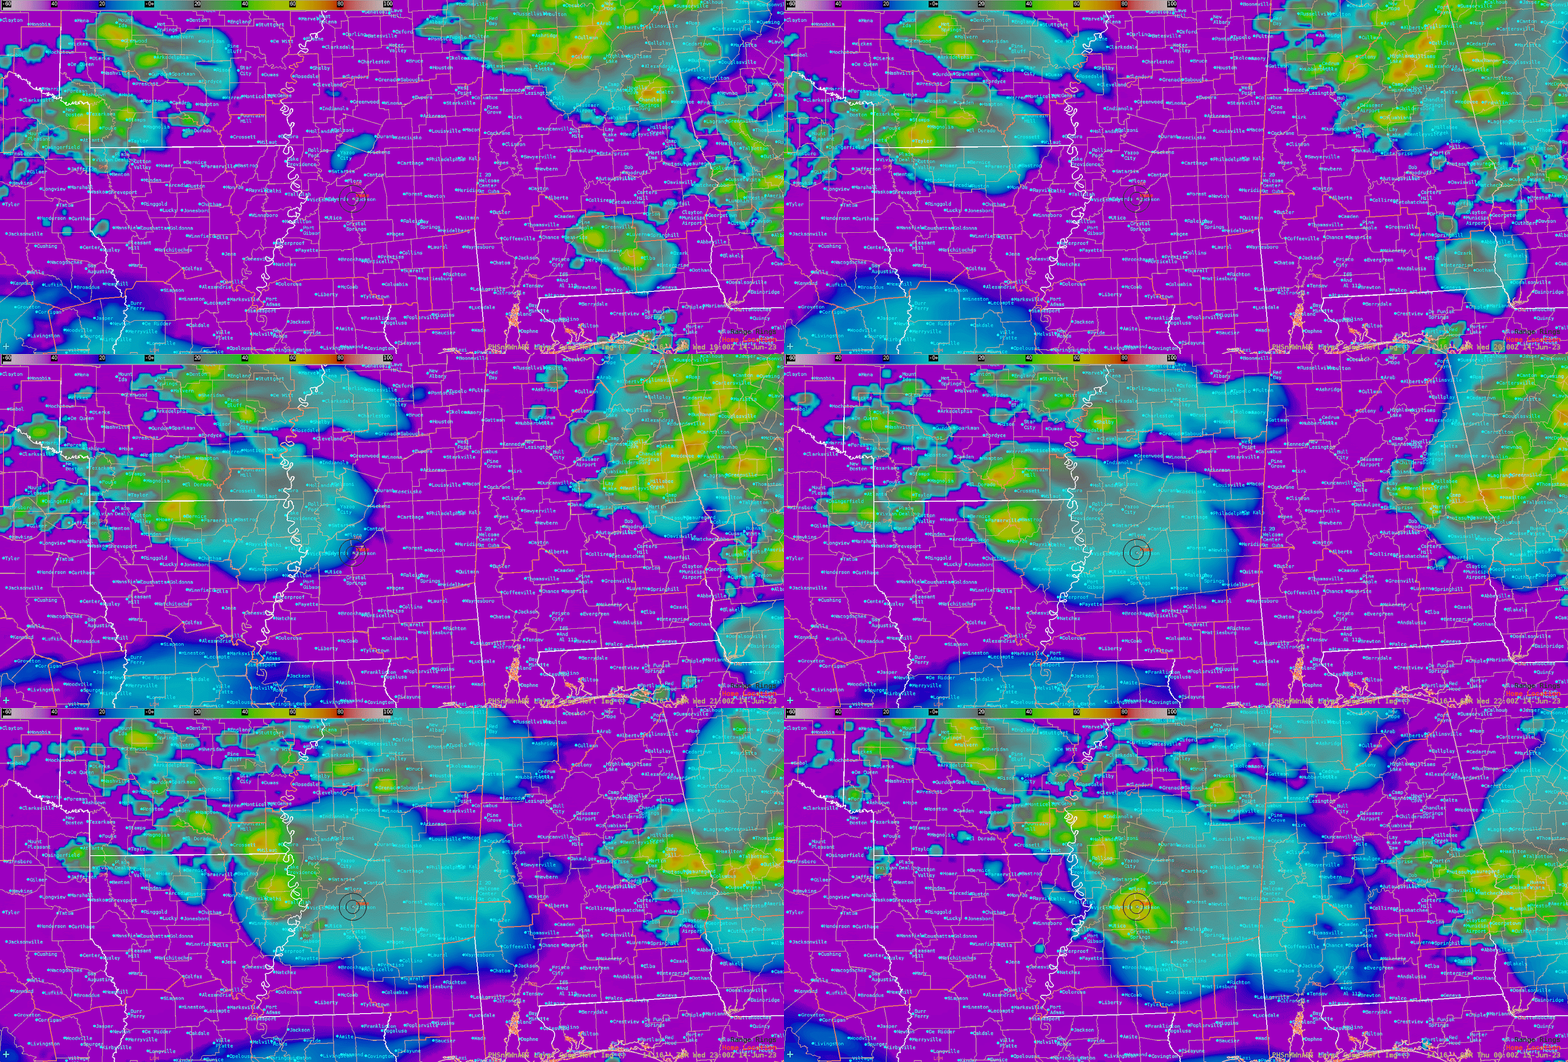
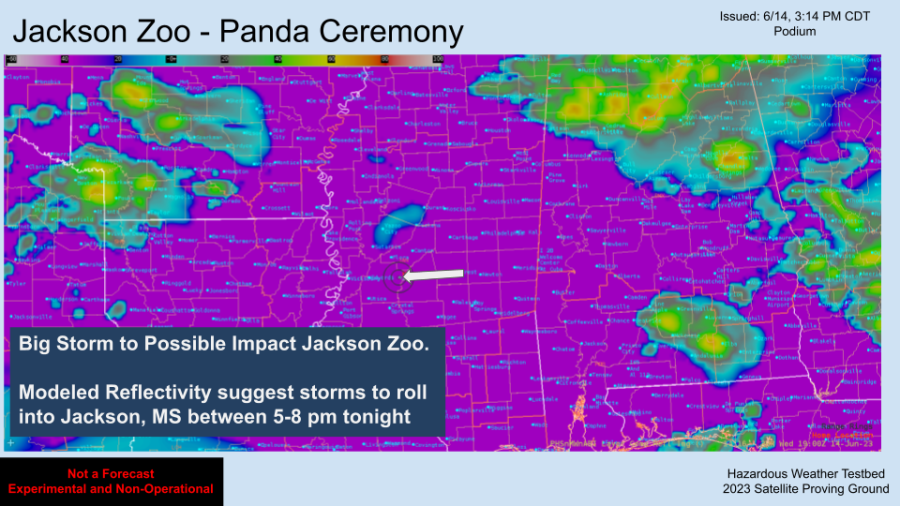
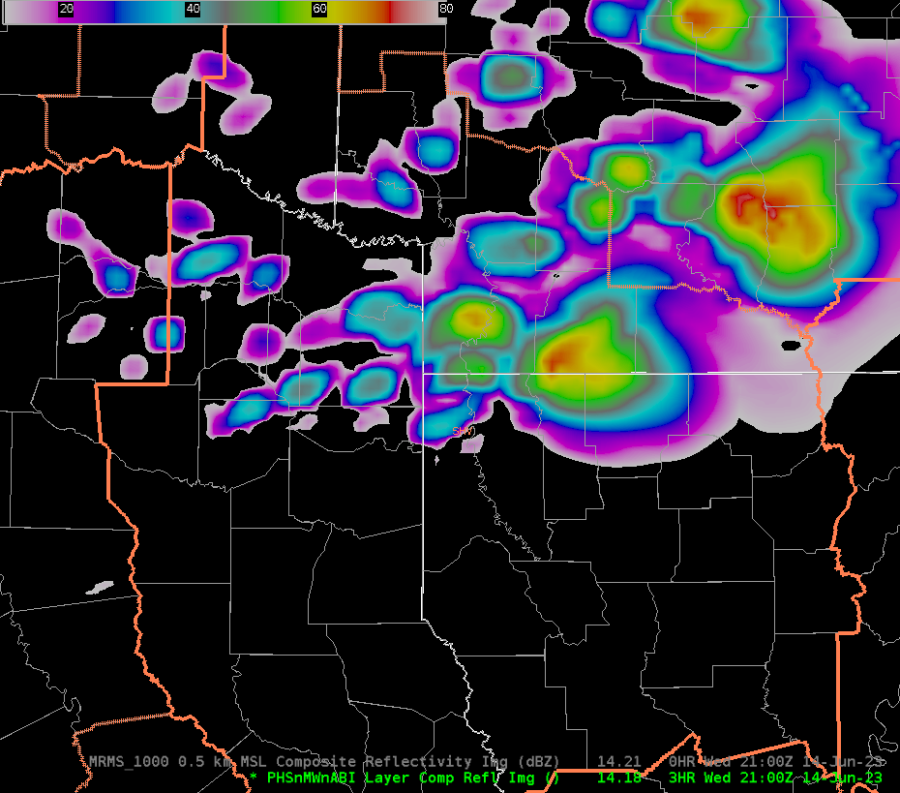
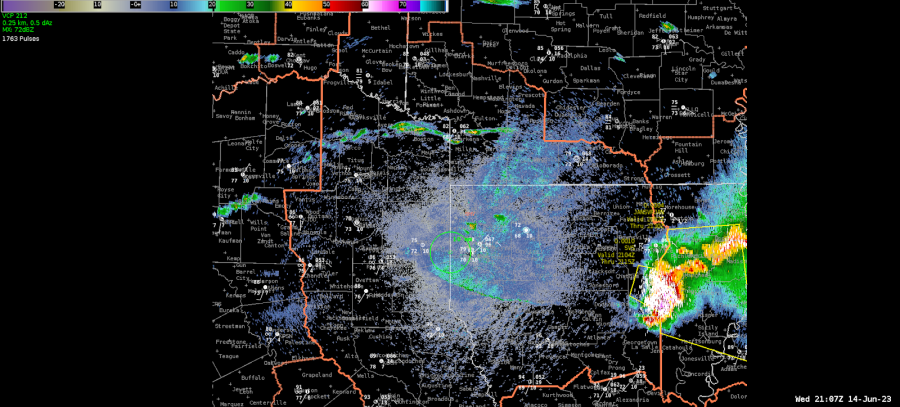
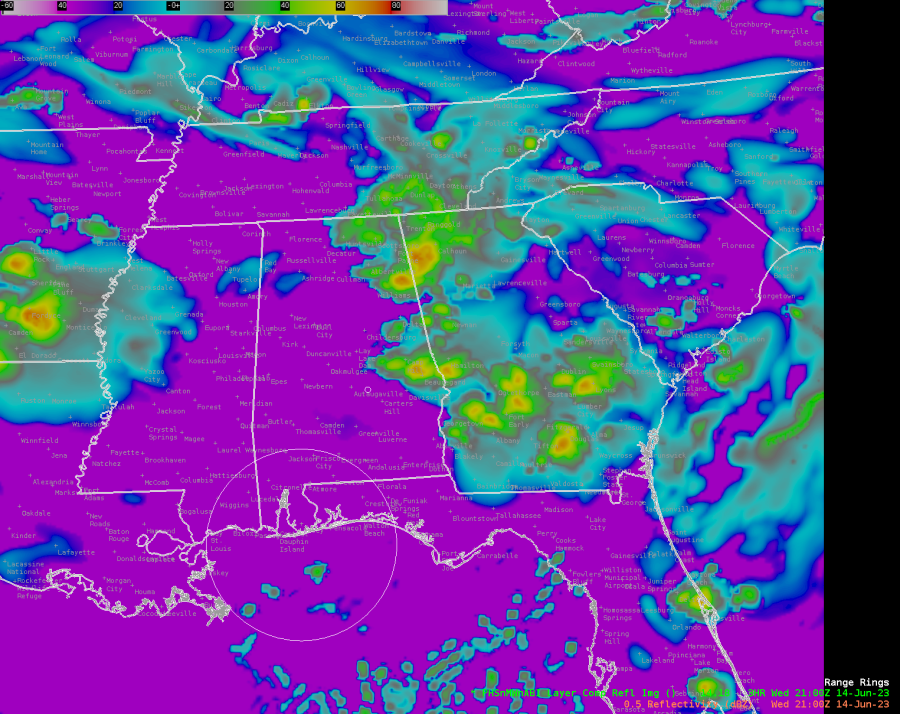
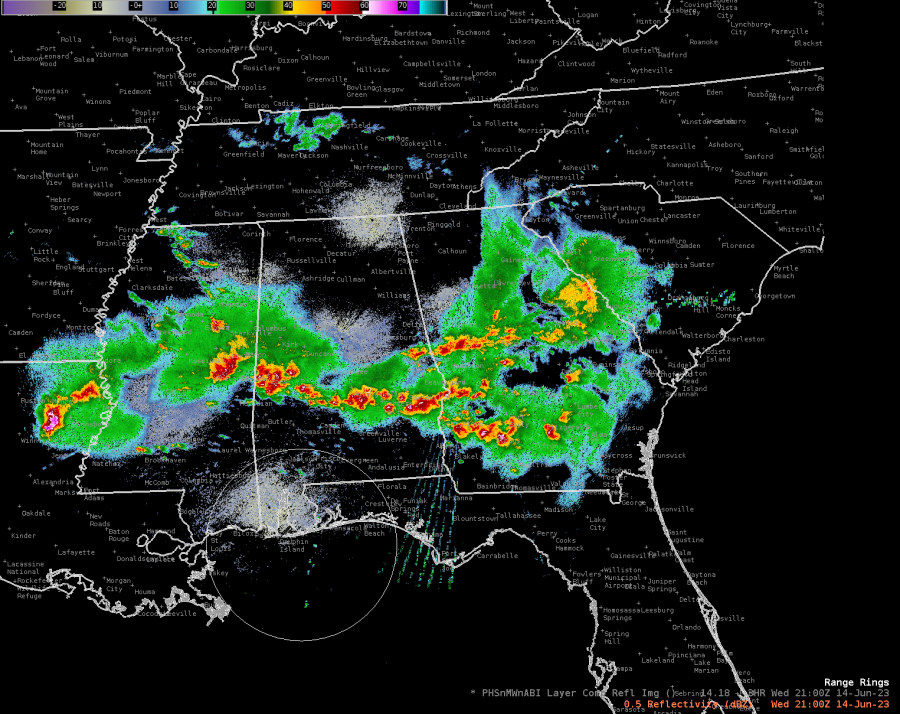
PHS composite reflectivity vs radar at 21Z… I find little value in the PHS composite reflectivity product. Below you see PHS composite reflectivity compared to the radar returns at 21Z. It’s not doing too well and I haven’t seen a time when it has done well predicting where the storms will be. The HRRR, NSSL WARF, HRef, NAM Nest and other high res models do much better.
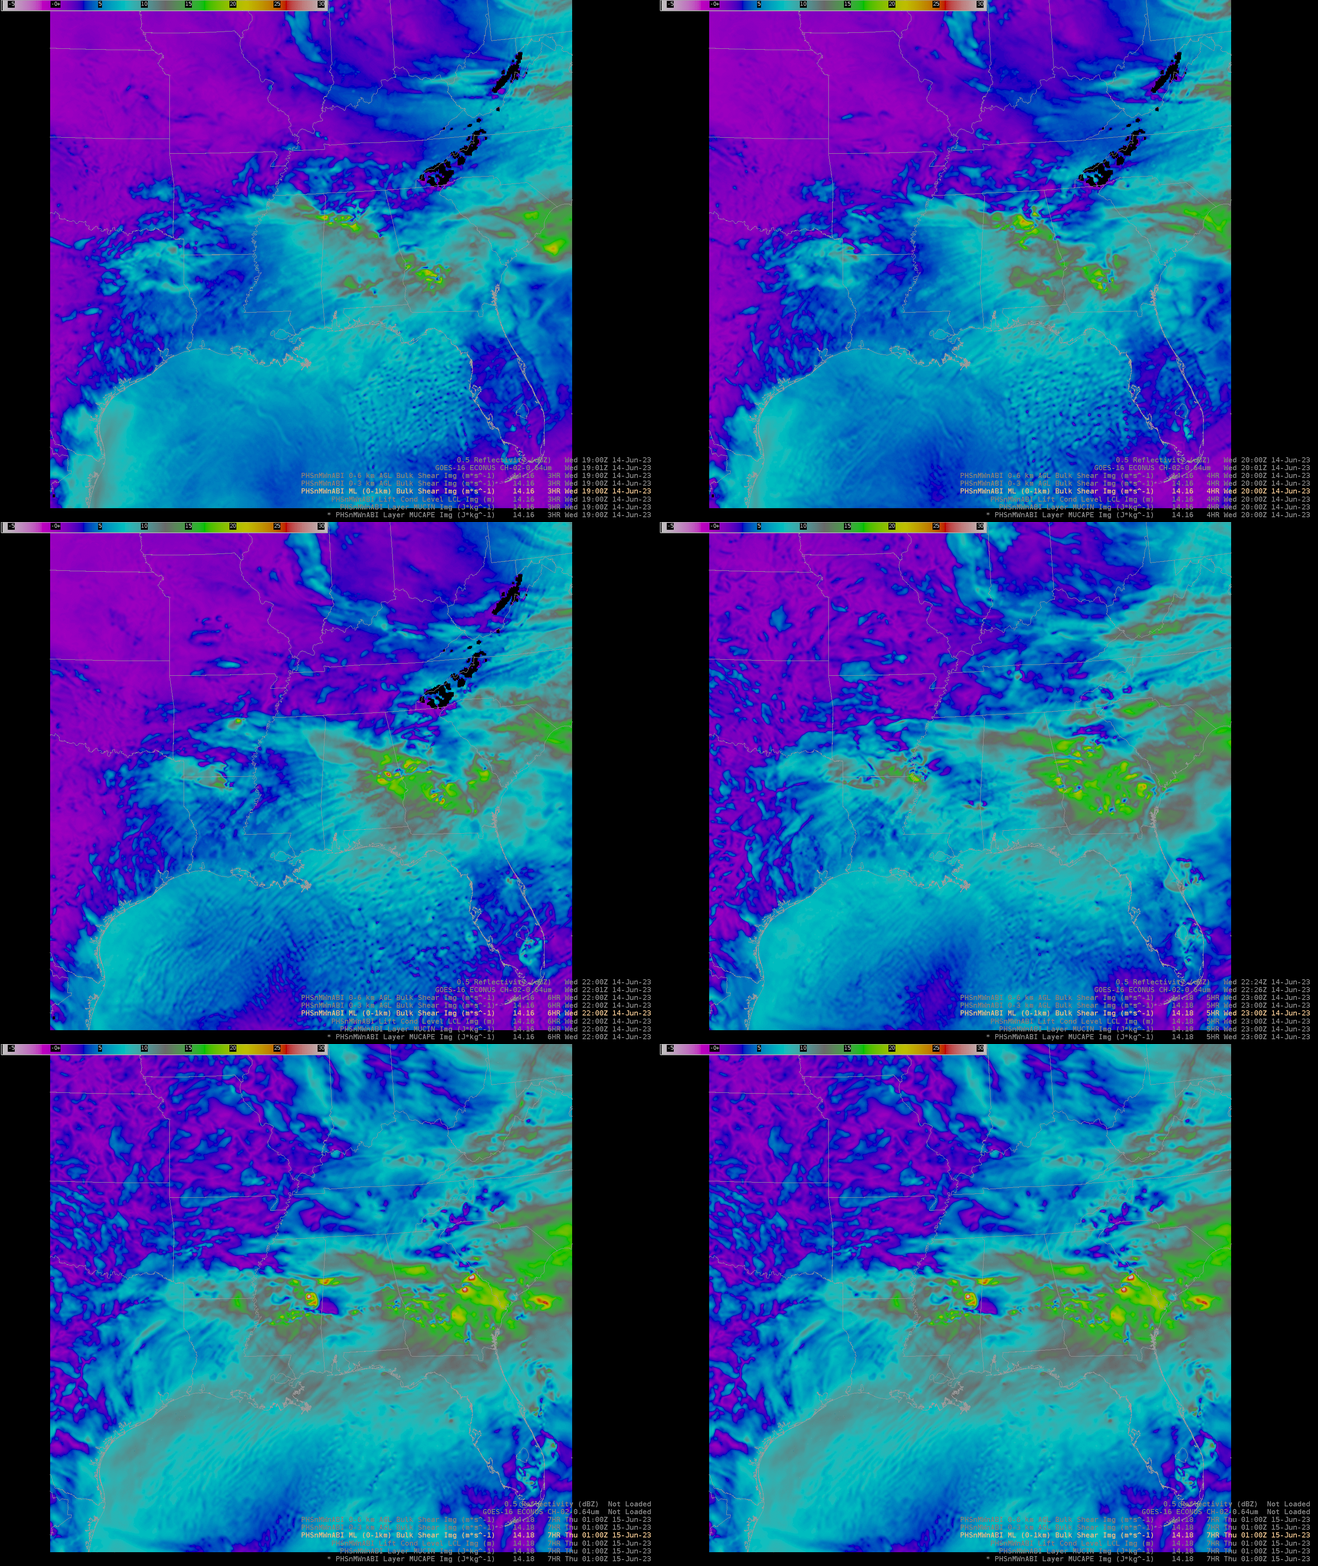
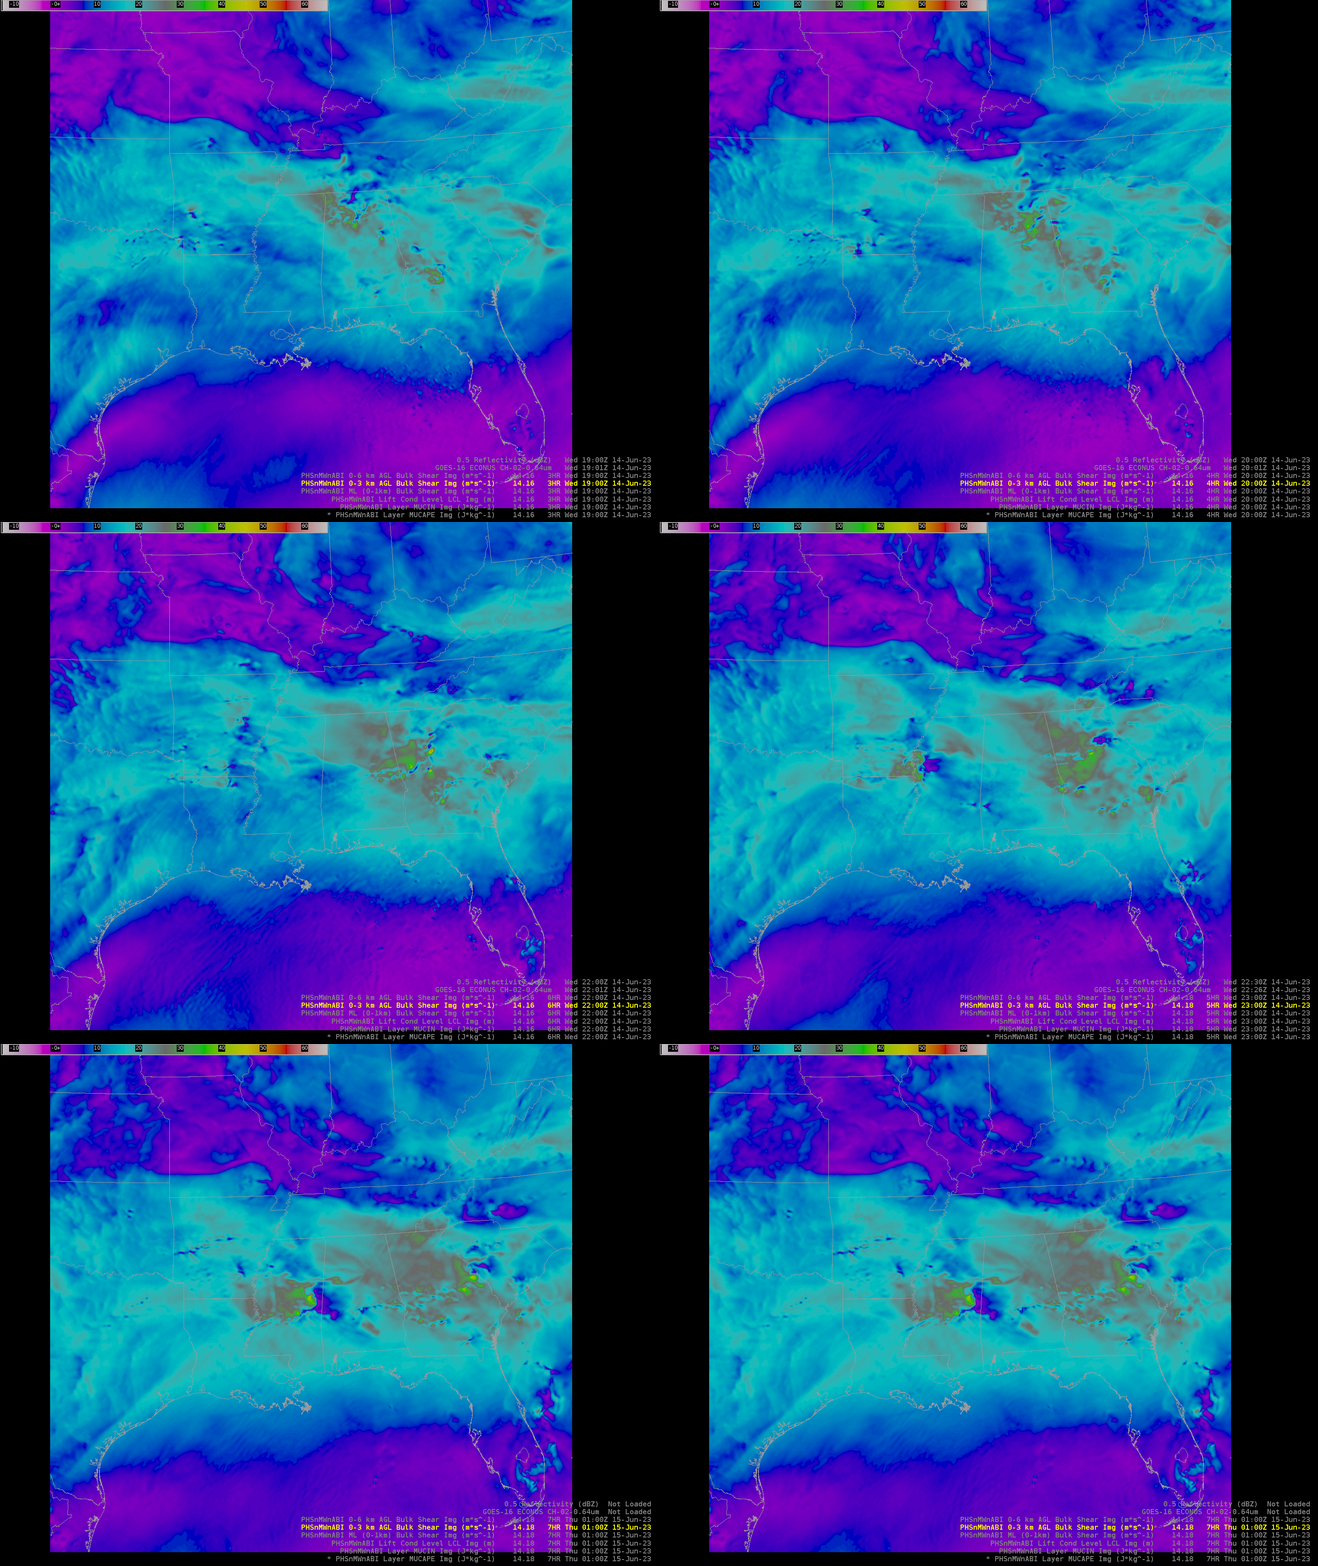
PHS Bulk Shear 0-1 km below on the left and 0-3 km below on the right both show a line between areas of lower and higher shear along the boundary where the severe storms were tracking, but this occurred after the convection started. I don’t see a pre convection signal pointing to where the training storms formed.
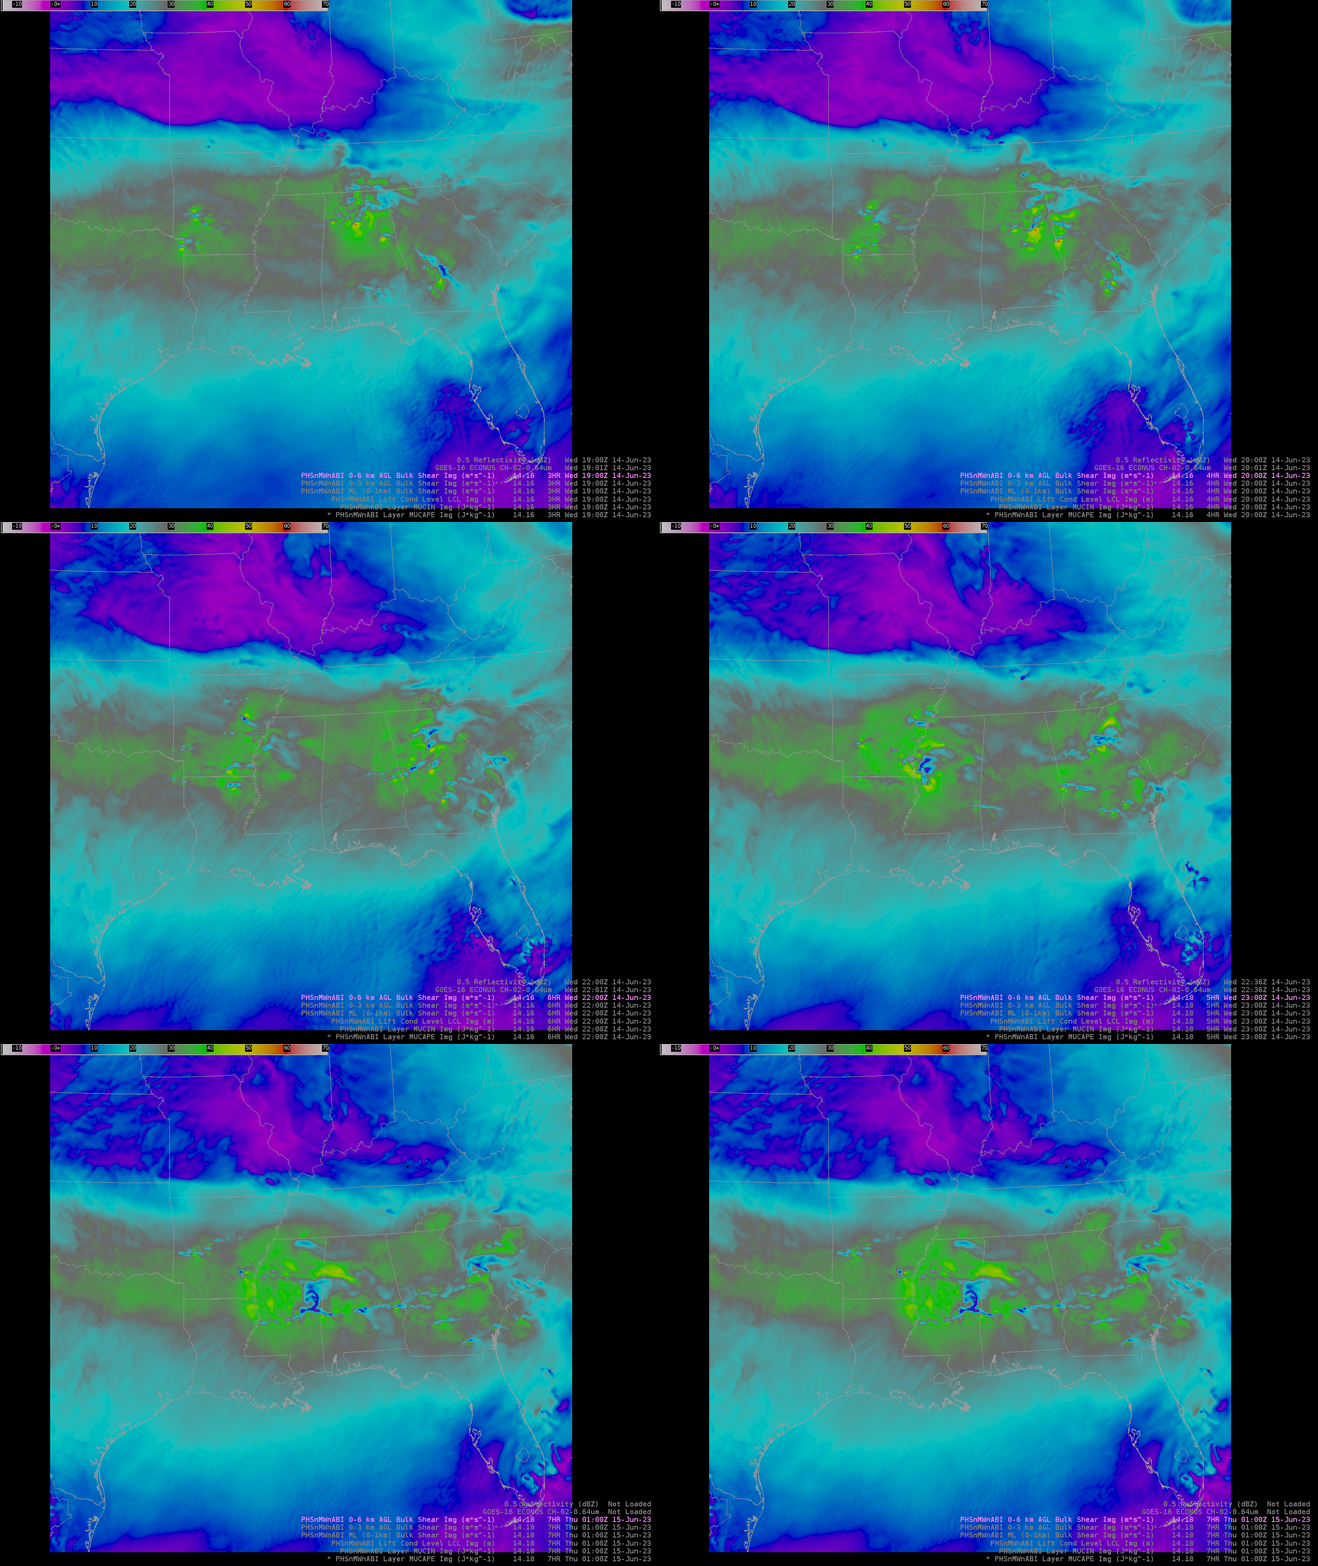
The Bulk Shear 0-6 km below shows more promise with the 19Z frame showing a boundary where the training severe storms formed/tracked (what did it look like at 16Z or 17Z?). I would need to see more of this pre convection to really make a judgment, and would need to see positive validation/verification to have any confidence in it as a tool.
– Super Bolt

