Our group role played as ABQ on June 12, 2023, where severe convection was already underway in the northern third of the CWA during the early to mid afternoon. Rather than interrogating ongoing storm strength and hazards, we were curious as to whether or not additional severe convection was possible south of the current convection. In essence, we were performing tasks of a mesoanalyst.
The synoptic environment was composed of upper troughing over the Great Basin region, with a stout, unseasonably strong mid to upper level jet at its base overspreading New Mexico, and a shortwave trough pushing out of the Four Corners into southeastern Colorado as well as northern New Mexico. GOES-16 mid level water vapor imagery showed the location of the bulk of synoptic forcing through steadily cooling brightness temperatures (not associated with deep convection). Overlaying NAM 500mb geopotential heights helped illustrate where strongest height falls associated with the shortwave trough were located. In this case, strongest height falls/cooling brightness temperatures were located within southern Colorado into far northern New Mexico, and was driving the ongoing severe convection in northern ABQ. However looking south and upstream within central New Mexico, there were still cooling brightness temperatures within water vapor imagery, just not as robust relative to the north. This implied there was still some synoptic forcing for ascent to overspread areas like San Miguel, Guadalupe and De Baca counties, the counties we were most interested in for additional initiation.
Another display we referenced to assess low level moisture content was GOES “Clean LWIR 10.3um – Dirty LWIR 12.3um” Split Window Difference sandwiched with visible imagery to show current areas of Cu development/maintenance. This showed low level moisture pooling up nicely along higher elevation of the Sangre de Christo Mountains southward to the higher elevations along the western flanks of the southern High Plains, along with agitated Cu at the terminus of these moisture gradients. Additionally, local areas where there were easterly pushes of the moisture gradients suggested dryline dynamics were at play, potentially providing additional forcing for ascent.
After assessing the current state of the environment, we referred to PHS Layer Composite Reflectivity, which is simply just simulated reflectivity offered by the WRF that runs within PHS environment that incorporates latest hyperspectral sounder information on thermodynamics via polar orbiting satellites while merging it with the motion and high spatiotemporal resolution of GOES ABI . The 18Z model run indeed sparked additional convection off of the higher terrain within Guadalupe County.
So in the eyes of this model, the potential was still there. It was also nice to compare current radar (in this case MRMS Composite Reflectivity) in the same display as PHS reflectivity to see how the model was performing in this aspect thus far.
But let’s not take this for face value as this is modeled convection. We desired other datasets to help provide insights on the thermodynamic environment that may play a role in allowing additional convection, or lack thereof. With this, we referenced other datasets within PHS:
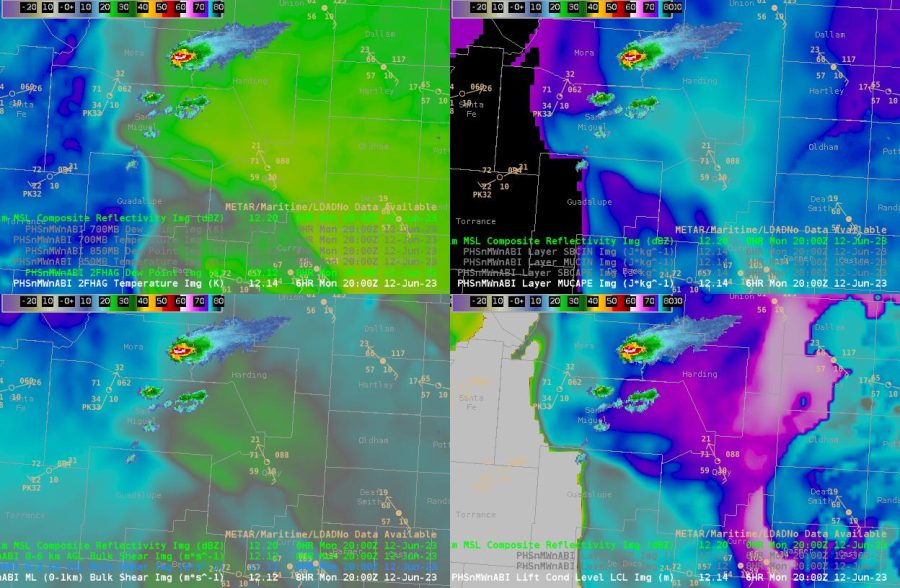
This display shows MRMS Composite Reflectivity and surface observations overlaid with PHS thermodynamic parameters in the top and right halves, and shear parameters in the lower left. Focusing on the two right panels, PHS suggested moderate instability (~1500 – 2500 J/kg) lee of the southern Sangre de Christo Mountains into the southern High Plains of northeastern New Mexico, with perhaps slightly lower instability within Guadalupe and De Baca counties. More interestingly was the stark increase in LCL heights within these counties compared to the environment just to its north. This raised a yellow flag, leading us to to think thermodynamics may not be as favorable as the area with current convection. Perhaps relatively drier air may be located in this area of interest compared to that currently driving convection? We referred to other satellite-derived datasets like NUCAPS soundings, Gridded NUCAPS and NUCAPS-Forecast (not shown) to assess upstream mid level moisture (namely 700 mb RH) advecting into the area, of which reveals a well developed and strong EML with notably strong inversion nested around 700 mb. We also referenced PHS CIN (not shown) which exposed a relatively higher area of capping in this same area where LCLs were higher.
It was nice having the high spatial and temporal resolution offered by PHS when performing mesoanalysis, and in my opinion had an advantage over objective analysis (e.g. SPC Mesoanalysis), with its higher resolution and ability to step forward in time on an hourly basis.
Here is the full loop of this PHS display between 18 UTC to 23 UTC:
Within our area of interest, the considerations of relatively higher CIN, strong EML advecting over this area, relatively weaker forcing compared to points north, we had some concerns that sustained convection would develop, but we still didn’t discount the possibility should enough subtle forcing via synoptic (DCVA/height falls) and mesoscale (dryline) lift contribute together to overcome locally higher capping likely in place. Ultimately, we gave around a 20-30% chance of additional severe convection within Guadalupe and De Baca counties in the next 1-3 hours starting at 21Z.
Just before today’s HWT window closed, OCTANE hinted at attempts of deep convection within central San Miguel County via the warming colors collocated with agitated Cu turned orphaned anvils behind exiting deep convection. This was advantageous as it caught our eye perhaps faster than Day Cloud Phase Distinction RGB indicated for attempts at deep convection.
Ultimately, deep convection did not occur within Guadalupe and De Baca counties.
– OSMBLSN

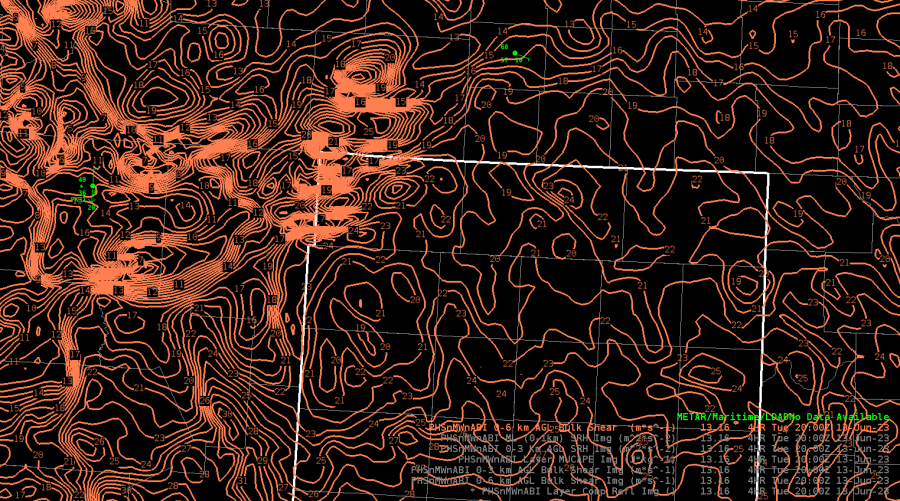
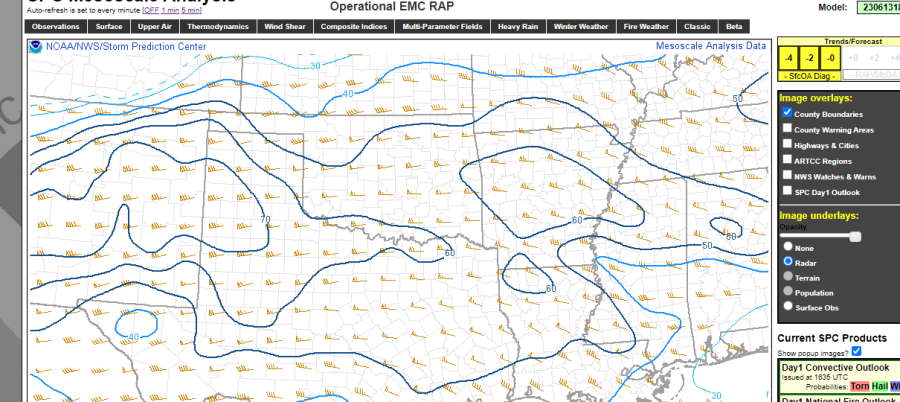
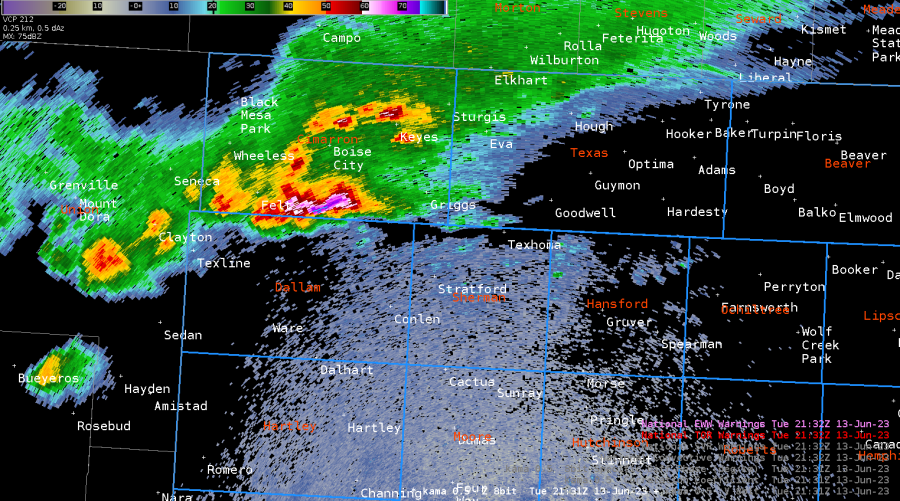
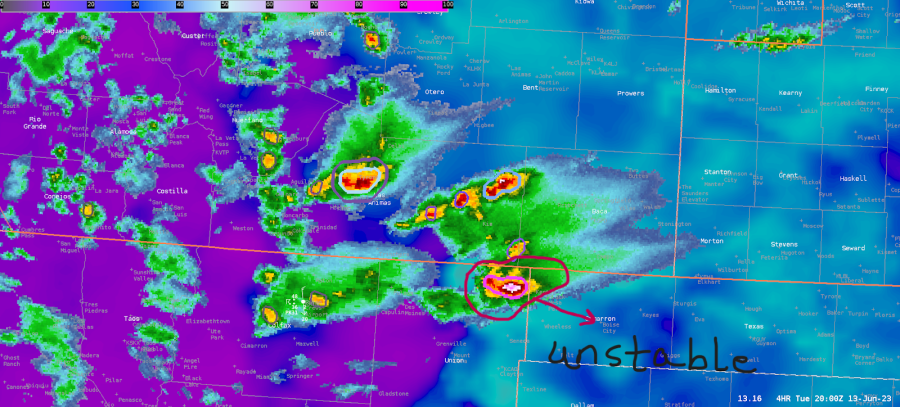
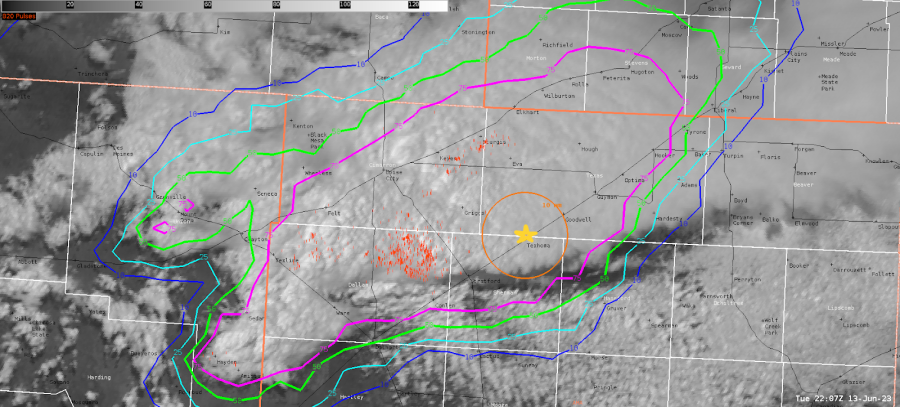
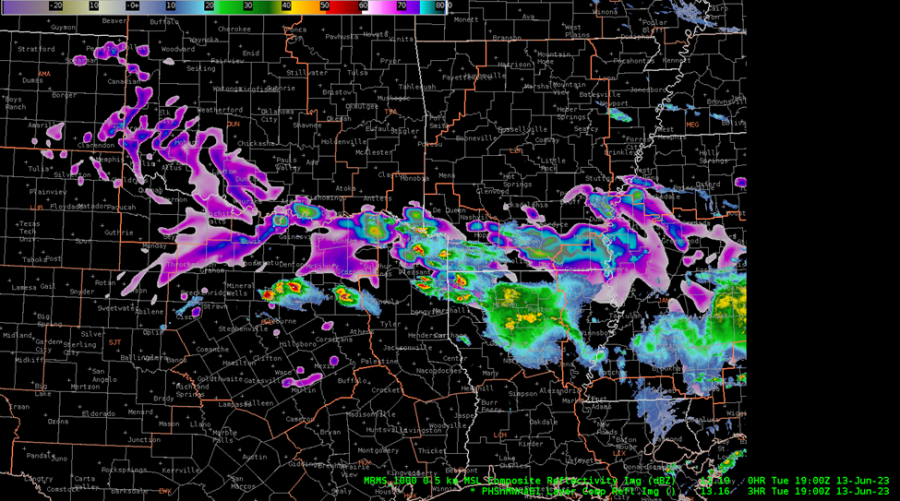
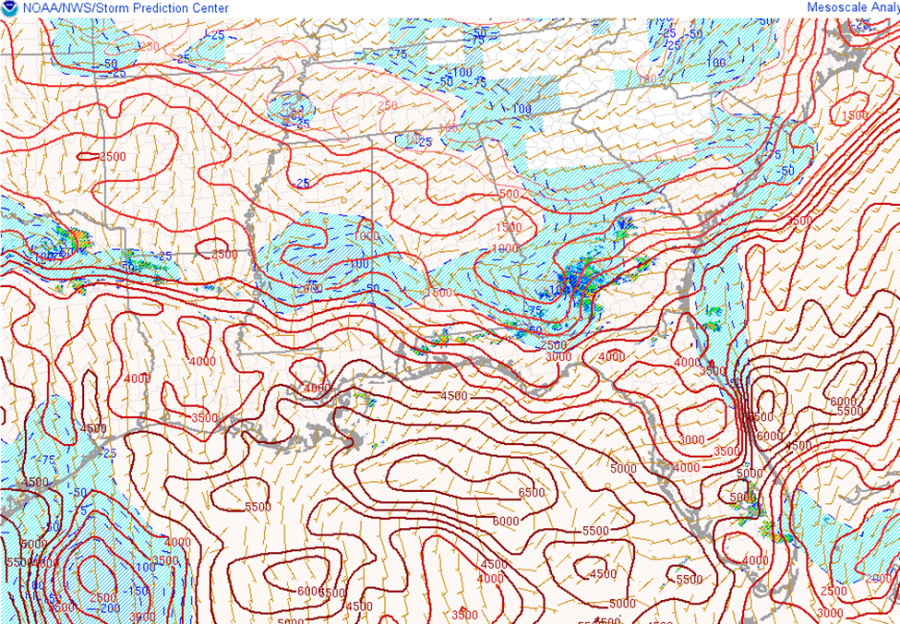
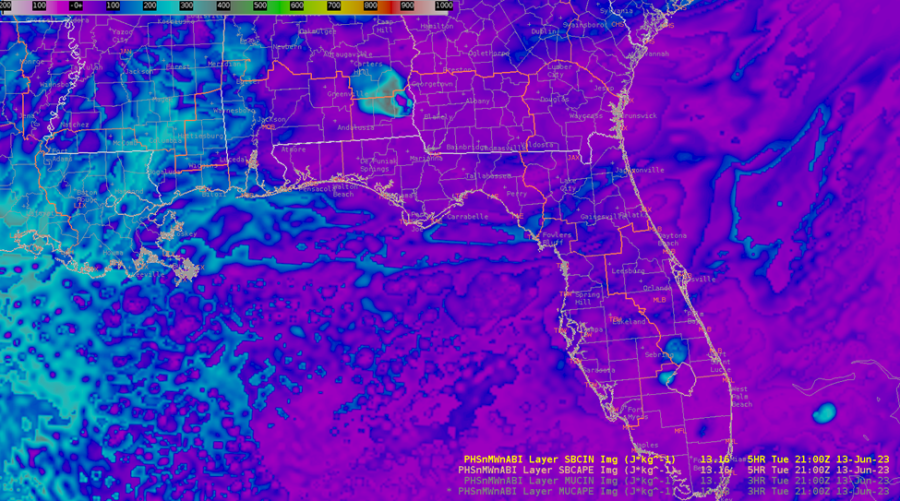
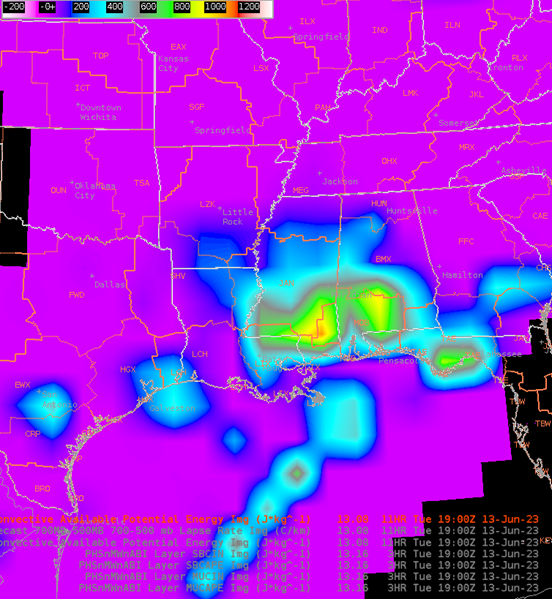
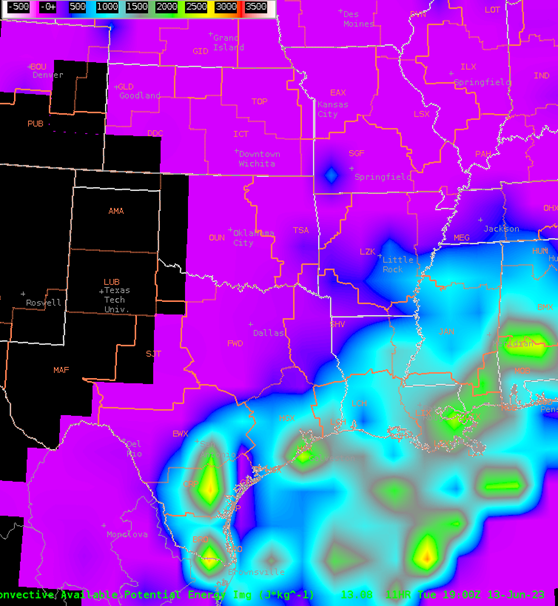
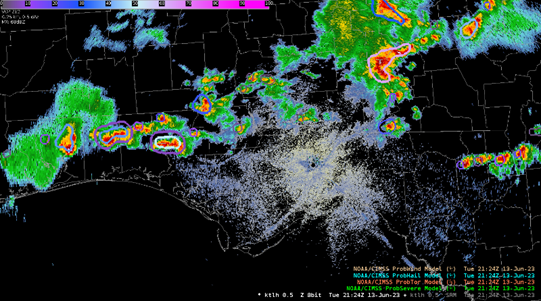
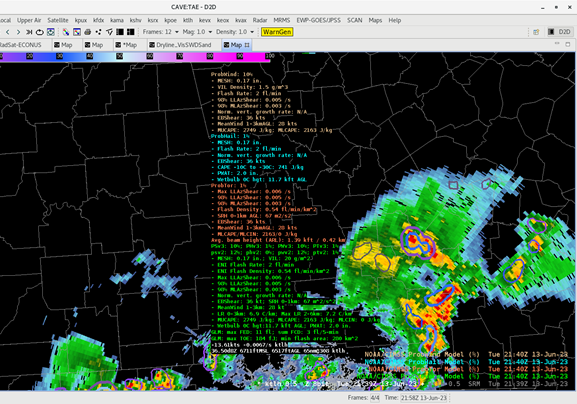
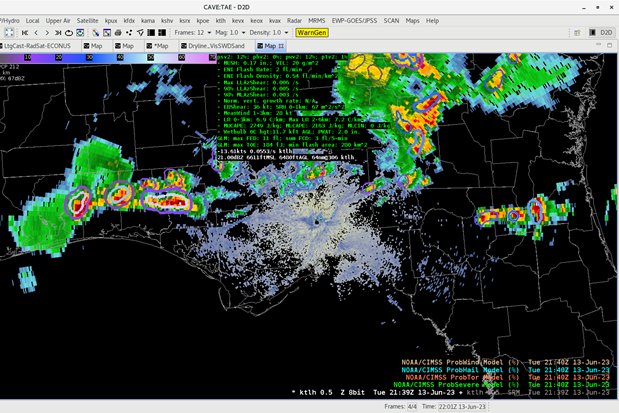
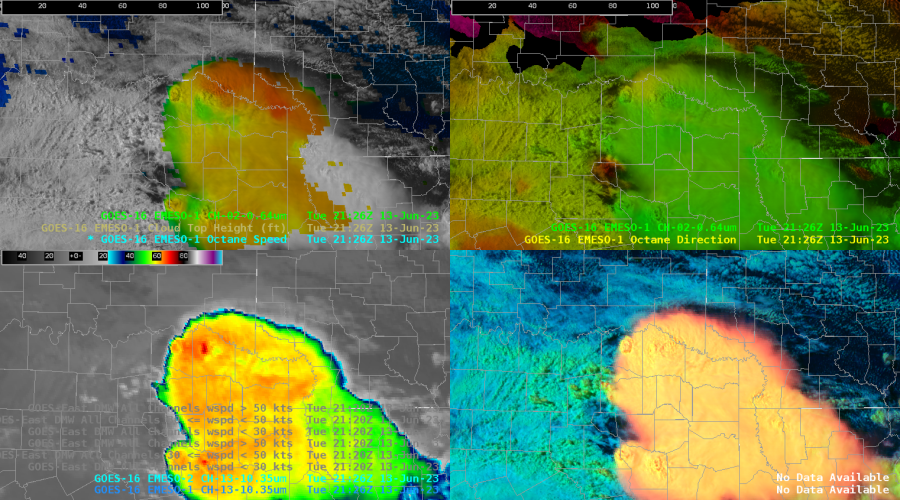
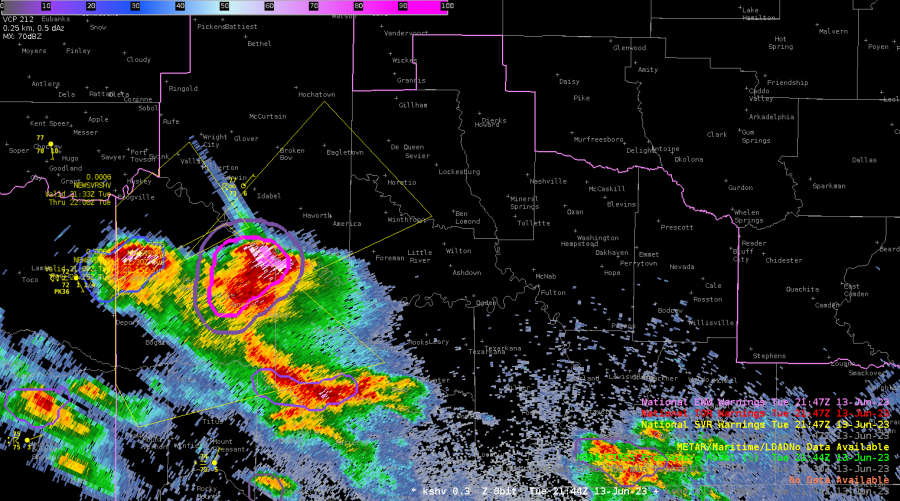
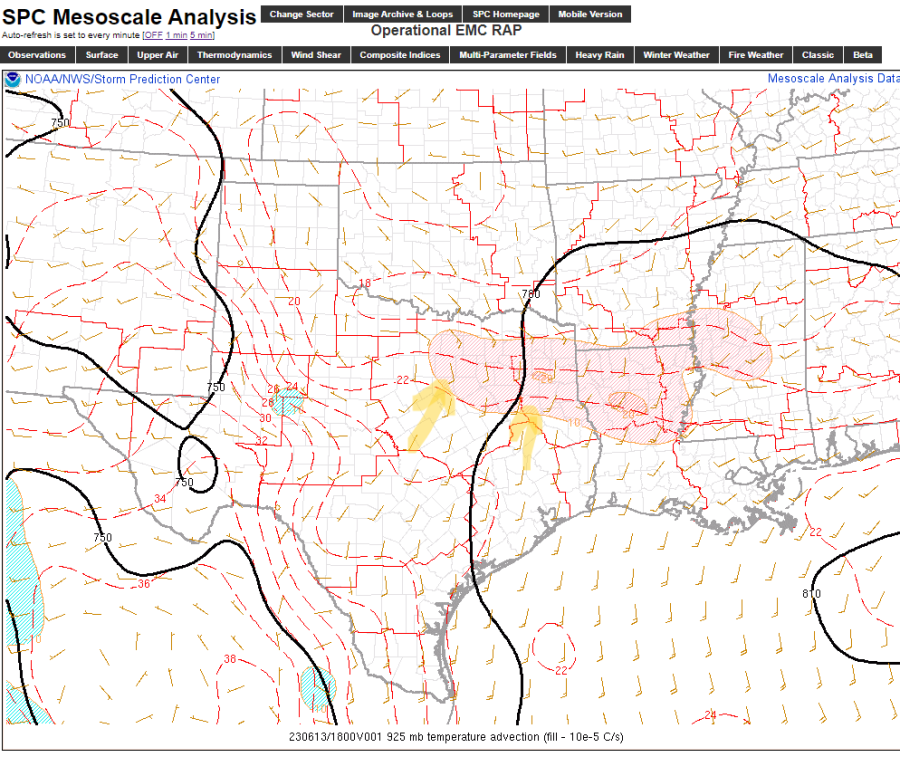
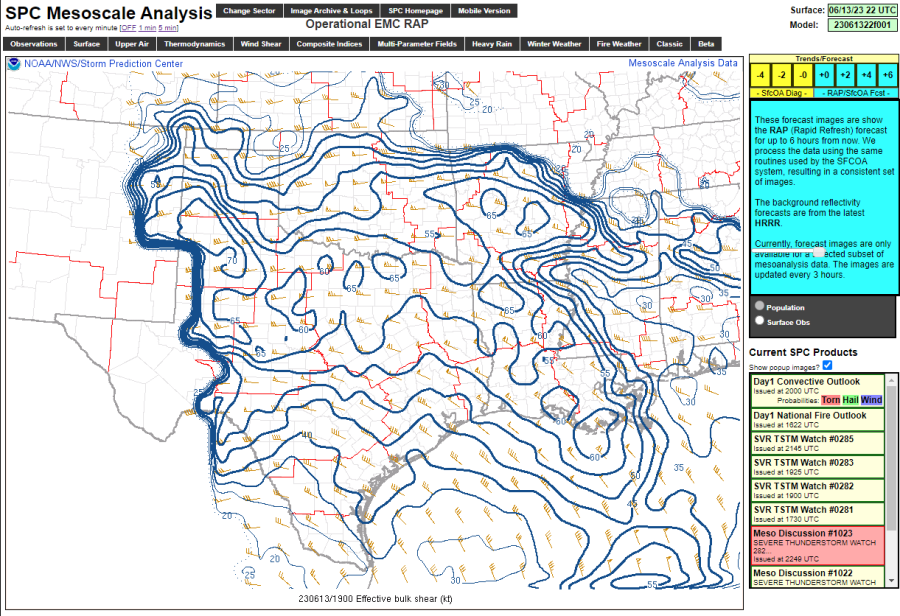
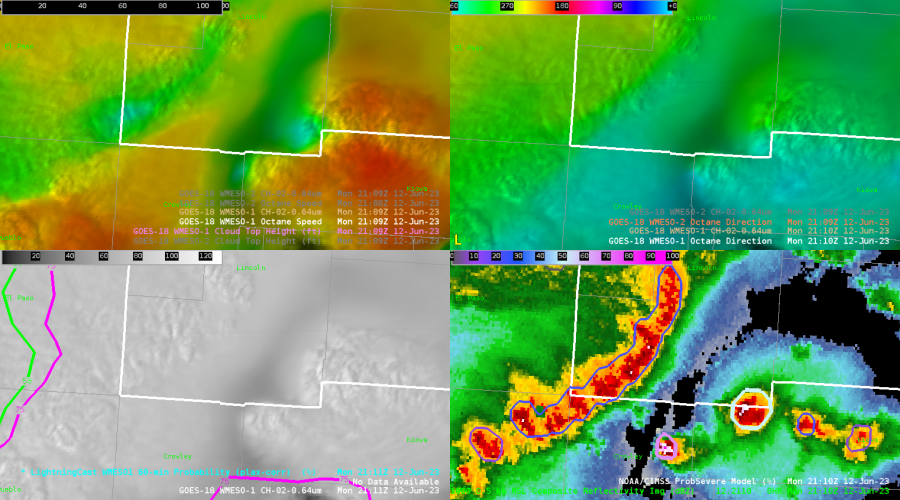
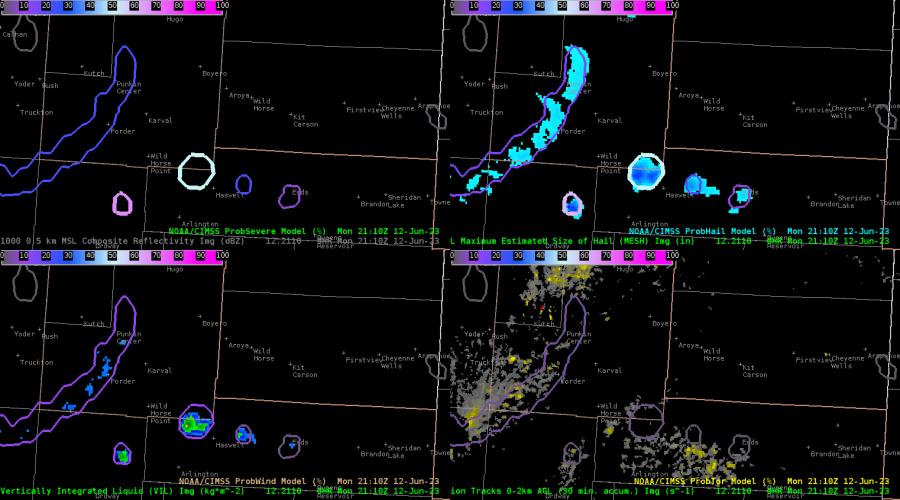
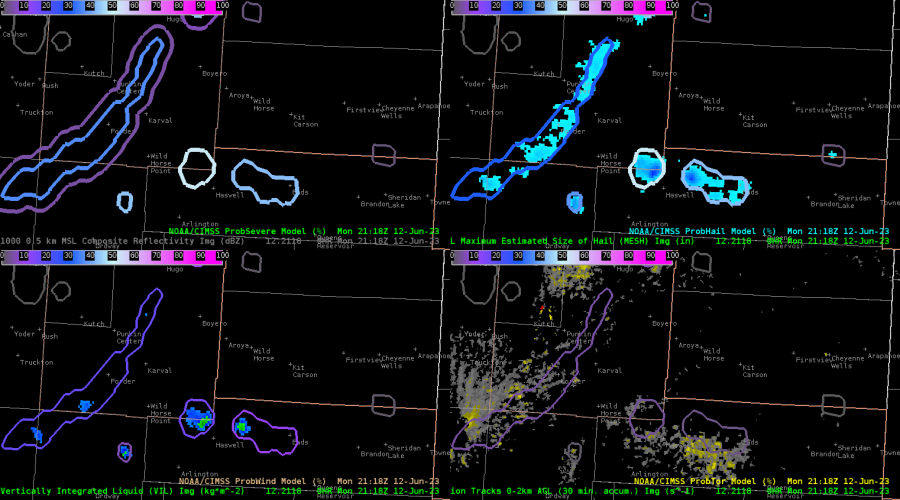

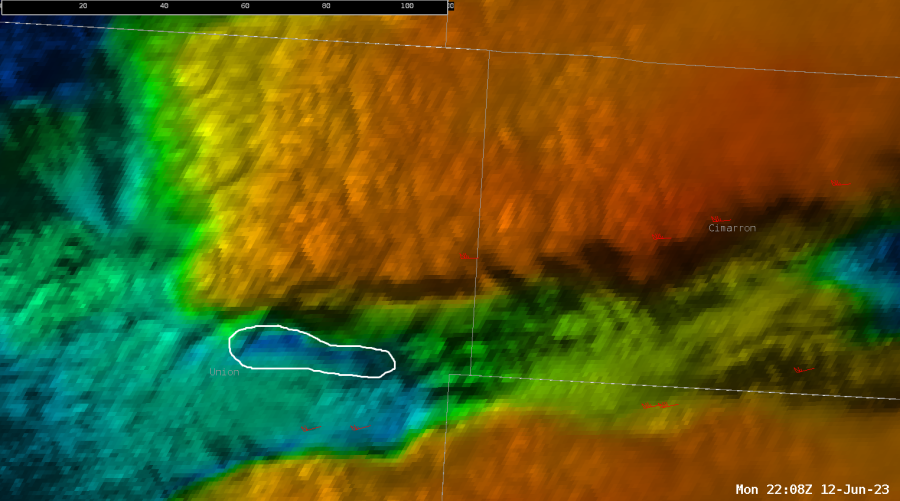
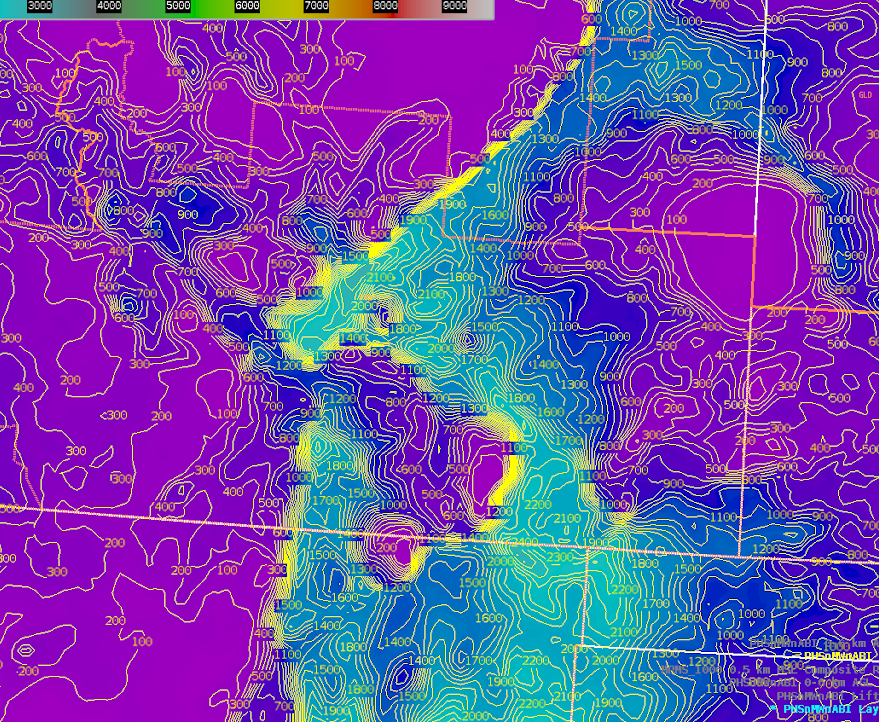
 Figure 1
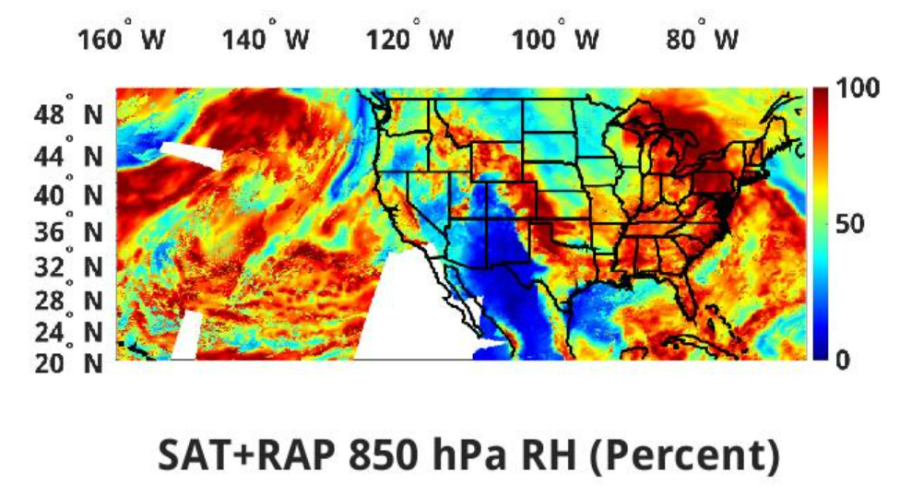 Figure 2
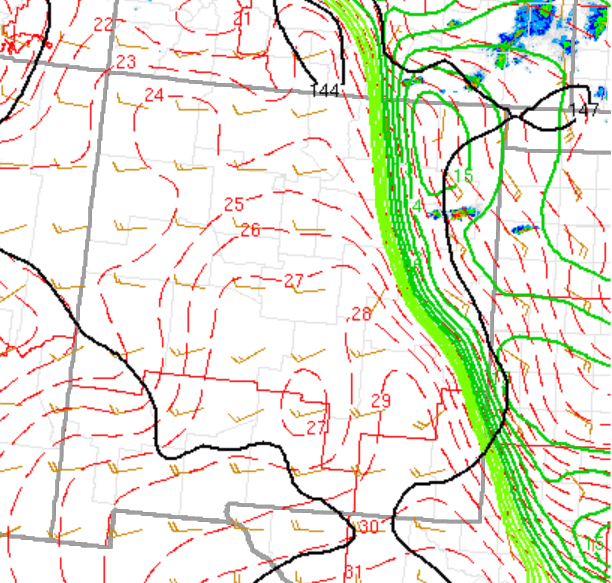