HWT Day 2: Protecting the Quartet

Protect the Quartet!

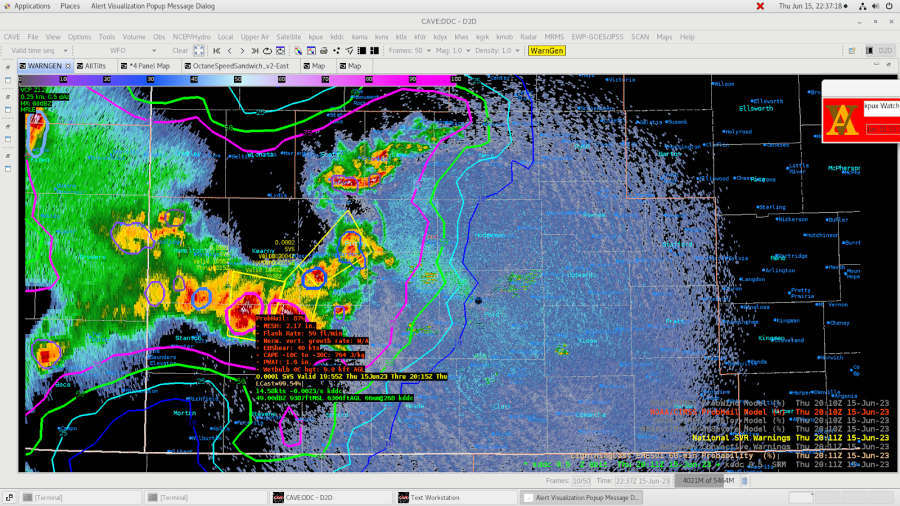
Today we were charged with the noble task of watching over the the Quartet Festival located in Lawrenceburg TN. Gaps in the cloud coverage allowed us to utilize some of the satellite products a little more efficiently today. Our first sign of trouble came as convection began to form out in front of the main line moving WNW out of Alabama. LightningCast 60-min prob gave us our first initial heads up that lightning was possible with storms forming out ahead of the main line. A combination of Octane overlaid with GLM data was the primary source in our decision making to issue a notification to the event organizers. Thanks to our quick decision making, everyone is alive to sing again another day.


We combined lightning cast and ENTLN data with the radar to provide ground truth on when lighting was first scene within the 15 mile range ring which allowed us to issue follow up messages regarding the likelihood of ongoing lightning potential. Requesting a LightningCast point too also gave us confidence in issuing notifications to the event organizers.


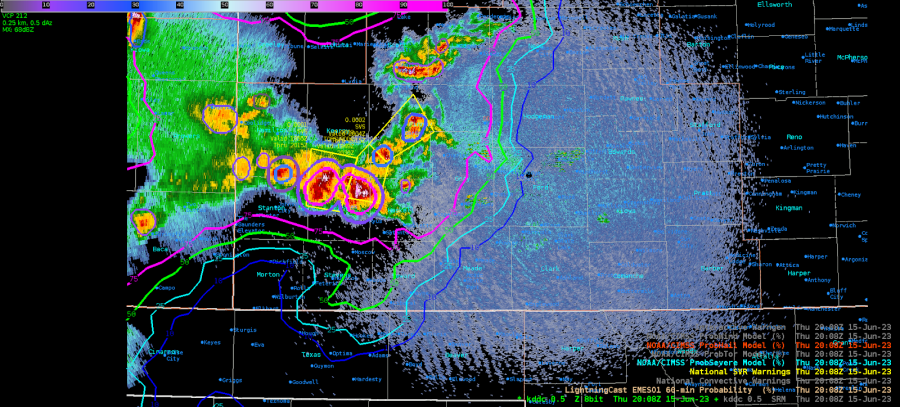
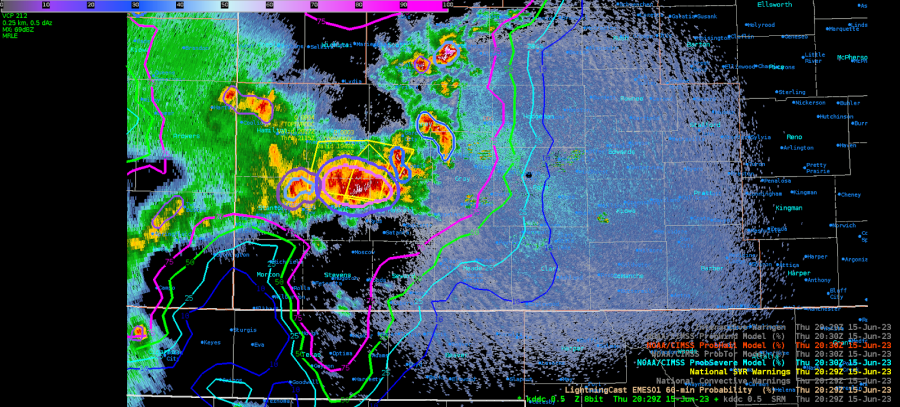
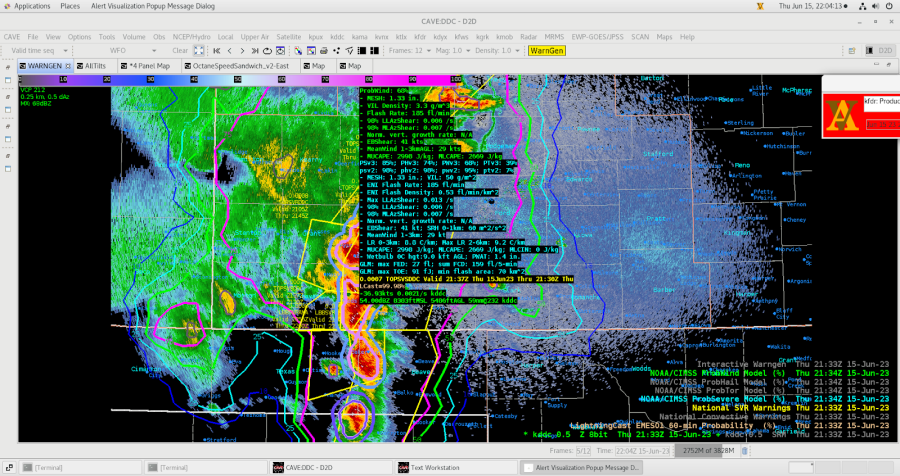
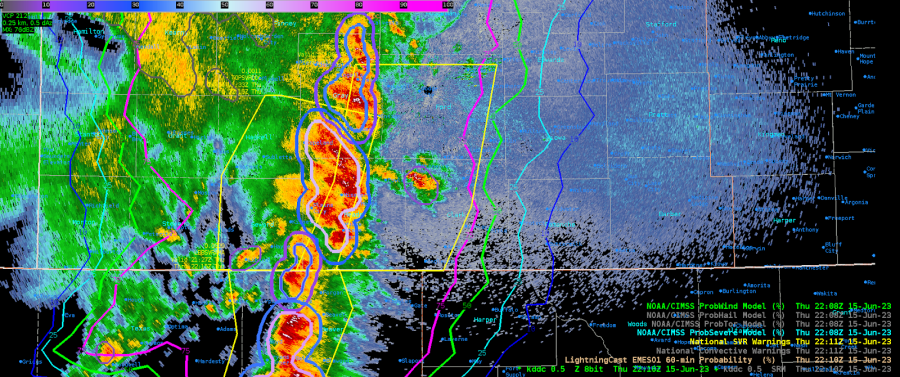
Discussing the LightningCast Probability data with Kilometers we were discussing ways to get more information out of it. We settled on loading the LightningCast as an image rather than contours. This combined with the sample tool and overlayed with Total Lightning products was more useful when forecasting for a specific DSS point. We also went ahead and limited the data being showed on the lower end of the GLM Flash Density. We didn’t want to exclude the Flash Density on the lowest end all together, but we wanted to highlight and compare the GLM Flash Density to the areas with the highest Octane SpeedSandwich. Our end result was this GIF below:


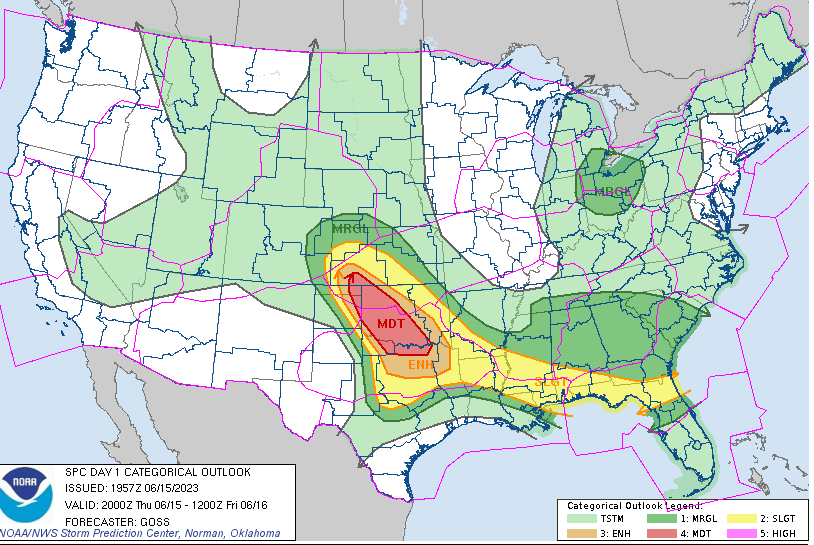
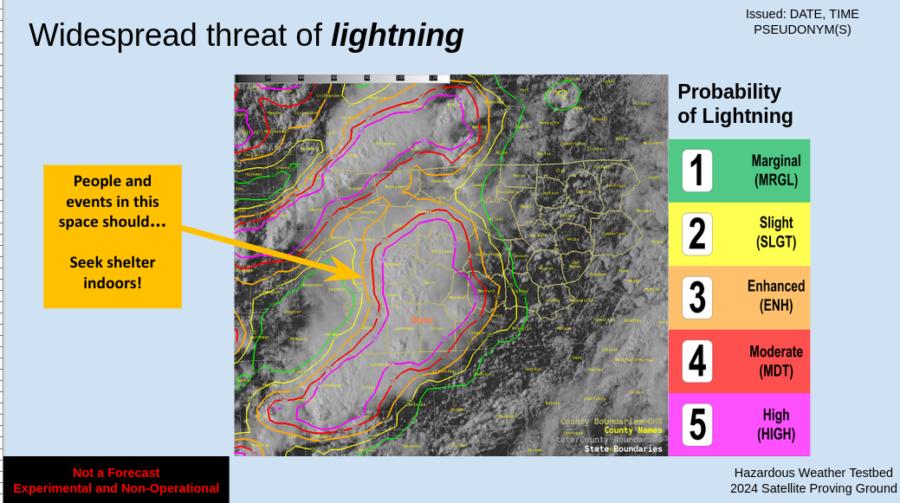
Today was a day to dive into GLM and Lightning probabilities. Once we settled on what we wanted to look at to make DSS related decisions, we realized that it wasn’t intuitive to the public. We needed a way to redesign the the Lightning Cast data to be easy to look at to the public. Because the NWS already has a color table for threats utilized by our National Centers, we decided to model our threat level based on the SPC’s convective outlook to create new colors for the contours. The following graphic is the end product of that:

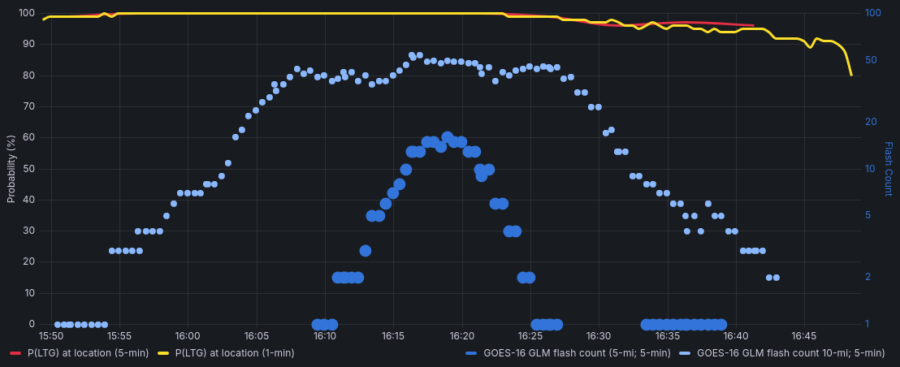
As the system moved past, identifying areas that we could issue the all clear on was our next priority. The LightningCast created a nice looking bell curve that lined up with the time that the MCS moved over the event and showed the trends of the storm began to wind down.


Tags: None

Getting in Shape

Two aspects for what constitutes operational relevance jump to mind when discussing radar imagery. The first is the shape and the second is the intensity. In the image below a line of storms is moving through central Tennessee. The GREMLIN emulated radar is doing a fine job at showing the location of the convection. Where it is still lacking some usefulness to warning operations is not having high enough DbZ returns. Even so, between the two aspects, I believe GREMLIN is resolving the more operationally useful aspect because we can use the prob-severe tool to infer strength and warn on the meso-scale analysis.


Image one: GREMLIN Emulated Radar on the left and the MRMS composite reflectivity on the right.

Image two: GREMLIN Emulated Radar on the left and the MRMS composite reflectivity on the right later in the event.


-Kilometers

Tags: None

Missing data

Charmander and Kilometers were watching over an event in central Tennessee and employed the lightning cast meteogram. The probability of lightning tool worked (img. 1) great for alerting the event staff to an increase in the lightning threat, providing about 45 minutes of lead time.

I began to monitor the cell for further intensification and any chance that it could become severe. In the background of this work I was also monitoring for lightning activity from the cell. Eventually, the cell did produce lightning. Image two showed the ENTLN product pick up on a series of cloud flashes, with the GLM product showing some light lightning activity two minutes later (img. 3).

Positive for GLM was that the latency was not an issue. What was more of an issue was that the meteogram from lightning cast never plotted the GLM data on the meteogram. If the person working the event shared the meteogram to event organizers, they would assume this was a missed event. Positive though, is that the organizers could be shown the GLM image or ground network data and be assured that their actions were not for nothing. This left us wondering why the meteogram did not show the lightning activity picked up in the vicinity?

We saw that the GLM began showing up when the main line of convection moved through the event space about an hour later than we identified it through alternate means (img. 4).


Image one: Meteogram for the Probability of Lightning product with GLM flash Density.


 Image two: GLM Data quality (upper-left), GLM Background Image (upper-right, Day cloud phase RBG overlaid with GLM Flas Density (Bottom-right), ENTLN observed lighting flashes and cloud-to-ground strikes (bottom-right).


Image three: GLM Data quality (upper-left), GLM Background Image (upper-right), Day cloud phase RBG overlaid with GLM Flas Density (Bottom-right), ENTLN observed lighting flashes and cloud-to-ground strikes (bottom-right).


Image four: Meteogram for the Probability of Lightning product with GLM flash Density beginning at 15:15 local time.


– Kilometers / Charmander

Tags: None

Convective Initiation Failure

Watching a New Updraft Among ongoing Convection

Multiple supercell thunderstorms were ongoing across South Texas along and behind a southward moving outflow boundary within a strongly unstable airmass. At 2115Z, a new updraft began to develop near Realitos, TX to the southwest of an ongoing thunderstorm.


Fig 1: Notice the cooling cloud tops in the CTC image (top right) near Realitos, TX at 2114Z. This updraft is evident in the Day Cloud Phase Distinction RGB and Visible imagery.

About 5 minutes later, the cloud top cooling peaks near Realitos. The first faint radar echo become evident to the southwest of the ongoing supercell.


Fig 2: Cloud top cooling peaks at 2119Z near Realitos. The first weak radar echo is evident to the southwest of the ongoing supercell.

At 2127Z, the cloud top cooling product indicates that cooling has significantly decreased. Meanwhile the cloud top divergence product suggests little to no meaningful divergence is occurring. This suggests that the updraft has weakened and will not likely continue to develop. The latest CRP 0.3 degree reflectivity shows an intensification of the precipitation in this area, but the satellite derived imagery suggests that this intensification on radar is temporary and the updraft will continue to weaken.


Fig 3: Cloud top cooling has decreased and no notable cloud top divergence is observed. There is still considerable “texture” in the visible and daytime RGB. Notice the increase in reflectivity to the south of the ongoing thunderstorms.


The information from the derived products suggest that this updraft will likely not develop into an additional thunderstorm near the outflow boundary. There were several minutes of lead time over radar/visible imagery gained from these derived products to indicate that the updraft would not develop fully into a new thunderstorm. An animation of the updraft sequence is shown below.


wthrman

Tags: None

Consitency with Lightning Cast

As a QLCS moved through Tennessee and the threat for severe dropped, we were thinking of a way to message the persistent lightning threat that would still be present. We leaned on the Lightning Cast tool to message this threat.


 Image one: SPC risk categories with colors.


Before we made the image though, the idea came up to re-do the contours such that they better aligned with the style guide the NWS, or SPC more specifically uses (img. 1). Image two shows how we added two contours and realigned the colors to add consistency with other operational areas of the NWS.

Image two: Lightning Cast with a new 5 and 90 percent contour added and colors of the contours aligned with the risk colors used elsewhere in the NWS. In the background is channel 2- Red Visible satellite.


We compared this with the base style from the lightning cast tool and we felt that our updated style better captured our eyes and made it simpler to interpret by us. We also felt that the public would have a better chance of understanding the product if the colors were more consistent.

Tags: None

Lake Charles Radar Confirmed Tornado

 An MCS resulted in a number of TDS and TVS signatures on radar near Lake Charles today.

This one was capture to the WNW of Sulphur LA as an MCS surged east in an atmosphere that had 5000J/KG of SBCAPE. In addition to a TDS a LSR was submitted to the Lake Charles office regarding significant damage to the Walmart in Sulphur downstream of where these stills were taken. Radar was primarily used to determine that a tornado was on the ground. Looking at some of the Octane data, it was noted that this tornado formed on the leading edge of a speed minimum on the EMESO-1 Octane Speed Display.

As the storm moved toward Lake Charles, the line segment began to bow out. Numerous reports of wind damage came in with an Semi being flipped on I-10 and a 60MPH wind gust reported by the Lake Charles ASOS. Velocity data showed a strong signal for damaging winds, and the Octane Speed Sat Display again gave us a significant gradient between speeds as the storm passed over Lake Charles. This data could be useful in verifying the potential for damaging winds, especially when storms are close to the radar.

The Octane Sandwich display seems to be an upgrade to the Day Cloud Phase Distinction although both displays could serve different purposes, with Day Cloud being useful in watching storms develop, while Octane is useful once storms become more organized in identifying more distinct elements of the storm.

-Charmander

Tags: None

Gremlins are dismantling the nebula!

Hi everyone!

First blog post for the Satellite Convective Applications Experiment – Week 1, let’s go!

The loop below shows an example of this from the Corpus Christi, Texas. Notice the convection moving out of the frame to the northeast is bounded by prob-lightning contours (Gif 1). My desire would be to have these better matched to the storms. Right now, the contours are too nebulous.

GIF one: MRMS reflectivity at -10 C overlaid with lightning cast 60-min probability.
Why do I care about it’s nebulousness? When I am providing decision support to an event, I want to know which cell is driving the highest probability, which is building and be able to anticipate the lightning threat based on the cells movement.
As my partner in the testbed pointed out, the anvil(s) (see image one below) were merging and this was likely causing the nebulousness.
   Image one: GOES East Day Cloud Phase RBG channel.
Our discussion began to expand to others in the testbed and an idea emerged to try and reduce the nebulousness. The idea was to use the GREMLIN Radar Emulation product to further train the lightning cast dataset so that the probabilities become anchored by the emulated MRMS product.
Below is a GIF of the GREMLIN and MRMS product. With the GREMLIN product using some of the same satellite features as the lightning cast; the two products have some base level of compatibility. And so my challenge to the developers of these products is, an these two be combined such that lightning cast is mapped to the convective feature causing the probability.
GIF Two: GREMLIN Emulated Radar on the left, and MRMS composite reflectivity on the right.

-Kilometers

Tags: None

Using PHS to analyze an area of surface based convective potential

The potential for surface based convection will be important for the severe weather coverage in the CYS CWA this afternoon/evening. The 19Z PHS model is forecasting a northwesterly push of instability which is depicted above in the left panel moving into the far southwest counties of the CWA. To the north of that instability axis the PHS is depicting still elevated convection that is going on this afternoon. Additionally it is depicting surface based convection in northern Colorado, which may impact the moisture feed further north into the CYS CWA. I would highlight the far southeastern portion of the CYS CWA for a severe thunderstorm potential in my DSS/public messaging, with more uncertainty further north.

-Joaq
Tags: None

ProbSevere and LightningCast During Severe Warning Operations

A moderate risk for severe storms was forecast for the Southern Plains with hail, wind, and tornadoes as significant threats.  Storms quickly initiated in southwest Kansas (See Figure 2) and were ongoing when the testbed started at around 19z. Primarily used during warning operations were ProbSevere, LightningCast, and radar. Thrown in for good measure I used OCTANE to aid in storm motion and direction.  ProbSevere was helpful in issuing warnings but was vital in assisting in the hail size mentioned in the warning text.

Figure 1: SPC Day 1 Outlook for June 15, 2023.

Figure 2: 2011z showing ProbHail with a MESH of 2.17” provided the confidence to mention 2-inch hail in the text.  There were two separate storms that eventually merged later in the afternoon.

Figure 3: storms were beginning to merge and ProvSevere was as well and thus prompted just one warning instead of two.

Figure 4: New warning with ProbSevere now depicting just one storm.

Figure 5: Storms continued to merge and evolved into a wind signature more than a hail producer.  Thus the ProbWind had a nice uptick to 68% at 2133z.  Before this time it never rose bout 40%.

Figure 6: Once the convection evolved into a linear wind producer, LightningCast became helpful in how far east to extend the polygon.  I used the 75% contour and issued a 60-minute warning.

Figure 7: Captured much of the event to show the evolution of convection and ProbSevere.

Figure 8: OCTANE aided in determining the area of cell merger in southern Grant and portions of Stevens Counties. 

– Podium       

Tags: None

6/15/23 HWT – AMA

What appears to be a nice distinction between sheared / lesser sheared convection across the Octane window. Stronger shear across SW OK producing much different appearance versus SW KS convection.  Nice quick visual distinction for operational use. The idea of a quantifiable divergence contour and/or grid would be welcome also.

Octane data from Goes west meso sector was zoomed in along the inflow region across the SW OK supercell (not our CWA but I had to look). The upper right panel is the directional component and the color scale was changed to highlight approximately 210 – 150 degree range. The increasingly warm colors represent a backing of flow at approximately 4.5 kFt. This level of storm integration (if appropriate) would be advantageous to warning operations.

ProbSevere time series plots do not sample. I would like sampling tied to the cursor as in the parent CAVE window. The element assignment within ProbSevere did cause a problem with the time series information with a storm that strengthened on the southern end of a developing line. The storm initially had a defined area for the region of interest but once ProbSevere assigned it to the larger line the probabilities became much less representative. This impacted ProbTor values which were being monitored ahead of an eventual tornado warning in the Tx Panhandle. I was the warning forecaster today and used ProbSevere extensively for my decisions. It is not the deciding factor but it certainly weighs into the decision process.

PHS model output was interesting and the Updraft Wind element was noted as something not usually seen with model output. It was viewed initially but I didn’t monitor the model output once storms developed and warnings were being issued.

NUCAPS forecasts were unavailable until the very end of the operational window. I did view the 19z overpass soundings and found the familiar  trends of errors at the boundary layer when compared to nearby surface observations. This limitation continues to impact my confidence in the product.

– jbm

Tags: None