Two areas seem to be possible for convection near and west of the Great Lakes. The first is across northern Iowa as an outflow boundary and sfc trough are providing strong sfc convergence in an area of higher sfc dew points in the 50s. Limited instability and shear in this area would limit organization of storms. Main threat here would be dry/wet microbursts as hail/rain cores descend into deep dry layer below cloud base. Stronger shear is present in the second area of concern, ahead of northern stream shortwave trough in northeast Minnesota and Upper Peninsula of Michigan. CTC rates of -15C/15 min noted along a sfc front/convergence zone just north of the Canadian border at 1945 UTC and this area extends south into northern Minnesota.
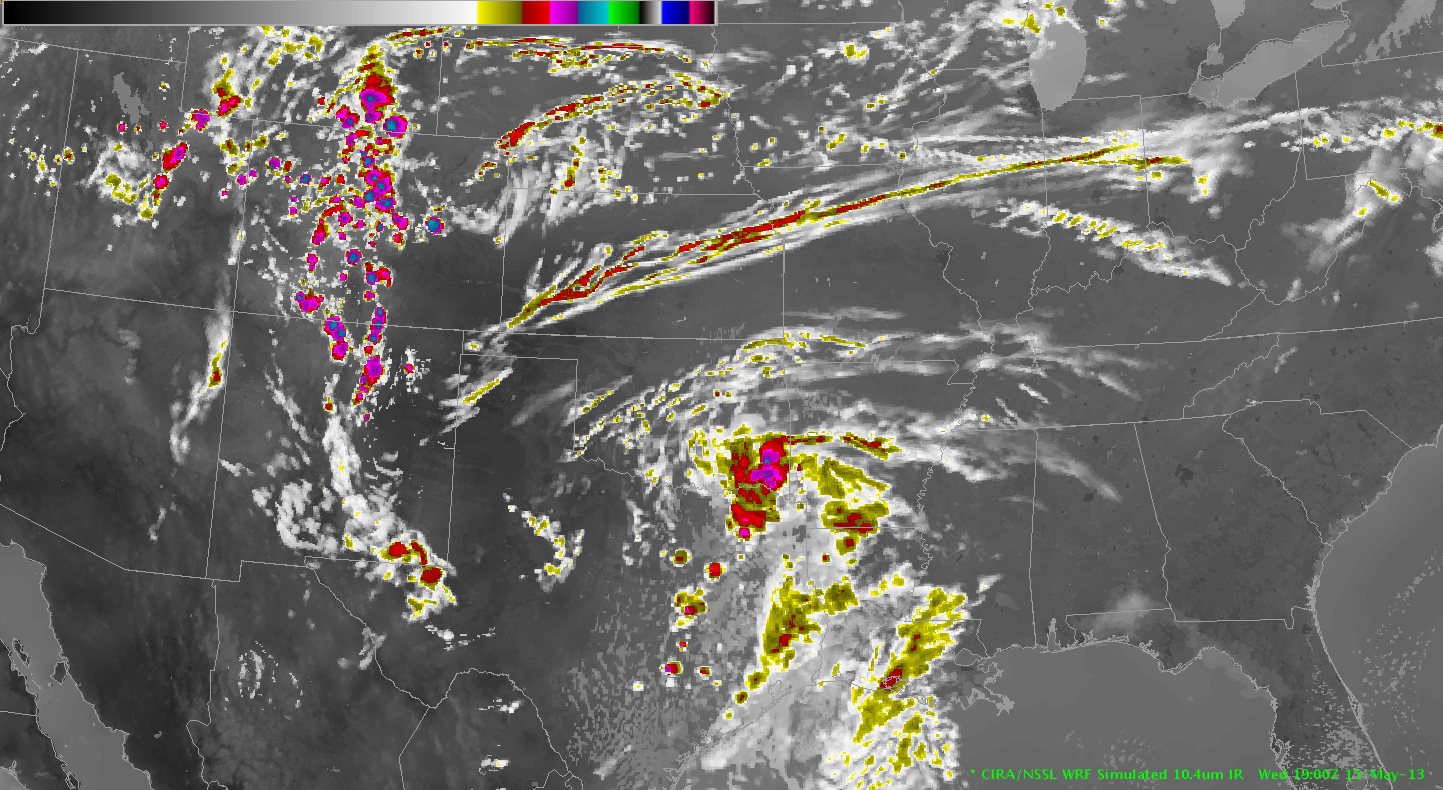
The CIRA Simulated IR satellite shows storms initiating in both of these areas by 01 UTC. (see image). This was the general area stroms did form although the simulation was about an hour or two slower than reality (see IR satellite image from 2345 UTC).


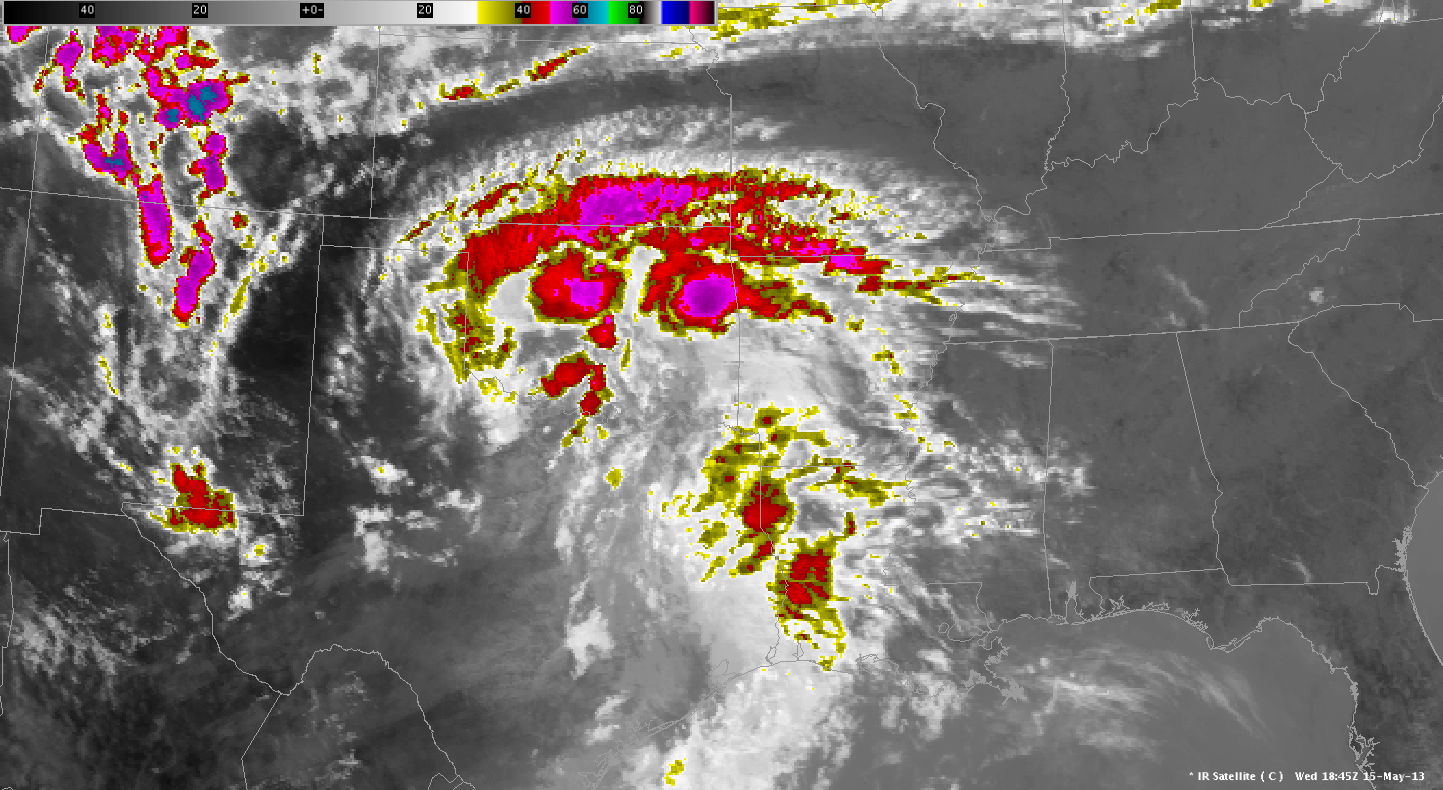
Top image is the CIRA/NSSL WRF simulation 10.4um IR for 01Z Wed MAY 14th, showing some convective initiation across the Upper Peninsula of Michigan and some bigger storms across northern Iowa and eastern Nebraska. Bottom image is the actual 2345 UTC IR satellite image.
As of 20 UTC, the GOES-R CI Sfc convective initiation shows the highest percentages (around 77%) in southern MN and western WI. By 21 UTC the highest percentages (up to 90%) were across Nebraska. CTC cooling rates were 5-15C/15minutes in these stronger updrafts, which were small and isolated, stretching from CO to WI. The line of higher convective initiation decreased as the storms initiated, then were followed by individual storm cloud-cooling tops identified by the CTC. See following images.

GOES-R Sfc convective initiation at 2015 UTC.

10km Radar Coded Message at 2119 UTC showing the line of showers and thunderstorms.

CIMSS Cloud top cooling – Instantaneous image at 2130 UTC. Max values around -15C/15 minutes, that spiked up to -40C/15 min by 22Z UTC from NE Iowa to SE Minnesota. Severe microburst winds hit Mason City, Iowa around 2150 UTC. The storm showed a CTC cooling rate of -25C/15 min at 2132 UTC. The algorithm gave a value of -70C/15 min for one storm, which was probably a misinterpretation caused by anvil blowoff from a previous updraft.
– Ostuno


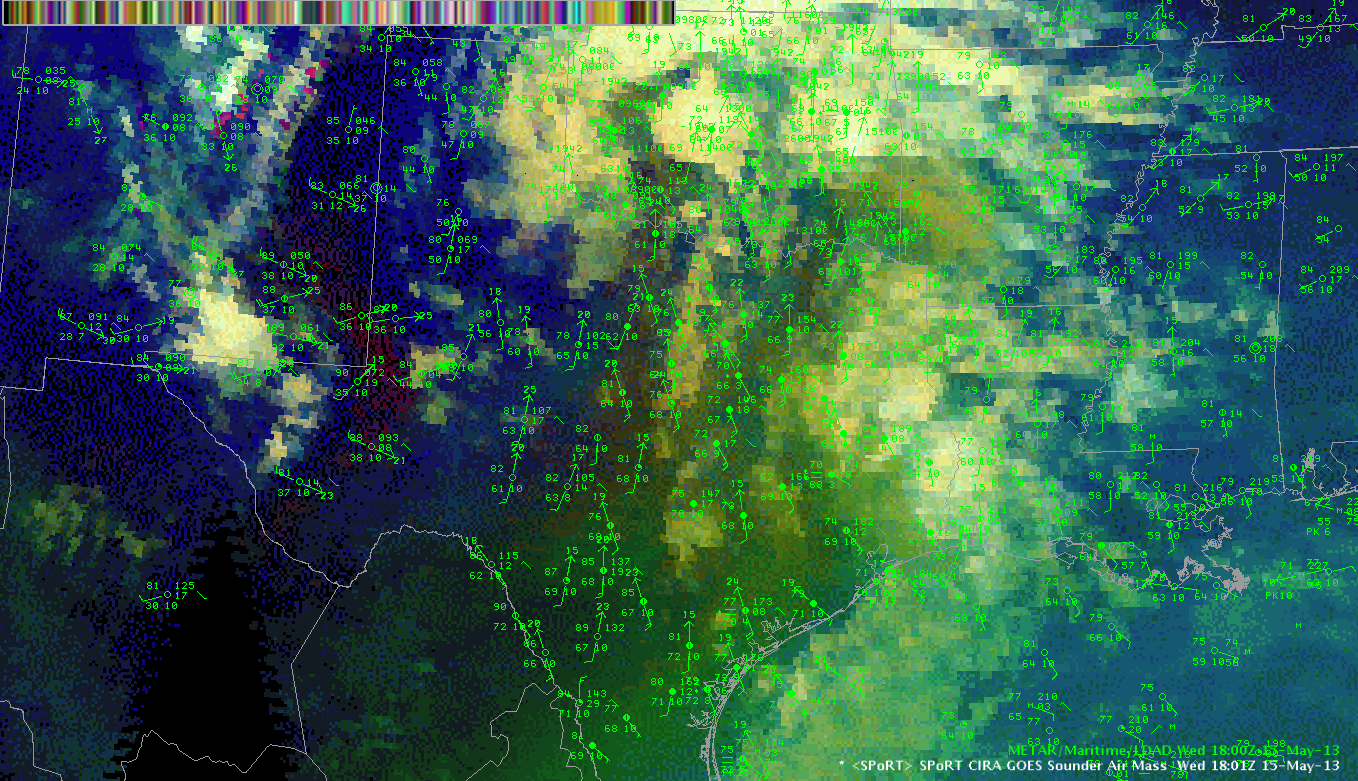
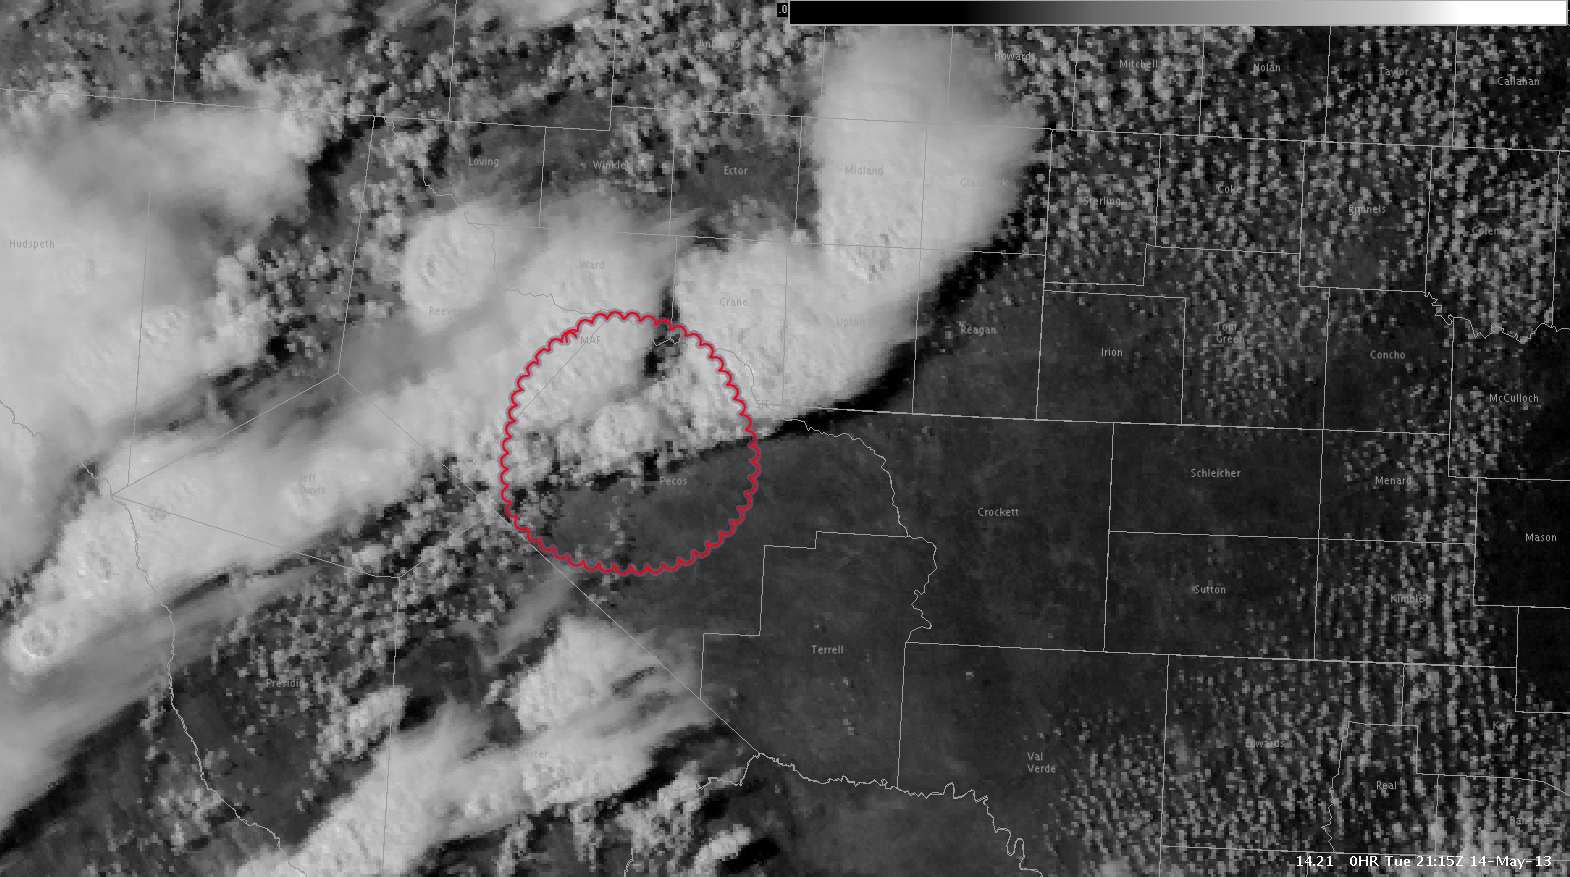
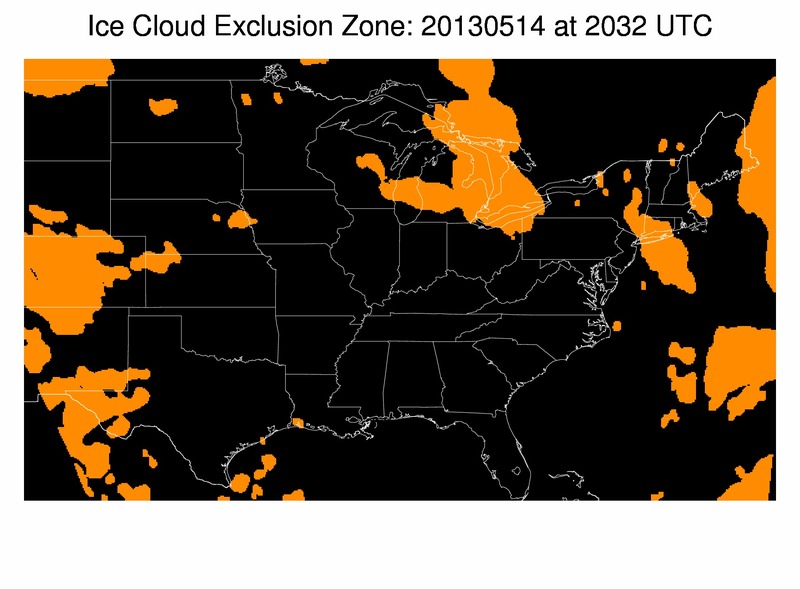
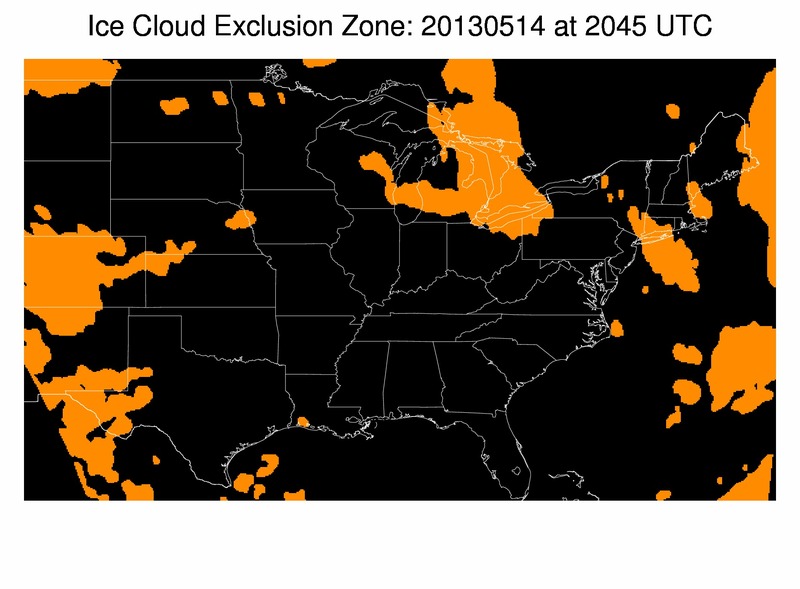
 The images at 19 and 20 UTC respectively depicted an area of drier air, most likely associated with a short wave on the back side of a mid/upper low over southwest Oklahoma. This wave seems to be enhancing cloud top cooling and convection generation over west Texas, near Lubbock. We will keep a close eye on this feature to see if this wave will allow for explosive convection 22-01UTC near a dryline from near Childress to San Angelo with very unstable (2000-3000 J/kg) air near and east of the dryline. Michael Scotten