Forecaster Thoughts – Bill Rasch (2008 Week 2)

Coming into this experiment, I truly did not know what to expect. I did my homework best I could but was still concerned I didn’t learn all the acronyms correctly and would in the long run not be able to add much to the experiment. By the end of the first day, however, any worries I had were put to rest by the great crew at the EWP as they made me feel comfortable and sure I was prepared for the battle of the coming week.

Where to start…let me start with the CASA. Being from a Western Region office that has noticeable radar data gaps, these were the folks I drifted to immediately as I wanted to learn more about their system. After simulations and a presentation of the CASA data I was blown away quickly. I felt as if I was watching some type of different radar data world when viewing the data. To me it made the returns appear as it they were living things. The high resolution and rapid refreshing of the data made it appear as if you were watching weather in High Definition. All I could think of was to fill our radar gaps with this type of data. There is no doubt in my mind that additional lives and property would be saved if this system was added to the NWS’s operational forecasters suite of tools. I was very impressed what the CASA team had developed with their adaptive scanning strategies as well. I could see no flaw in this technique during the time I was involved with the CASA.

From an operational aspect the most challenging thing that I could think of regarding the CASA was how this data would be presented to the NWS forecasters. In my opinion, the less software sources a forecast has the more efficient they will be in the long run. Since the CASA data is data from the lowest levels of the atmosphere, would this data be “appended” to 88D data? Or would it actually be a different source they would view during an event. I guess I would have to see how this is done, but to me if it can some how be morphed together with the 88D it would be better. But, of course, I sure would like to just have this problem. We’ll see what time will brings!

On to the PAR. I found it incredible what the PAR folks had accomplished taking a military radar and converting it into something that closely resembled 88D data (better of course). Like the CASA, I was very impressed but at the same time, disappointed, knowing that this technology was out there and NWS forecasters could not use right now. With the rapid refreshing of the data again, viewing of the data had a HD type of effect.

I was lucky enough to be in front of the PAR during a cold pool weak tornado event in the Norman area. Probably most notable during this event and viewing archived data was what I would call “brain overload”. This was a common feeling with the other forecasters at the experiment when I was there. The rapid scanning of data was so much more data than we were compared from the 88D, one tended to tire quicker. I think operational forecasters may get used to this, but maybe not, and it may add to more fatigue when compared to current data set viewing in the 88D. A possible simple solution is for software to dynamically adjust to each users preference for this effect. Of course, the more data we have the better, but viewing in real time of this data will probably differ from forecaster to forecaster. Or, as they become more familiar with the data they could probably become more adapted to it.

On to probabilistic warnings. Now this was something I had to prepare for but really had no idea what to expect. After getting used to the warning software, I was very surprised that this technique of warning was not as challenging for me as I thought it would be. As a matter of fact, it was really fun and I enjoyed the challenge. I don’t know why, maybe it was the fact that it was a different type of challenge for me. I do suspect that the skills to produce these types of warnings will vary from forecaster to forecaster, but that will always be present for operational forecasters. There area still a numerous unanswered questions regarding this technique, but I think the EWP group is on the right track of solving them and the questions that have not popped up yet.

As far as the unanswered questions, there are numerous, but just a few I can remember. Exactly how does verification occur. At what threat value do probabilistic warnings begin being issued. It would likely be useful for users to know when storms have “no threat” at all. Does this mean we need to provide probabilistic forecasts for nearly all thunderstorms? How much automation can be provided to the process with the help of climatology, near storm conditions, algorithm output…etc.

In summary, my experience at the EWP was totally fulfilling. It was a privilege for me to partake in the experiment and interact with the friendly, intelligent and very professional folks at the NWC. In my opinion, getting NWS operational forecasters involved in this process (not just MIC’s/WCM’s and SOO’s) is a great way to go. I really felt that my input was appreciated and would be taken seriously to possibly improve everything that we were involved with. I have high confidence these experiments will result in something beneficial to the NWS and their users. Thanks to everyone that I met. I only wish I could come back again, but at the same time, realize how important it would be for others to be involved in this process.

Bill Rasch (NWS Billings MT – Week 2 Participant)

Tags: None

Week 1 Summary: 28 April – 2 May 2008

Participants:

David Blanchard (NWS WFO Flagstaff, AZ)

Mike Cammarata (NWS WFO Columbia, SC)

Andy Edman (NWS Western Region HQ)

Ken Cook (NWS WFO Wichita, KS)

Summary:

The first regular week of EWP concluded today with our end of week de-briefing. It was mostly a quiet week across the CONUS for severe weather. We had two days (Tue and Wed) with no severe weather IOPs during our 1-9pm shift, so we used that time having the forecasters run through a number of archive case playbacks for all three experiments.

On Monday, we unfortunately were met with the prospects of an early significant severe weather event over eastern VA and NC before our forecasters could become trained on the various HWT systems, thus we missed out on working an IOP for that event. We also learned that our Monday orientation schedule needed some tweaking and “compression” so that we could have the forecasters sufficiently trained on WDSSII and introduced to which ever experiment would be running during the day’s IOP before the IOP began. This means a Monday DY1 map discussion, a shorter orientation seminar (there was a lot of repeat information with the various experiment introduction seminars), and a group WDSSII training session in the HWT with all visitors on a workstation simultaneously, all to be concluded by 315 (the start of the EFP Monday briefing). Then, at 315, there would be three scenarios:

1. Gridded Warning IOP to begin between 5-6 pm.

2. Central OK IOP to begin between 5-6 pm (PAR/CASA).

3. Early IOP to begin at 315pm.

In the event of either scenario 1 or 2, we would introduce the experiment du jour and provide some training before the IOP. The introduction seminars are outside the HWT ops area, not to interfere with the EFP 315pm briefing. Training would return to the HWT at 4pm and continue to the IOP. For scenario 2, we would split up the intro/training into two groups of participants, and those same two groups would work the IOP event respectively. For scenario 1, all visitors would participate in the gridded warning introduction, training, and IOP. For scenario 3 – baptism by fire!

Thursday was our only real-time IOP day. The storms formed in Central OK, but quickly moved out of the CASA network, so we put both of our visiting forecasters on the PAR station. Mike Magsig, our guest forecaster decided to work gridded warnings solo. We concluded that there may be situations like this in the future, and that we could consider a PAR/gridded warning scenario. However, if a central OK event was forecasted on Monday, we wouldn’t be able to train all the visitors on all three systems, so a gridded warning IOP might have to be run mainly by the gridded warning scientists with the forecasters observing.

End-of-week notes concerning the PAR experiment:

There was some difficulty in using the display to view the PAR data. Navigation of virtual volumes was not supported; the interlaced 0.5° tilt breaks into two virtual volumes. The display couldn’t keep up with the rapid refresh rate of the data. (Note that both of these issues have been solved by Week 3). There was a recommendation to add a display setting that would update the entire volume scan at once, since 30- and 60- second refresh rates are probably as fast a rate that the forecaster can consume in real-time.

There were some PAR data quality issues that also affected real-time operations. The reflectivity data above 1.8° was very noisy and there was bin smearing at higher tilts. Velocity data was also pretty noisy, although the same issues were also apparent on KTLX.

The display couldn’t animate the data fast enough or with a sufficient animation period for the forecasters to extract “88D-comparable” trends in the data. The PAR data refresh rate was too fast, and the display could never loop as nicely as the animated gifs presented during the training sessions.

There was also discussion that the rapid update of data presents a lot of information overload, and that there needs to be some serious discussion on how to manage all that information. But this is just speaking from the PAR data alone. There was a lot more information coming into the HWT via the Situational Awareness Display (live television broadcasts), amateur radio, and other data sources (KTLX, TDWR, CASA radars). This extra information started to become very distracting to the forecasters.

We then debated the use of the use of the SAD during PAR and CASA live ops. CASA’s objective was to see how the CASA radar data could compliment other data sources, whereas PAR scientists want to isolate the use of PAR data for warning decision making. This presents an issue in the HWT, since we operate both experiments simultaneously and the SAD was designed to provide additional information to all experiments. Some suggestions were to lower the volume of the television audio, or having the weekly coordinator listen to it on a Bluetooth headset. There was also a suggestion to treat the PAR archive cases “in isolation” (no other data sources), and PAR live cases as complimentary to the entire suite of data sources. Finally, we noted a lot of interest in the PAR and SAD displays to the point where too many folks were crowding that area. Suggest that the coordinator keep that area mostly clear of people, keep the crowds and noise level to a minimum.

End-of-week notes concerning the CASA experiment:

We had no live CASA operations during the first week. However, the CASA scientists collected live data on overnight squall line without the availability of the forecasters. The forecasters only evaluated archive data during the first week.

Data from the overnight case were shown. It was hard to see gust front and boundaries in the Reflectivity, but they showed up better in dual-pol data (ZDR).

Some feedback from the archive case playback included: The RHIs may not add much value over dynamic Vertical cross sections and CAPPIs. The forecasters mostly concentrated on the one minute heartbeat 2.0° elevation scans, which are always a full 360° scan, since the sector scans didn’t always get a full volume on the storms. Also, the complete storm volume is not observed with CASA data, so it must be complimented with nearby 88D data.

End-of-week notes concerning the Gridded Probabilistic Threat Area experiment:

Due to the bad weather timing, there was not a good opportunity to have the visiting forecasters run a gridded warning live IOP. Their experience was gained primary through training, and the archive case playback. Nonetheless, they did provide some useful feedback, some of which was included in earlier blog entries.

One of the biggest issues had to do with the learning curve on the WDSSII display, and knobology difference compared to AWIPS/D2D. It really helped to have a knowledgeable NSSL scientist sitting with the warning forecasters to help with the WDSSII. Most commented that these technology issues could go away if the software was fully integrated into D2D.

One suggestion was to xhost a D2D to the PW workstations, so that the forecasters could use it for their radar analysis if they didn’t feel comfortable with WDSSII. In this setup, WDSSII would only be used to issue and monitor the warnings.

Other software suggestions: Add the FSI hotkeys to wg; CurrentThreatAreas should be a contour which is easier to see over the radar data; add the warning vector with tick marks as an overlay like in WarnGen.

In terms of operations, there was some discussion about sectorizing operations. It could be done by different storm areas, or by different threat types. Both of these concepts of operations will be tested in week 2.

There were concerns about starting an IOP without much of a “situational awareness warm-up”. The pre-IOP activities are usually about archive case playback and training, and we aren’t really watching the weather situation too closely.

I’ll include some notes on our discussions about adding probabilities from the live blogs: How do we calibrate the probabilities? Perhaps we can integrate the verification into the NGWT from the get-go – lesson learned from WRH experience with GFE (see their white paper). Other items for thought – how would the GRPA metrics be modified for probabilistic warnings? How will we handle calls to action and other meta-data in the warnings? When should the general public be told “to duck”? Finally, how we can objectively calibrate forecasters to the verification and to each other, so that there is a consistent answer for each warning?

General feedback:

The forecasters felt that interviews would be better than written surveys used for PAR and CASA. There was some concern that the post-event written surveys are limited in that the interviewer can’t ask follow-up questions. The participants are too tired after the IOP and don’t always feel alert enough for writing after the event. Also, some forecasters might not be as good with written communications. It was noted that CASA voice records the conversations. The gridded warning experiment uses the live blog to record discussion notes. Other suggestions included stopping archive case playback at certain times for interview questions. This is similar in concept to WDTB DLOC classes. Therefore, it was also suggested that the cognizant scientists experience how WDTB does their DLOC trainings sessions to get a taste of how they capture feedback.

Also, the archive case playback/training sessions will take at least 2 hours, and more on the first day when the introduction seminar is also given.

A few additional suggestions were provided to improve the spring experiment for future participants. They included providing some menus for local restaurants when we do “food runs”, adding a “snack honor bar” or ask the SPC and WFO if we can share theirs.

Greg Stumpf (EWP Weekly Coordinator, 28 April – 2 May)

Tags: None

Forecaster Thoughts – Mike Cammarata (2008 Week 1)

Here is a summary of my experience in the 2008 EWP Spring Experiment:

  • I was most impressed with CASA data
    • High resolution of storm scale features and rapid refresh of data
    • Adaptive scan strategy
    • Overcomes horizon problem
    • Overlapping radar coverage
    • Attenuation was a problem
    • Noisy data was also a problem but it appears that efforts to mitigate this were working
    • Wish we could have used the CASA network in real time
  • Was not as impressed with the PAR data (did not see much difference in comparison to the 88D)….but must remember that an operational PAR will have better spatial resolution.
    • Got to use the PAR in real time for a supercell outbreak
    • Rapid rate of incoming data was both an advantage and a challenge…was difficult to keep up with the incoming data
    • FSI was useful with the PAR during this event but slowed the system down

  • Rapid rate of incoming data will be a significant challenge for forecastsers
    • Will have to learn/be trained on how to selectively interrogate data
    • Will require more help from algorithms
    • Forecasters will fatigue more quickly

  • Poor system performance and lack of familiarity with WDSSII was an obstacle for me to focus on evaluation of the data
    • Would be better if data could be viewed on AWIPS (perhaps AWIPS II)
    • Familiar procedures and color curves would help even more
    • The system had trouble keeping up with the incoming data (performance slowed considerably)

  • I feel that interviews rather than surveys would be the best for getting feedback. Would lead to better (quality), more (quantity), and more targeted (specific/focused) communication.

  • During the real time event there was a lot of commentary from individuals in the area of the workstation (PAR) and SA display. I found this to be somewhat distracting.

  • Everyone that I interacted with during the evaluation was extremely helpful. I am thankful for and appreciate everyone’s hard work and helpfulness.

  • Not sure what to say about gridded probabilistic warnings. I think this is a direction we need to go but the approach during this evaluation was very subjective. Ultimately this has to be much more objective to get consistency between forecasters and events. Both users and forecasters will need to have a better understanding of what theses warnings mean. That said, I thought the software was a good tool for drawing the warnings.

I am thankful for the opportunity to participate.

Mike Cammarata (NWS Columbia SC – Week 1 Participant)

Tags: None

Forecaster Thoughts – David Blanchard (2008 Week 1)

Monday: 04/28/08

Started the day with a weather briefing and overview of the warning program. This was followed by a tour of the National Weather Center, which houses both OU and NOAA components.

A severe weather event was already in progress in the eastern portion of Virginia and North Carolina. Instead of getting formal training on the probabilistic warning software, we jumped right in to take advantage of the situation—especially since it was obvious that the severe weather was moving offshore and out of our data domain. Afterwards, we reverted back to the more formal training of the WDSSII software.

The software is pretty amazing in that we can view data from any radar in real time using standard tilt sequences, CAPPIs, and cross sections. It is similar to GR2AE but can combine multiple radars.

Tuesday: 04/29/08

After the briefing (no convective/severe weather expected today), we broke into groups. I worked on a CASA case. Volume scan data was updating at less than 1-minute intervals. Also, the data resolution was higher than WSR-88D data and the nearness of the storm to the radars allowed an exceptionally detailed view of the evolution of the supercell, hook echo, TVS, and TC. We were able to see the “debris ball” and weak echo center of the tornado circulation. The “knobology” of the WDSSII system, however, was frustrating and we spent too much time trying to understand how to view the data instead of analyzing the data.

We viewed and analyzed a second case using PAR data. This data was similar in azimuthal and radial resolution to the WSR-88D data but its temporal resolution was much higher with volume updates every 45 s or so. This was a low-topped, low-CAPE tropical environment and most of the relevant data was contained in the lowest two to three tilts so it wasn’t necessary to step through an entire sequence.

Both the CASA and PAR cases released a torrent of information at us and it become evident that more automation would be required to free the warning meteorologist from the mundane tasks so that he can focus on the meteorology and science of the evolving situation.

The next case was a ProbWarn situation for a severe thunderstorm that was capable of producing both large hail and tornadoes. The goal was to assign threat areas and probabilities and update as required. This case used WSR-88D data so the data flow was more typical of an operational warning environment. The “knobology” of the software again got in the way of the science.

All forecasters agreed that this would be an easier task if the radar data were integrated into AWIPS/D2D so that we could use a more familiar environment. Maybe next year.

Wednesday: 04/30/08

Once again no significant convective weather is expected across the CONUS today with the possible exception of late evening initiation in western Nebraska. We break into groups for additional training on both CASA and PAR cases.

The PAR case is done with Les Lemon as the facilitator. It is a near-tropical environment with weak shear and only modest CAPE. Most likely threat is hail. Data volumes update frequently and this makes it easy to see the development of high reflectivity cores aloft. The cross section tool is also useful once I get the hang of how it works. It becomes fairly easy to monitor the upper levels of the storm and to issue “warnings” for large hail. Using WSR-88D data would result in 4.5–6 minute update times for volumes and it would be easy to miss important details in the evolution of these storms. I did, however, miss the strong surface winds and possible microburst because I was focused on viewing the higher tilt sequences for hail signatures.

The CASA case was a southward moving squall line with very strong winds located some distance behind the initial gust front. We were able to resolve the evolution of various “swirlies” on the leading edge of the convection, some of which developed moderate rotational velocities. None, however, had significant updrafts overhead (i.e., the updrafts tilted upshear which is not atypical for a mature squall line) and would not be considered tornadoes. We agreed that a high wind warning was appropriate.

Behind the squall, a Rear Inflow Jet (RIJ) was developing. The nearness of the radars to the convection allowed a detailed examination using RHI cuts through the system and we were able to see a classic RIJ structure behind the convection underneath the mesoscale anvil shield. This RIJ was nearly quasi-horizontal as it flowed under the anvil shield but tilted down sharply at the back edge of the convective line impacting the surface underneath the convective line. The RIJ was likely a significant source of the strong surface winds associated with the squall line.

In summary, the rapid update of both the PAR and CASA allowed us to monitor the evolution in a way that WSR-88D cannot. In addition, the four CASA network allowed at least one radar—and often two or three—to have a close look at the system so that we were able to resolve small-scale features.

Late in the evening convection developed in extreme eastern Wyoming and western Nebraska but it was too late in the evening to use it as a ProbWarn case.

Thursday: 05/01/08

The convective outlook for today was favorable and plans were set up for an IOP in the evening. Additional cases were viewed this afternoon and we reviewed a CASA case from a few weeks ago. This year’s data is much less noisy than data collected last year. The case we examined developed a convective line with “book-end vortices” that were well resolved in both reflectivity and velocity.

We went into IOP mode around 5 p.m. with both CASA and PAR. The southernmost storm was just barely in the northeast lobe of the CASA array and it became obvious that we would not be able to follow the evolution of the system with these radars. We switched to PAR which was ideally suited to view the storms.

Because the storms formed on the dry line they were oriented NE–SW. Initially this meant the northern storms were to our north and the southern storm was located to our west. It was close enough to the radar that it was partially in the “cone of silence” which is much larger for PAR than for WSR-88D. As the storm moved to the northeast, we had to update the viewing sector so that we could continue to monitor the storm. This sectoring problem will go away once the PAR has all four faces running; for now, only one face is available limiting the viewing angle to 90 degrees.

Later, all storms were located to our northeast and were essentially along the same radials from the radar resulting in velocity range folding (i.e., the “purple haze”). We also had some velocity dealiasing problems with some of the higher velocities in the mesocyclone. Consequently, it became difficult at times to get clean velocities from the storms. KTLX did a much better job on some of the storms. We also viewed KVNX for the northern storms since it had a better viewing angle.

In addition, the data refresh rate overwhelmed the WDSSII software and we struggled to view the data. In hindsight, this was almost certainly a result of having two WGs (WDSSII-GUI) running on the same workstation, which quickly consumed the available memory and cache.

Mike and I worked with Pam and Les on the PAR. Because this was a live case nobody yet knew the outcome. It was useful to have Les looking at the data and make suggestions on where to focus our attention and to point out features in the data that might be important.

Summary: an excellent case within the PAR domain but software issues prevented us from fully utilizing the data. If PAR and CASA data were integrated into AWIPS/D2D this would not be an issue since we would be using familiar software. WDSSII is research software and is not always adequate or appropriate for real time viewing of massive amounts of data.

Friday: 05/02/08

Last day of Week 1 and we spend much of it in a round-table discussion of what worked, what didn’t work, possible ways to mitigate the problems, and general suggestions. We also reviewed some of the data from last night’s supercells plus the cold frontal squall line that marched across the state overnight. The squall line move through both the CASA network and within range of the PAR (but because of sectoring issues, PAR had to choose whether to look at the northern end or southern end of the line).

We challenged the systems with the tremendous amounts of data flowing into the software and fully stressed it to the point that it was difficult to use. Our comments to the facilitators made it clear that some changes may be required with the most obvious being to run fewer instances of WG on a workstation and to load fewer windows. Instead, spread the WGs and windows across a multitude of workstations to reduce the load on any machine.

I’m excited about the future possibilities of PAR and CASA radars in an operational and warning environment. The improved spatial coverage offered by CASA and the increased temporal updates from both CASA and PAR means we will be better able to monitor the rapid evolution of severe storms. CASA also holds tremendous promise of filling in areas that have poor coverage at this time. That, of course, includes much of the western United States.

I’m less certain of the ProbWarn experiment. I’m a long time advocate of probabilistic warnings and was eager to try to issue warnings using this tool and philosophy. It is still in its early stages and much needs to be done. One of the biggest issues is how to calibrate probabilities for various threats. Different forecasters will issue different probabilities for the same threat. Another issue, albeit minor, is to distinguish these probabilities—which are really threat probabilities—from our traditional warnings. There will be some evolution in how the software works, how forecasters issue threats, and how to calibrate these. There will also be substantial training required of forecasters since this will be a paradigm shift in how we issue warnings to the public.

David Blanchard (NWS Flagstaff AZ – Week 1 Participant)

Tags: None

Summary – 1 May 2008

Note that the event occurred across 00 UTC, but we’ll label the summary on the starting date of operations…

We had several tornadic supercells in Central OK today. The first storm developed just west of Norman and noved over the eastern side of the OKC metro, producing a weak tornado. Two other storms developed north, and at least one of these produced a signficant tornado near Ralston.

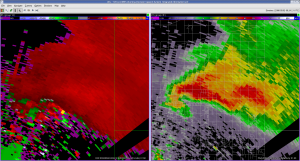
Our visitors, Dave, Mike C., and Andy, worked a PAR IOP today with Pam and Les. Here is an image of the OKC supercell at the time it produced an F0 tornado:

Mike M. also worked a gridded warning IOP on the same storm, concentrating mostly on tornado threat areas. Our IOP lasted about 3 hours, after some gridded warning software issues delayed our start by 1 hour.

MM and I discussed the possibility of another type of warning team concept…use the NWS forecaster as the radar analyst, on the AWIPS machine, and making the decisions of warn, where, and the attributes, and let someone with better proficiency with WDSSII (perhaps an NSSL person) draw the contours. Something for us to think about in future weeks with the experiment, since the WDSSII knobology is a challenge for the visitors.

Greg Stumpf (EWP Weekly Coordinator, 28 April – 2 May)

Tags: None

Live Blog – 1 May 2008 (7:56pm)

Looks like the OKC storm is a dry supercell with DRC problems, tilted downshaer, and not much precip in the hook. MM thinks mostly wimpy tornadoes until the storm could possibly interact with higher dewpoint air as it moves to the NE. Visually on the television stations, the storm now has a classic barberpole appearance, but so far, a visible tornado has not yet been seen (even though there have been sporadic reports of damage in rural Oklahoma County).

Greg Stumpf (EWP Weekly Coordinator, 28 April – 2 May)

Tags: None

Live Blog – 1 May 2008 (7:45-7:52pm)

We’re starting the Live Blog about one hour after the IOP occurred. An isolated supercell developed just west of Norman, and began to track NE. Two more supercells developed north of this storm, near Guthrie and Stillwater. We’re doing a PAR IOP at the moment, as the storms are outside of the CASA network, but we are keeping our eyes open for any additional development to the SW of here. So, for now, Dave B. and Mike C. are working with Pam H. and Les L. on the PAR station. Mike Magsig, our guest evaluator, has decided to do a solo gridded warning exercise on the Oklahoma City supercell. Unfortunately, we discovered a fatal bug in our warning software which forced us to create a build that was slightly old, and which brought back a few of our recently fix bugs.

Greg Stumpf (EWP Weekly Coordinator, 28 April – 2 May)

Tags: None

Outlook – 1 May 2008

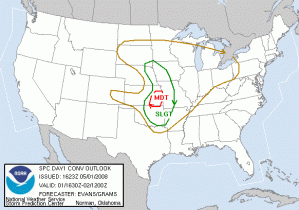
Looks like we may finally have a Central OK event today, but there are several caveats….cap strength and location of the dry line at initiation time. So, both initiation and location of initiation are in question. There is a strong surface low over NC Nebraska/SC SD with a cold front, warm front and dryline extending from it, associated with a very strong negatively tilted trough. SPC highlights a MODT risk in SE KS, and a SLGT up and down the dryline from OK to IA/SD. However, by the time of the briefing several of the deterministic models are indicating that the dryline will retreat west of I-35 by 00 UTC in Central OK.

Because of the uncertainty of severe weather in Central OK, we will plan to have a gridded warning IOP in eastern KS, but will abandon that area if the cap breaks in Central OK, when we will do a PAR/CASA IOP. IOP is planned for 5-9pm, with continued archive case playback from 2-5pm.

Greg Stumpf (EWP Weekly Coordinator, 28 April – 2 May)

Tags: None

Summary – 30 April 2008

We spent the day doing archive case playbacks again with all the participants. However, around 745pm, one severe storms developed in Western Nebraska, too late to begin an IOP (since they must end by 8:30pm). I did some more gridded warning testing and we found a few more minor bugs that need to be issued.

Previous blog entries capture some of the discussion about the gridded warning project. We hope to summarize more of this for the end of week summary. Also, we will be gathering feedback from the PAR and CASA folks.

Greg Stumpf (EWP Weekly Coordinator, 28 April – 2 May)

Tags: None

Outlook – 30 April 2008

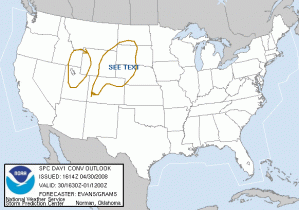
Today will most likely be another non-IOP day, filled with a schedule of more training and archive case playback for all three experiments. There is an SPC DY1 “See Text” area in western Nebraska and SW South Dakota for some high-based marginally severe wind and hail events after 7pm.

We’ll be on an “IOP_standby, for 7-9pm, if severe storms develop in this area. Otherwise, we will continue experiment archive case playback exercises.

Greg Stumpf (EWP Weekly Coordinator, 28 April – 2 May)

Tags: None