HUGE LAP RAP GFS CAPE differences in LBF

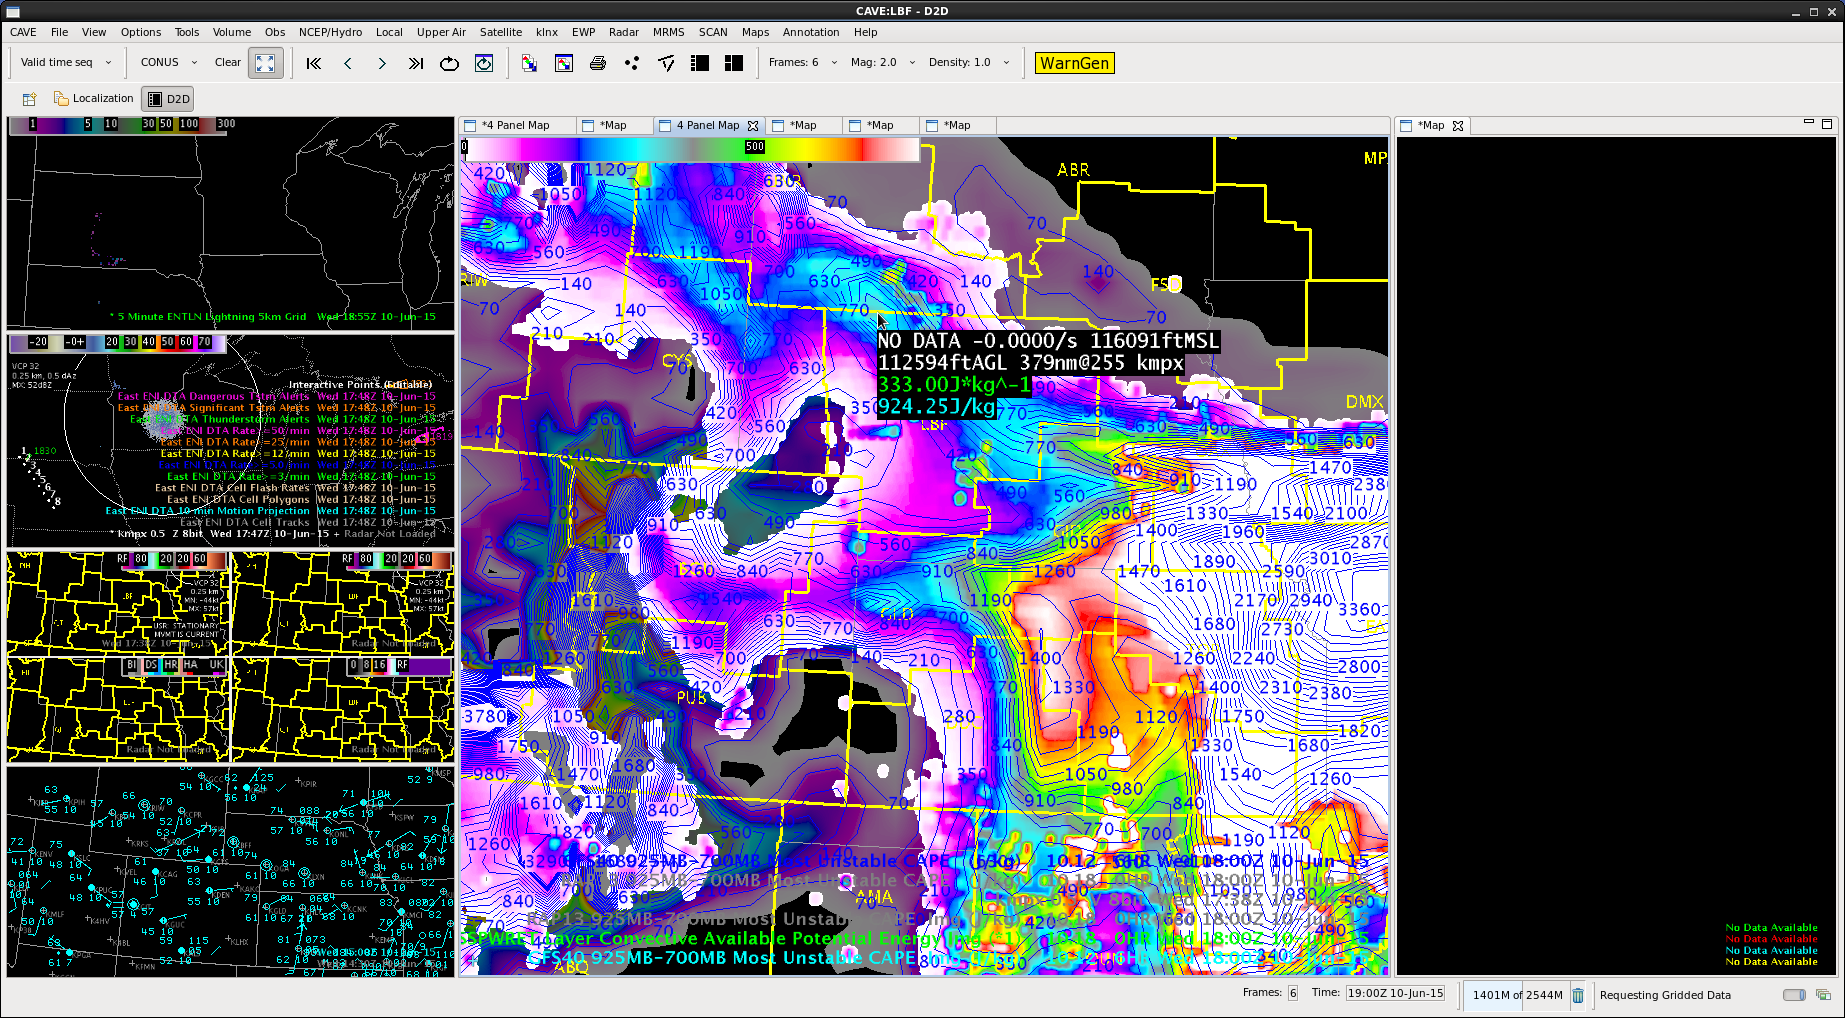
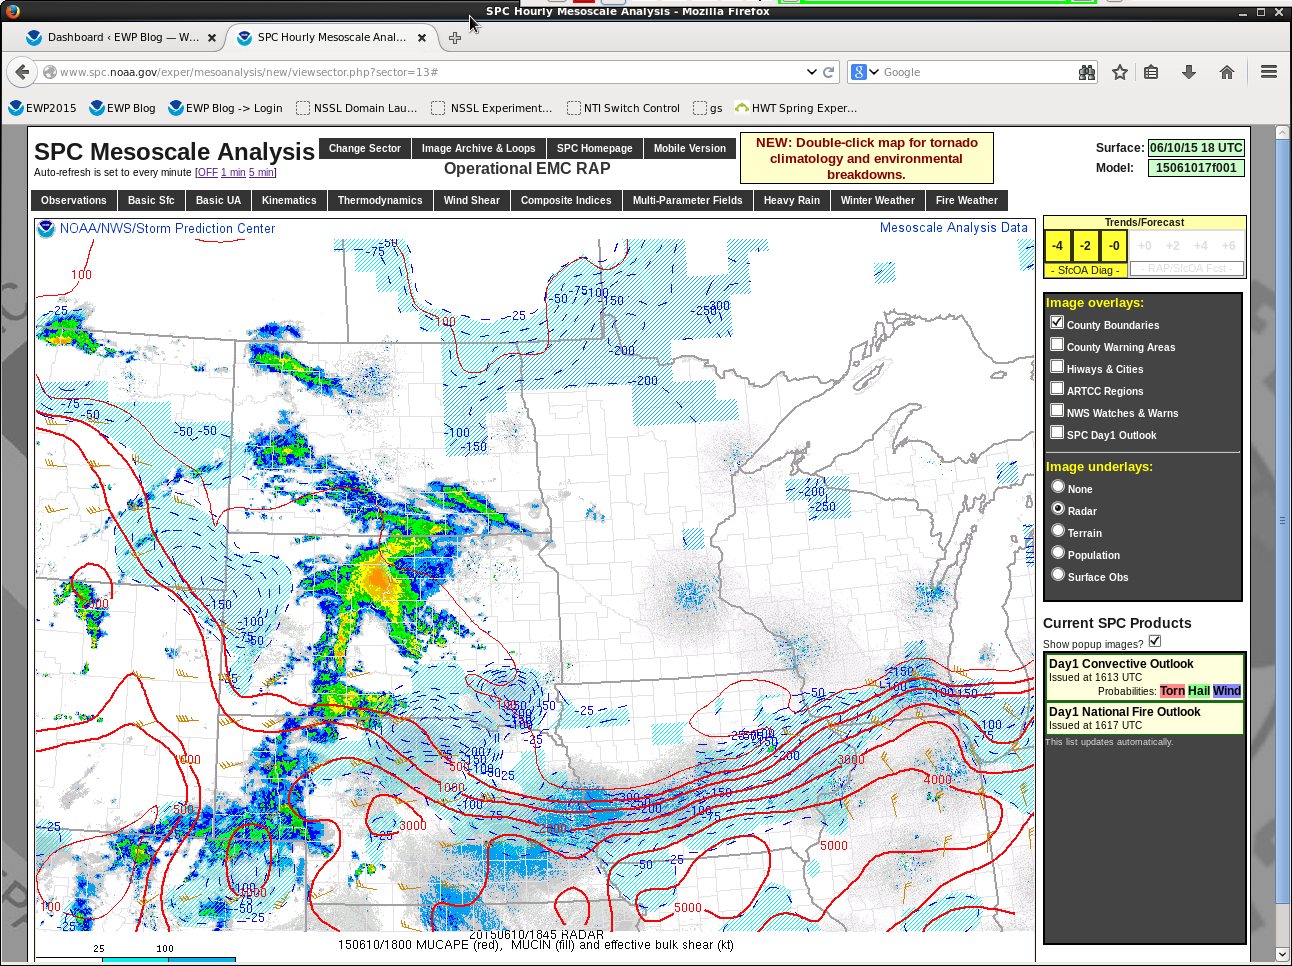
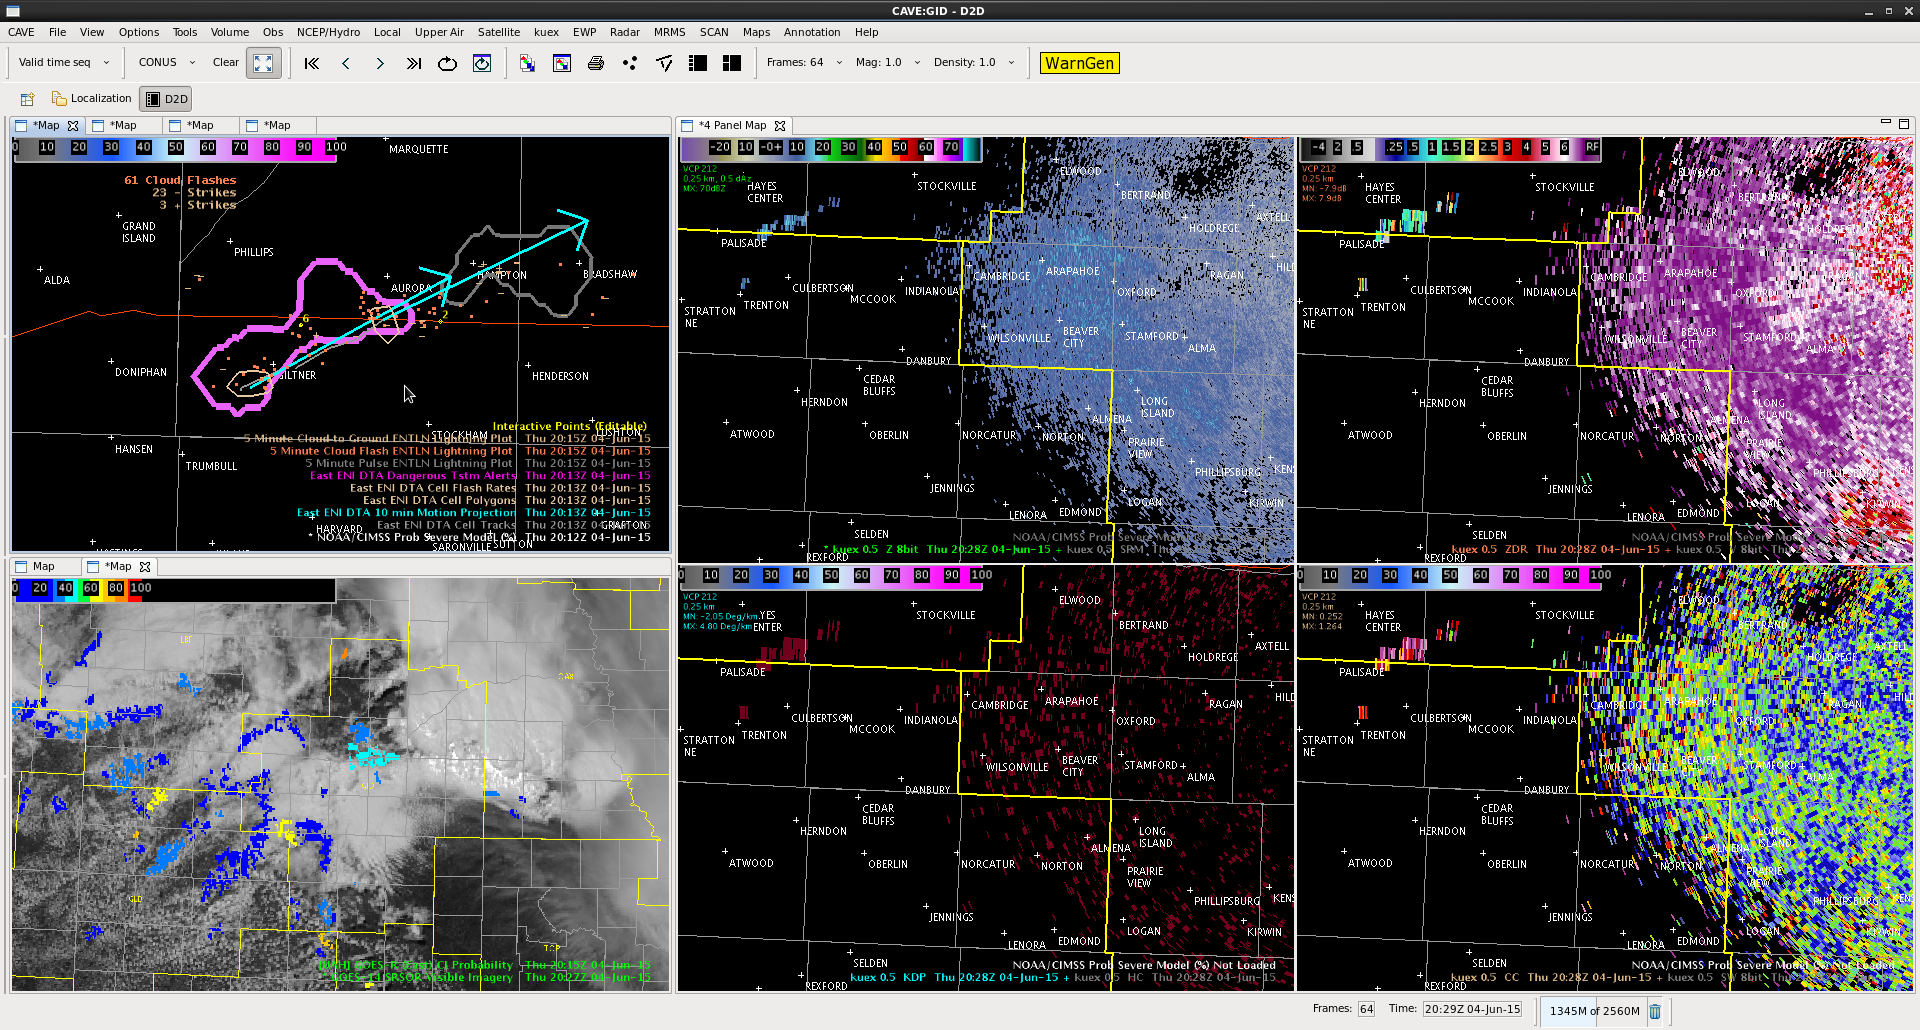
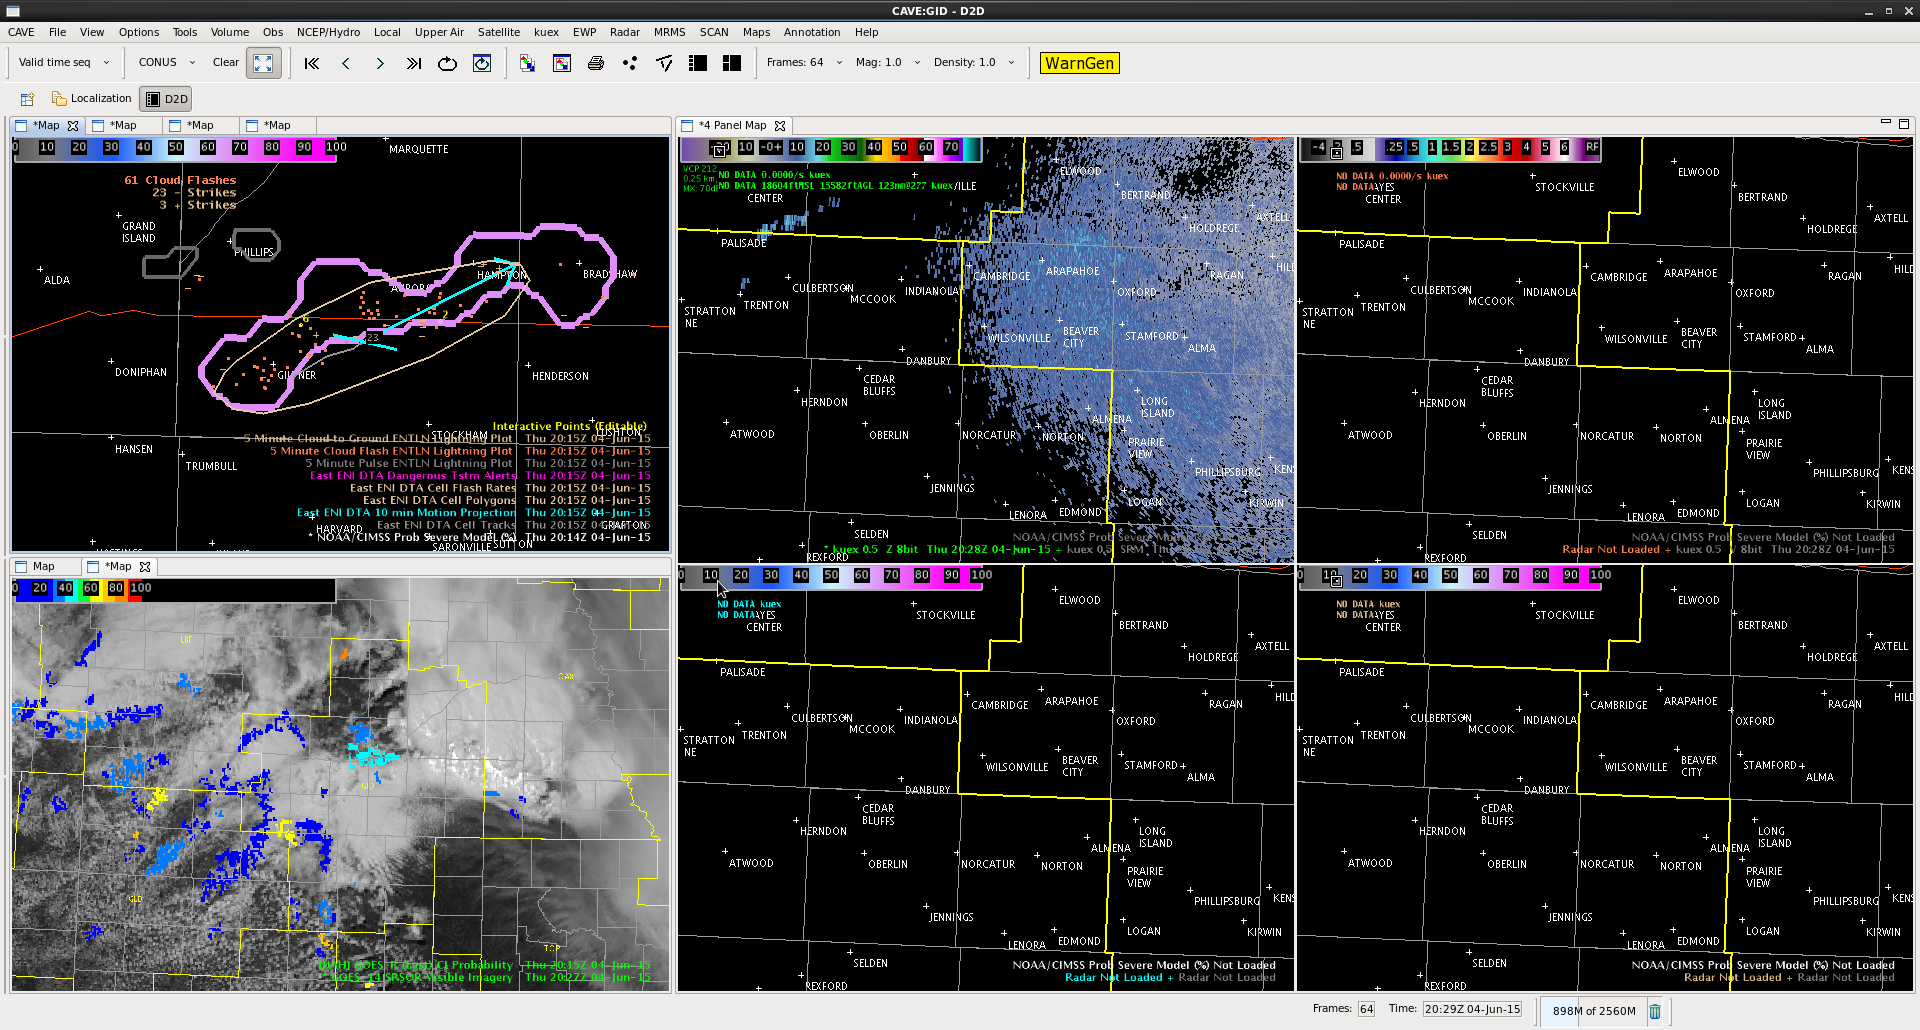
HUGE LAP RAP GFS CAPE differences noted in LBF area. The LAP CAPE is 250 J/kg, First guess GFS ~ 900 J/kg MUCAPE while SPC/RAP is showing 2500 MLCAPE and 3000 MUCAPE. Explosive development is now taking place near LBF.  So my guess is the LAP CAPE is seriously underdone. MrSnow/Brick Tamland

– Large differences are because you are comparing LAP CAPE (which is closest to SBCAPE) to GFS and RAP MUCAPE. Of course MUCAPE will be higher, sometimes significantly, than SBCAPE. I would suspect the GFS first guess had weak instability, which is why the LAP would be low as well – BL

GFS_LAPCAPE SPCMesoCAPE


Tags: None

MESH says hail, reports tell a different story

Below is an image of the MESH accumulated tracks over the last 2hrs for the CTP CWA. Severe Thunderstorm Warnings were issued, mentioning both hail and wind potential, but only the wind threat came to fruition. There were at least 4 locations where the MESH was over 1″ and in one case, it approached 2″. Reports of hail can be finicky, as maybe the larger hail fell in an area where no one lives/travels. The only report of hail that we received out of all of the warnings was pea sized in northern Perry County, PA.

MESH

-Shasta

Tags: None

Severe Probability along a line

One thing I noticed as the individual storm cells began to merge is the merging of the NOAA/CIMMS Probability of Severe product. While this does make some sense as the convective mode becomes linear… the problem I see is the sample gives characteristics for the entire line. Some of the sampled values make sense (Env. MUCAPE, Env. EBShear, etc…) but for something like the MESH value, I think it could be misleading. Instead, I would like the Severe Probability product to follow the stronger cells embedded in the line, thus breaking up the numbers some.

SevereProb

-Shasta

ENI cell tracking

Cell tracking is inherently difficult, here is an example of how it can lead to conflicting data.Screenshot-CAVE:GID - D2D -3 Notice the two cells to the in the upper left image.  These cells congeal in the image below. Screenshot-CAVE:GID - D2D -2


We both had timeseries set on the individual cells above.  When they combined the resulting time series of each did not seem to match each other.

TF_timseries Screenshot-CAVE:GID - D2D -1

What this means is that when you are looking at time series of merging storms, you will need to reset your point for the time series to work and be aware of what is going on when you use the data.

MacGyver and Cattywampus

Tags: None

First SVR for GID

Probsevere jumped to near 70% with this storm.  Large core of 50+ dBz at 30kft.  The -30 is around 24kft based on the LBF sounding.  There was also a jump in lightning according to the ENI timeseries and data.  Decided to issue a warning for this storm.


Screenshot-CAVE:GID - D2D

MacGyver

Tags: None

Gravity Waves on SSRO

These gravity waves should lead to an interesting afternoon across the GID CWA.  The one min ssro data is EXTREMELY useful and helpful with trying to figure out what is going on.  I think these waves may lead to some CI or storm intensificationsatlater today.


MacGyver

Tags: None

Vigorous updraft well sampled on 1 min imagery

dodge

The persistent cell over eastern Kansas shows good evidence of strong updrafts on the shadowed 1 minute imagery.  Deep convection with good evidence of rotation on radar imagery likely is producing severe hail.  CIMSS algorithm currently shows 99 percent likelihood of severe with hail size hear 2 inches.

John Pendergrast

Tags: None

Early cell splits have shown left dominant cases as most persistent

Mid afternoon radar interrogation on CYS radar has shown left moving cells the most dominant cases in splitting situations. A cell exiting the CYS county warning area to the north has shown high reflectivity aloft along with high total lightning flash rate.  CIMSS probability of severe earlier peaked at the highest value so far today over 80 percent with MESH of 1.05 inches.

John Pendergrast


Tags: None