Using ProbSevere as a key piece of info for warning decision.

Issued a SVR at 23:53z over northern Stutsman County. Lightning flash rate increased prior to intensification from 2340Z to 2347Z (fig 1) then the cell produced 55 dbZ to >30kft.  The cell was getting to be far from the radar with the 0.5 scan reaching only 12.5kft. ProbSevere showed probability of 94% at this time (Fig 2).  The limited low level information with a farther distance from the radar made the use of ProbSevere more heavily weighted in the warning decision. –CattyWampus

flashplot

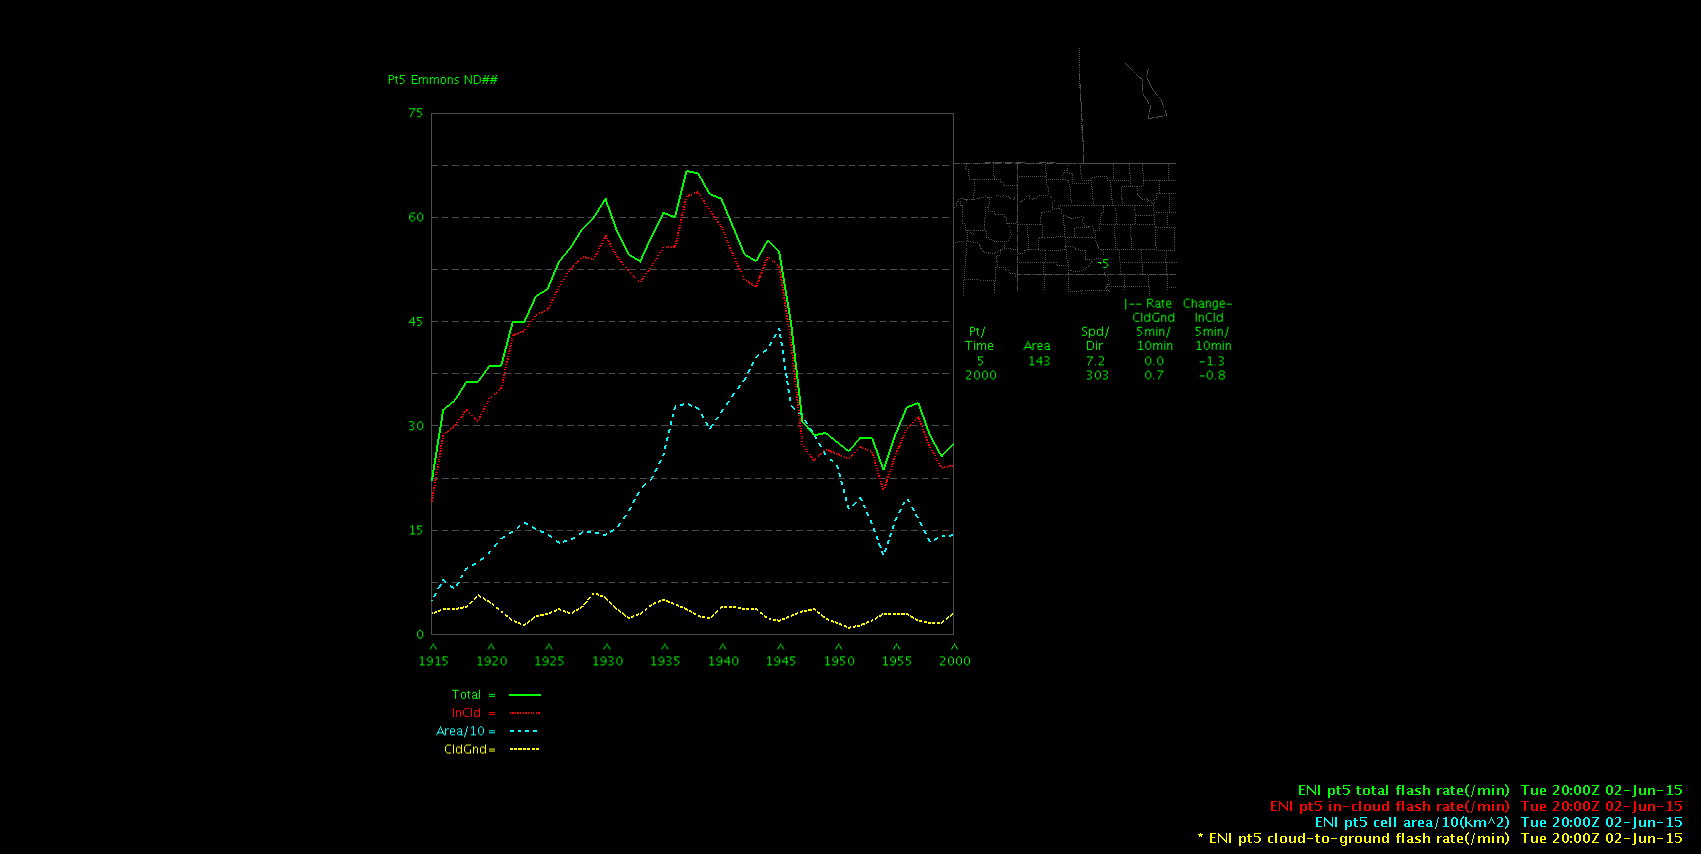
Fig 1: Increasing flash rate from 2340Z to 2347Z.

2352zProb

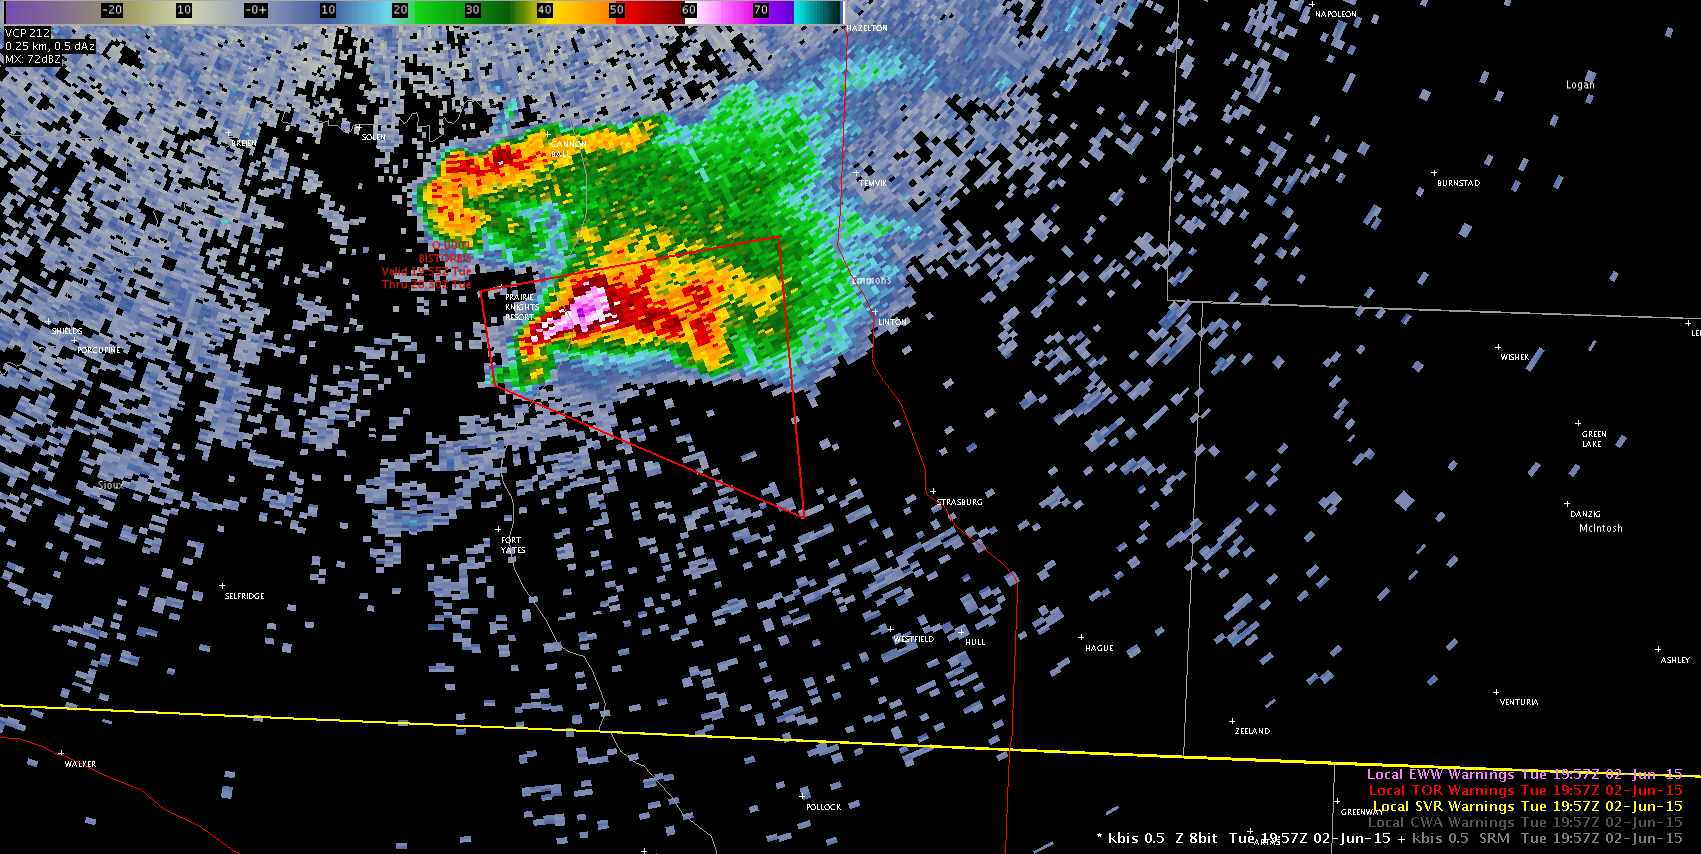
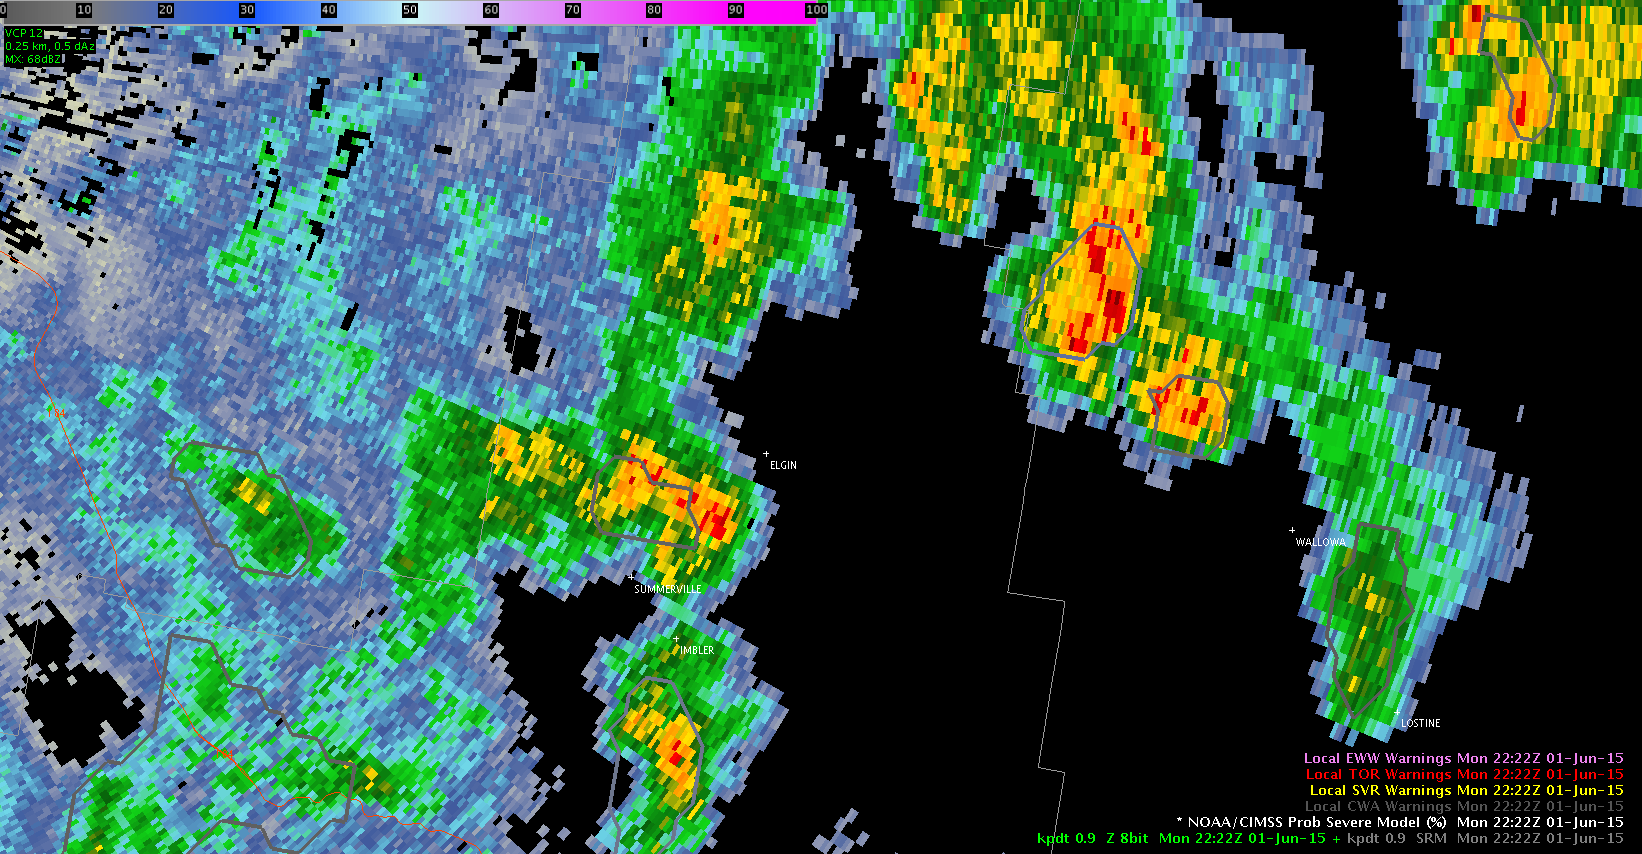
Fig 2: ProbSevere 94% at 2352z.


Tags: None

Overshooting top in SRSO, no algorithm trigger, parallax error

SRSO vis channel showed an overshooting top (Fig 1: Gif Loop) in McLean Co, but the overshooting top detection algorithm did not make a detection on this feature. This was useful information in that it showed it wasn’t vigorous enough to actually be quantified as strong enough to be detected.  Also noticeable was the 1 minute lightning was displaced south of the overshooting top feature, but aligned with the radar echo. After discussion with Chris S. the displacement seems to be a result of parallax error.  –Cattywampus

parallax

Tags: None

CI-East: Success and Failure all in one.

This is a case where I found CI to be helpful in helping focus attention where there was nothing on radar but it was showing potential for convective development. Fig 1 shows a swath of about 23% over Kidder Co and about 33% over Burleigh Co to the West at 21:15z.  About a hour later at 22:22z (Fig 2), we saw development on radar over Kidder Co but nothing over Burleigh which had the higher probability.  This was helpful in this case because I was not anticipating development in this area, but the CI helped grab my attention to watch this area. –Cattywampus. CI_2115ZFig 1: CI-East over Burleigh and Kidder Co

2217z
Fig 2: Convective development over Kidder at 22:22z.

Tags: None

Rapid Flash Rate Changes, Cell algorithm mergers.

Just a case when lightning rate plot shows large fluctuations (fig 1) but seems to be of little use due the fact that data may not be necessarily showing updraft intensification and area broadening, but mainly a result of cells merging together.  Initially ENI, identifies a rapid jump as the two identified cells are merged into 1, then a quick drop as the cells separate back into two different cells, than another jump as they merge back together (Fig 2 – gif loop).  –CattywampusENI_Flash Rate2142

Fig 1: Flash Rate Jumps

merger

Fig 2: Cell mergers

Tags: None

BIS CWA: Using NUCAPS and CIMSS to anticipate new convective development

Trying to anticipate future convective development. Looked at a CIMSS CAPE (fig 1) plot and seeing that the best CAPE is shifting into the eastern CWA. Took the available NUCAPS sounding and modified  it with a nearby metar with a 77/66 surface reading.  See plenty of CAPE (3,500 J/kg). May be too much just simply modifying the surface points along, but nonetheless it shows it is plenty unstable.  This was also in a mostly clear region.  Plan on testing CI-East to see if this clues in on potential development in this area. –Cattywampus.

CIMSS_CAPE

Fig 1: CAPE shifting east along with surface low and southerly flow.

nucaps

fig 2. Modified NUCAPS sounding over cloud free SE portion of the CWA. Still quite unstable.

–Cattywampus

Tags: None

ENI Display

My 2 cents on the ENI AWIPS display. I found the data available via ENI was too overwhelming along with a cluttered display. The list on the right shows all the options available to look at and it becomes too much to ingest. I suppose with training and experience it may be a little more intuitive but not initially. Polygons shift direction rapidly with different storm directions, there is a listing for each DTA rate, a polygon for each cell along with flash rates for the cells. Add in the different obs plots for pulse, flash, cloud to ground. It gets very confusing. Granted this is new, but many off our staff also found this confusing when we recently had it installed with our AWIPS2 build. When information becomes too cluttered and confused it tends to get disregarded and not used in Ops.  Consolidation of the DTA Rates into one item with changing colors would be beneficial, same as with the alerts.  I think the cloud flashes are better represented as circles and not dots as it is shown on this workstation.

–Cattywampus. ENI_Plot

Tags: None

Bismarck, ND: 1955Z TOR Issued

A cell over far eastern Sioux County demonstrated rapid growth and a split in which the southern cell developed into a super cell (fig 1).  The split occurred around 1940Z which marked roughly the end in the increasing trend of flash-rate which showed a marked increase around 1915Z (fig 2). The flash rate served as SA for cell strengthening, the TOR was issued based on the development of a mid-level mesocyclone and a trend in increasing low-level velocity couplet at 0.5 degrees.

TOR_radar

Fig 1: Spit with subsequent supercell formation at 1957Z.

TOR_total_flashRate

Fig 2: Increasing flash rate between 1915-1940Z. Splitting cell occurred around 1940Z.

Tags: None

Thoughts on ENI cell area

We’re looking a multicellular situation in OR. We’ve had no lightning jumps show up in our area, so have been looking at the other lightning data available to us. Occasionally, an ENI cell will show up; however, we’re wondering how useful the cell area data is in a timeseries during a multicell event. A cell will be flagged and then its shape may change drastically as in the example below (upper-left panel). However, this change doesn’t appear to be tied to a drastic change in lightning or radar data – anything physical happening in the storm. Rather, it appears to be mostly due to how the clustering is determined.

Perhaps its value is greater in a more cellular storm mode. Perhaps the terrain is also causing a problem?

eni2304

Williams & MacGyver

Tags: None