Another split decision day ahead with two areas of favourable convection.
1) NE Colorado area – Deepening low pressure center will push southward, bringing flow out of the south/southwest and pulling moisture into the region. Model soundings show destabilization occurring in NE Colorado between 18-21z with forecast PW values exceeding 1″ over the region by early afternoon. I don’t know how many people were chanting “UPSLOPE! UPSLOPE!” in the HWT today but there were quite a few.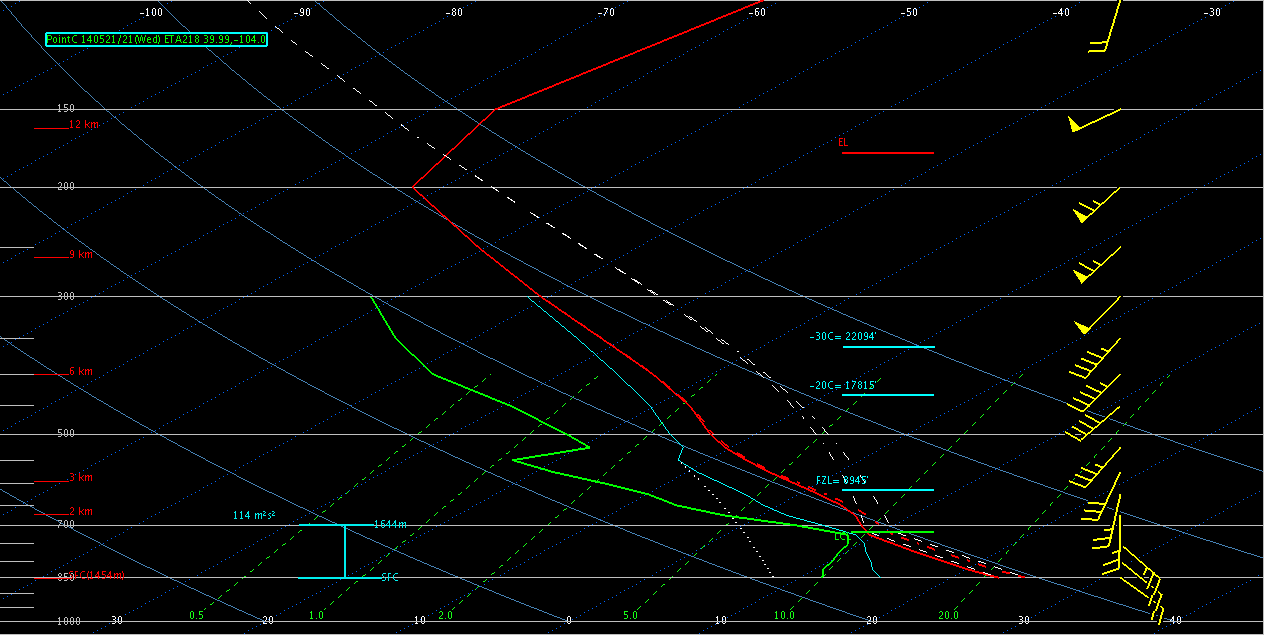
- 21z NAM12 forecast sounding over Adams County, Colorado.
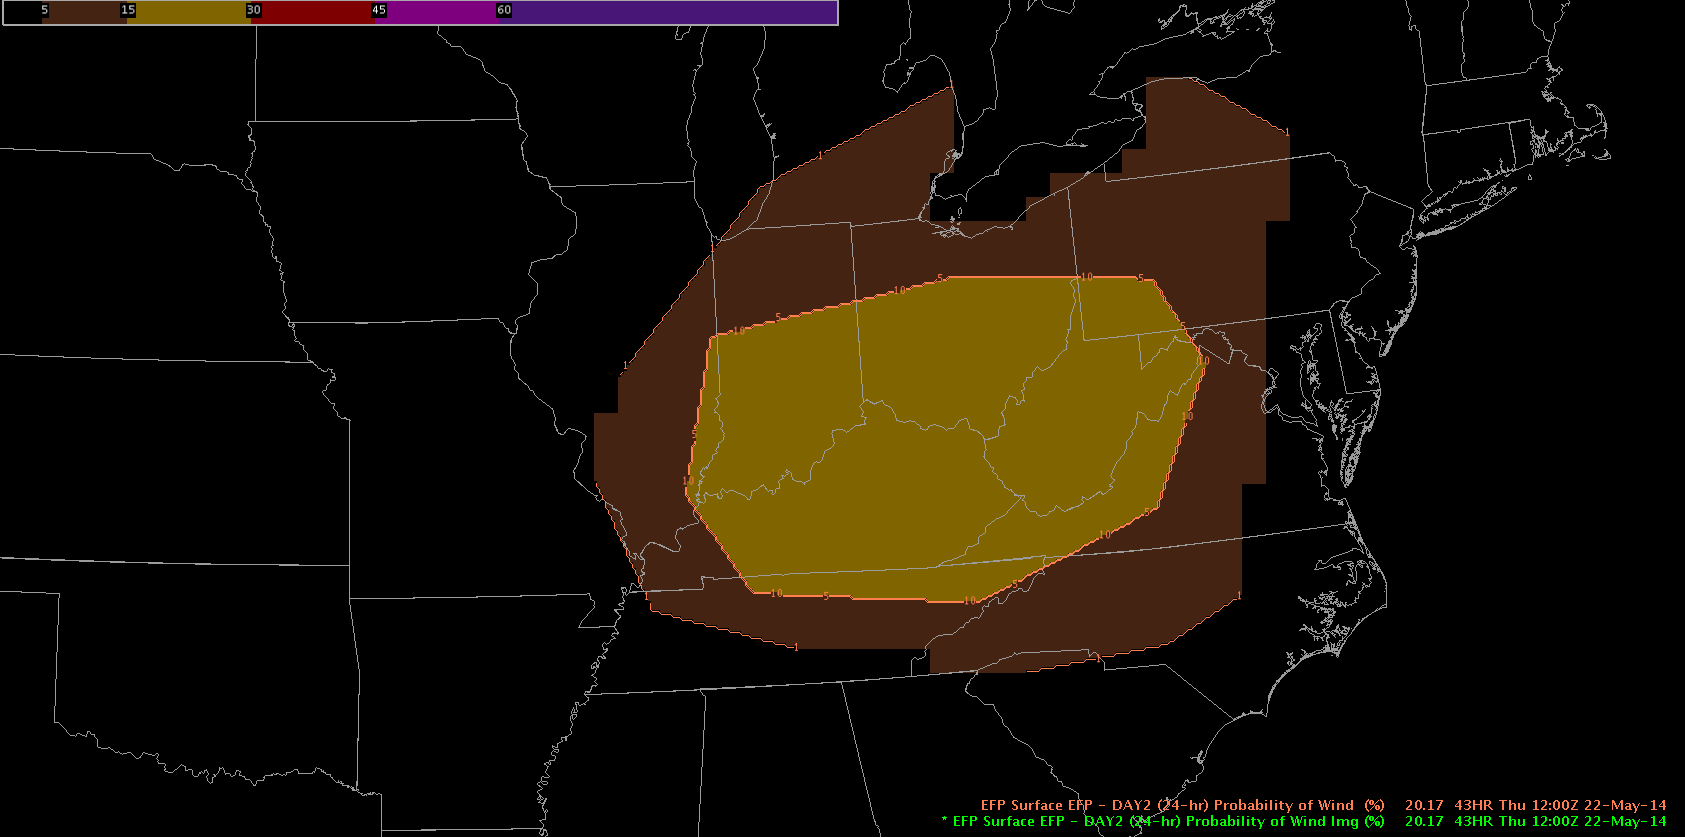
Ohio Valley/Lower Mid-Atlantic – Forecast surface dewpoints in this area in the upper 60’s/low 70’s with mid-level shear between 40-50 knots over the entire region. EFP forecast probabilities remain low over this region as there is quite a bit of uncertainty of what dominant storm mode will persist overnight. We will see in the morning!
We’ll meet in the Dev Lab tomorrow at 12:30pm and debrief our exciting adventures today before heading over to the HWT at 1pm.
-Darrel Kingfield
EWP Week 3 Coordinator