An official website of the United States government
Here’s how you know
Official websites use .gov A
.gov website belongs to an official government
organization in the United States.
Secure .gov websites use HTTPS A
lock (
) or https:// means you’ve safely connected to
the .gov website. Share sensitive information only on official,
secure websites.
See below at 22:13Z, at this time there were 18 detections from the NTDA algorithm.
NTDA algorithm icons at 22:13Z
Now before you go warning for a big bowing, comma-head shaped QLCS, taking a look at the velocity field below would show the vast majority of these detection were due to mountainous terrain and stable airmass turbulence. Only 1 detection was due to a potentially tornadic circulation. You can probably guess which one that is by the probability icon color, but in the subsequent scan that probability was reduced to sub-50% and fell back into the rest of the noise. Generally, forecasters may be good at filtering these false detections out in a highly severe environment, but in mountainous areas where severe weather is rare, it may be something forecasters discard before an event ever occurs.
Prior to 21:09Z, the NTDA algorithm was keying in on sidelobeing issues ahead of the storm, the the NMDA held strong indicating no rotation. At 21:09Z, a hook echo began to form with a solid rotational signature in a good dat region, and both algorithms picked up on the signature quickly. Using the objective analysis, seeing the NTDA put out a Probability >50% with the NMDA put out an Avg AZShear in the bottom 3 scans of 22.9 *10 ^-3 /s, helped add confidence to the decision to warn quickly.
KSFX @ 21:09ZKSFX @ 21:09Z
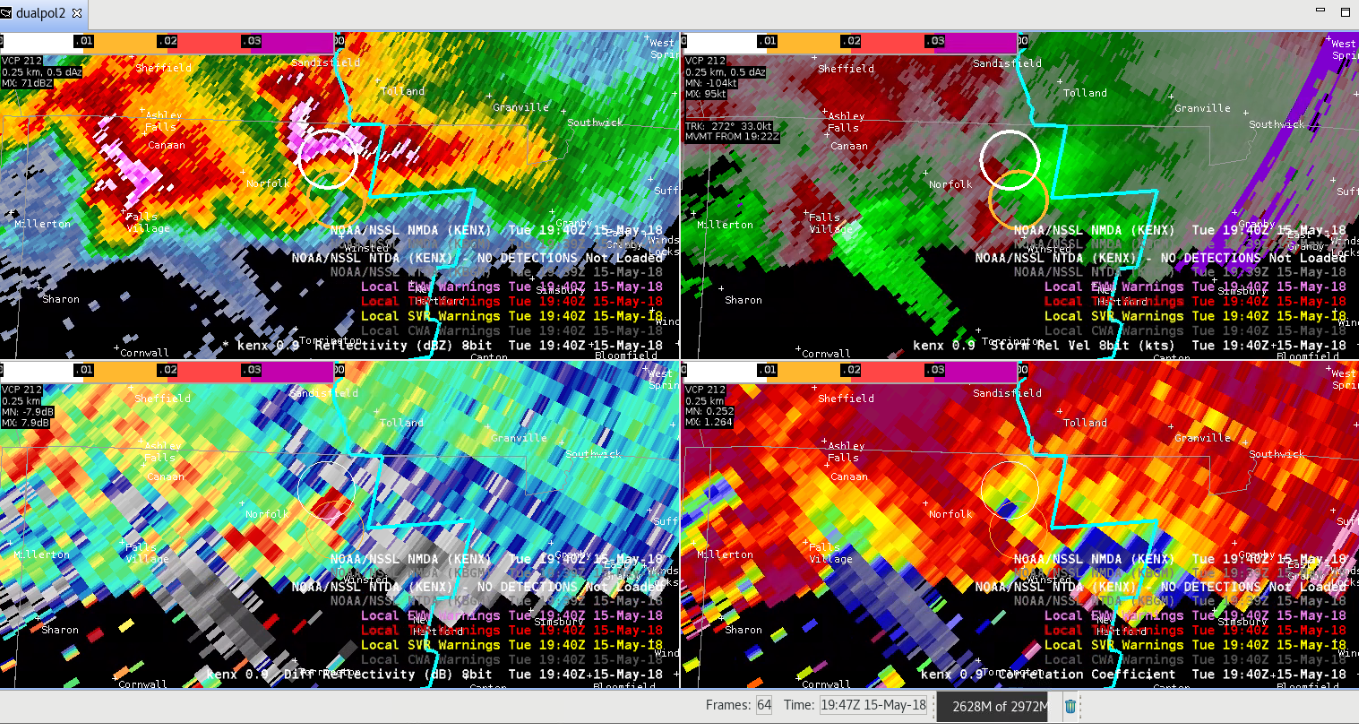
A couple times though (like at 21:15Z as seen below), the algorithms were still keying in on bad low-level data due to sidelobing from time to time. Velocity images compared to Correlation Coefficient show where more reliable data is located.
The NTDA tracked this tornado very well throughout its life cycle. However, there was an instance where the probability briefly decreased from approximately 95% to 67% around the time that the overall circulation and max az shear was strongest. It rose to 98% again on the following scan as the circulation weakened slightly. This can be seen in the velocity trends as well as the MRMS low-level rotation tracks.
A Severe Thunderstorm Warning was issued on a storm in Marshall County, IA with a much more robust storm further south in Marion/Mahaska Counties. After checking up on the southern storm, I did a quick check-in on the Z/V fields at 0.5 degrees for the northern storm. At the time, the storm didn’t look immediately capable of tornadic production, but earlier LSRs with low thresholds prompted the Severe/Tor possible. At 0.5 degrees, Velocity showed a bit of increased shear but nothing too substantial with a Delta-V of approx 30kts, and NROT of approx 15kts. The TDA picked up on this, but what intrigued me was the MDA did as well which had been very stingy at picking up mesocyclones which caught my eye. The readout suggested a meso signature was being detected within several bottom layers, which prompted me to look at all tilts, and voila! Above the 0.5 degree scan a decent-looking mesocyclone was much more prevalent. This mesocyclone indicated the storm was much more organized than originally expected and lead to the issuance of a tornado warning while anticipating further strengthening of the circulation. Eventually, the Tornado Warning was verified by an LSR report at 2122Z.
KDMX @ 21:10Z at 0.5KDMX @ 21:10Z at 0.9KDMX @ 21:10Z at 1.3KDMX @ 21:10Z at 1.8
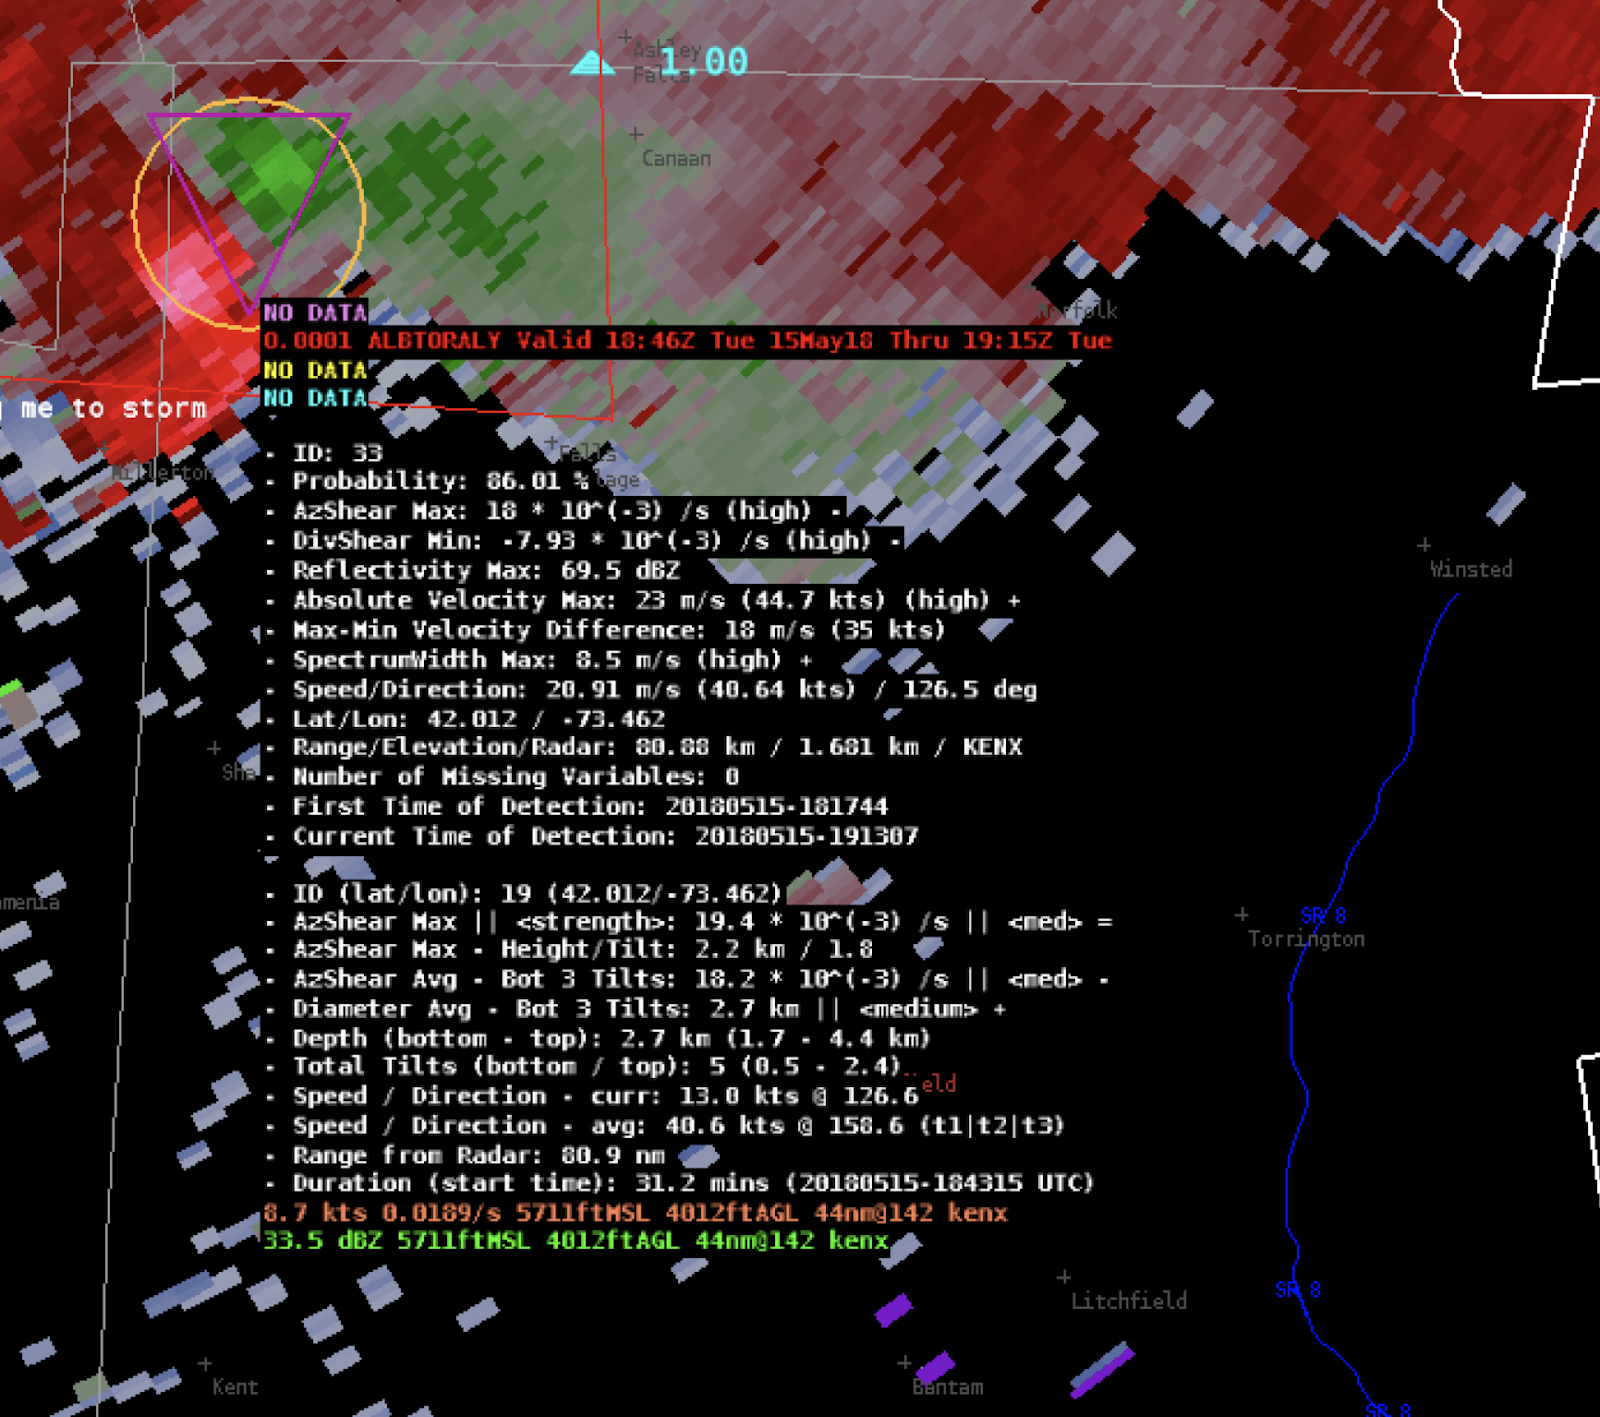
The readouts for the NMDA & NTDA are one of the biggest improvements for these products. It adds the objective analysis I would want out of these products with users ability to (1) pull them up at will thus reducing screen real estate and (2) has them linked to each individual storm/icon so I can easily relate the objective analysis to the storm under investigation. The 1 advantage of a table format highlighting the most intense circulations are solved with color attributes of the icons, which is better in my mind because it relates the severity of the rotational signatures to climatology versus a ranking of storms on any given day.
The drawback of the readouts is that size and the massive amount of information thrown out at once, there is so much in these tables that it’s hard to point out any one thing to follow. In my opinion, each readout should be cut in half to optimize the deluge of information. In addition, the value behind multiple fields should be combined where possible and some organization can help cut down on redundancies between titles thus reducing the amount of space in the product descriptions. For example:
AzShear Max
Strength: 19.4 * 10(-3)/s || <Med> || ↘
Diameter: 2.0 km || <Med> || ↗
Height/Tilt: 2.2km / 1.8 deg
Avg Bottom 3 Tilts
AzShear: 18.2 * 10(-3)/s || <Med> || ↗
Diameter: 2.7 km || <Med> || ➝
Meso Depth (bottom – top)
Distance: 2.7 km (1.7 -4.4 km)
Tilts: 5 (0.5 – 2.4 deg)
Storm Attributes
ID (lat/lon): 19 (14.01 / -73.46)
Speed/Dir: 40.6 kts @ 158
Duration: 31.2 min (since 18:43Z)
…etc. While I wouldn’t advocate for all these fields, this could be a more organized way to organized the information in the NMDA, that would allow user to find information faster. If awips can handle Unicode, special arrows could also be used as symbols.
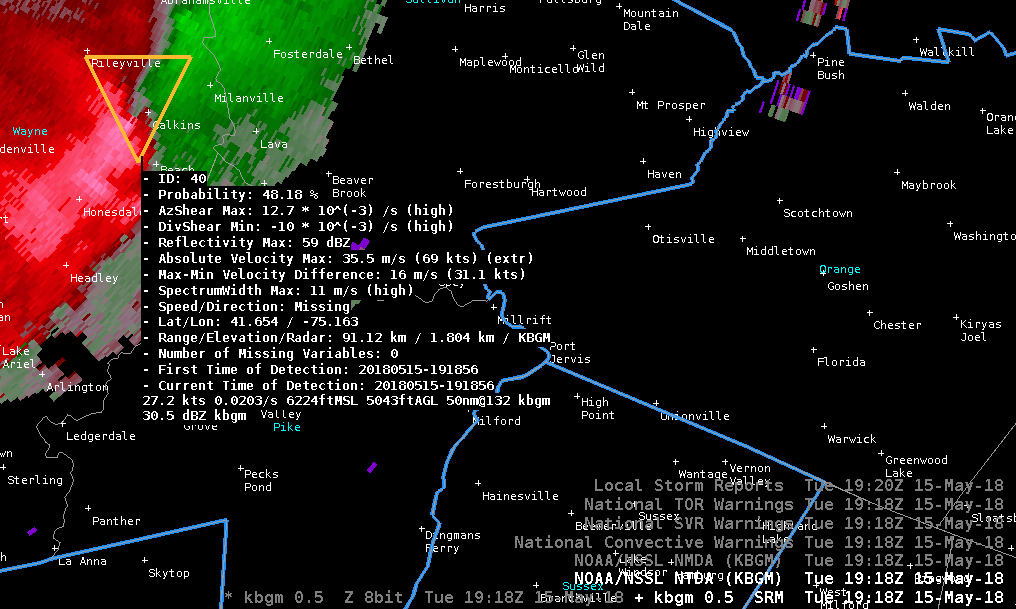
A severe QLCS thunderstorm with a history of producing tornadoes developed a “kink” along the leading edge. The NTDA instantly brought the forecast attention to this area, with a 48% probability at 1918 UTC. NTDA continued to track the feature as it developed, and a spotter reported a tornado on the ground at 1930 UTC.
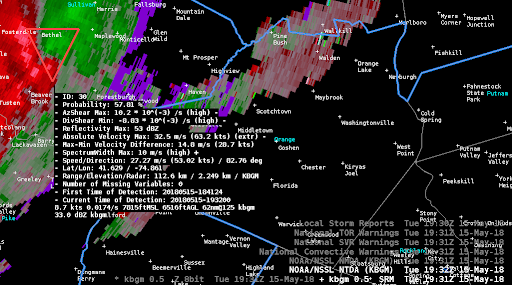
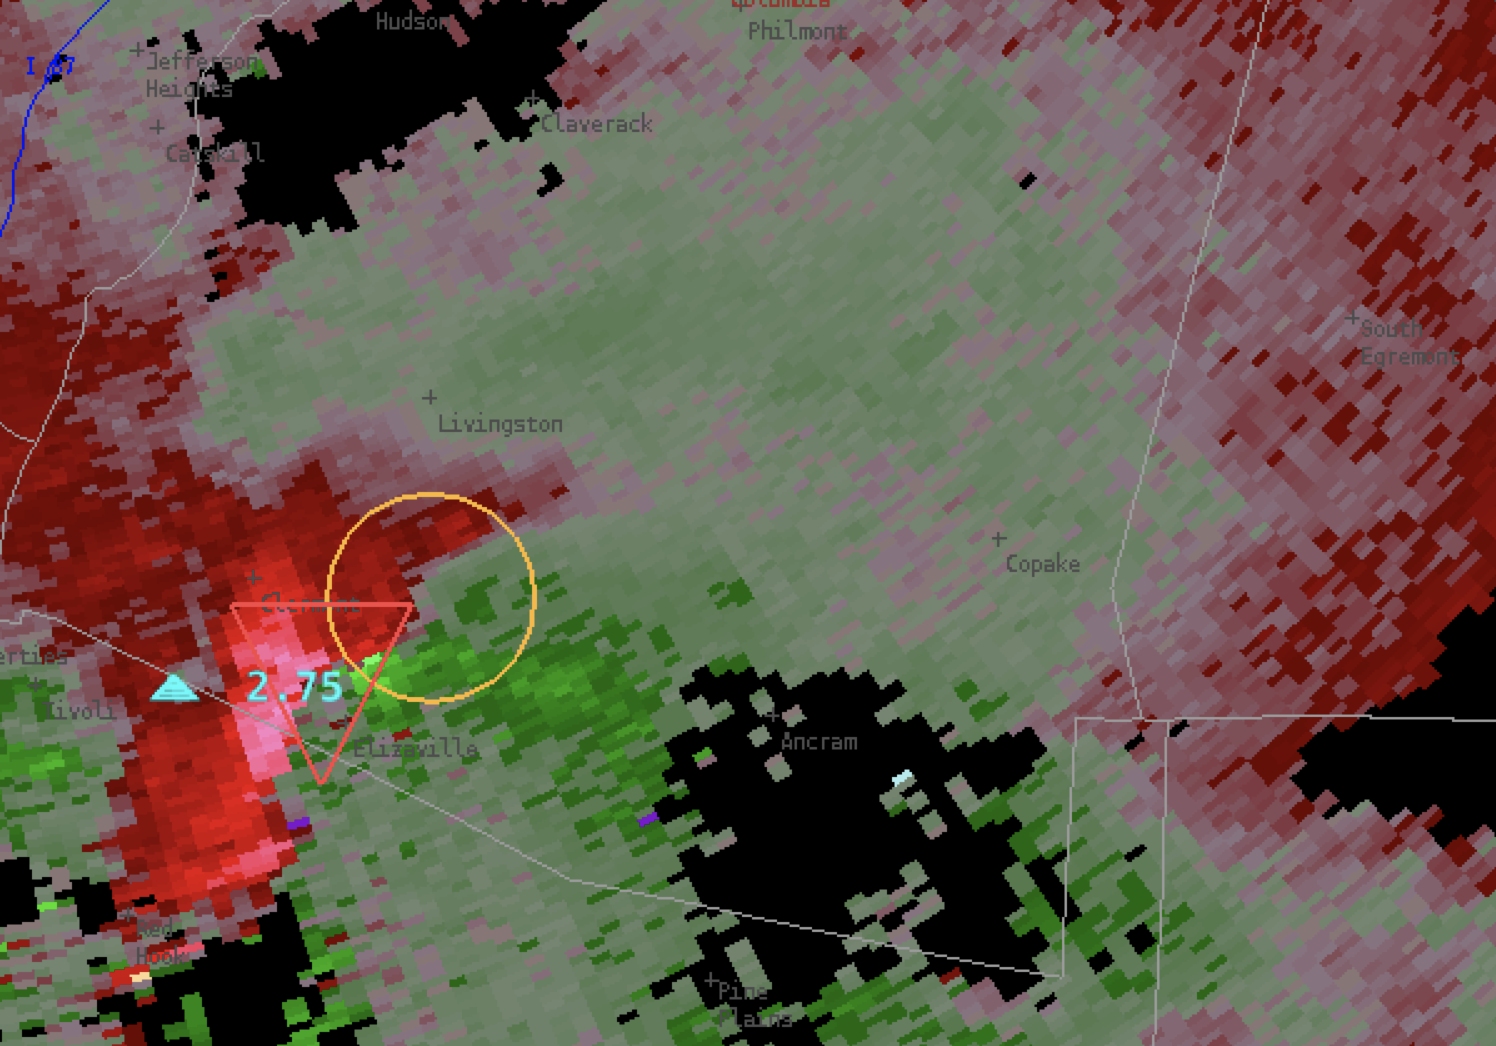
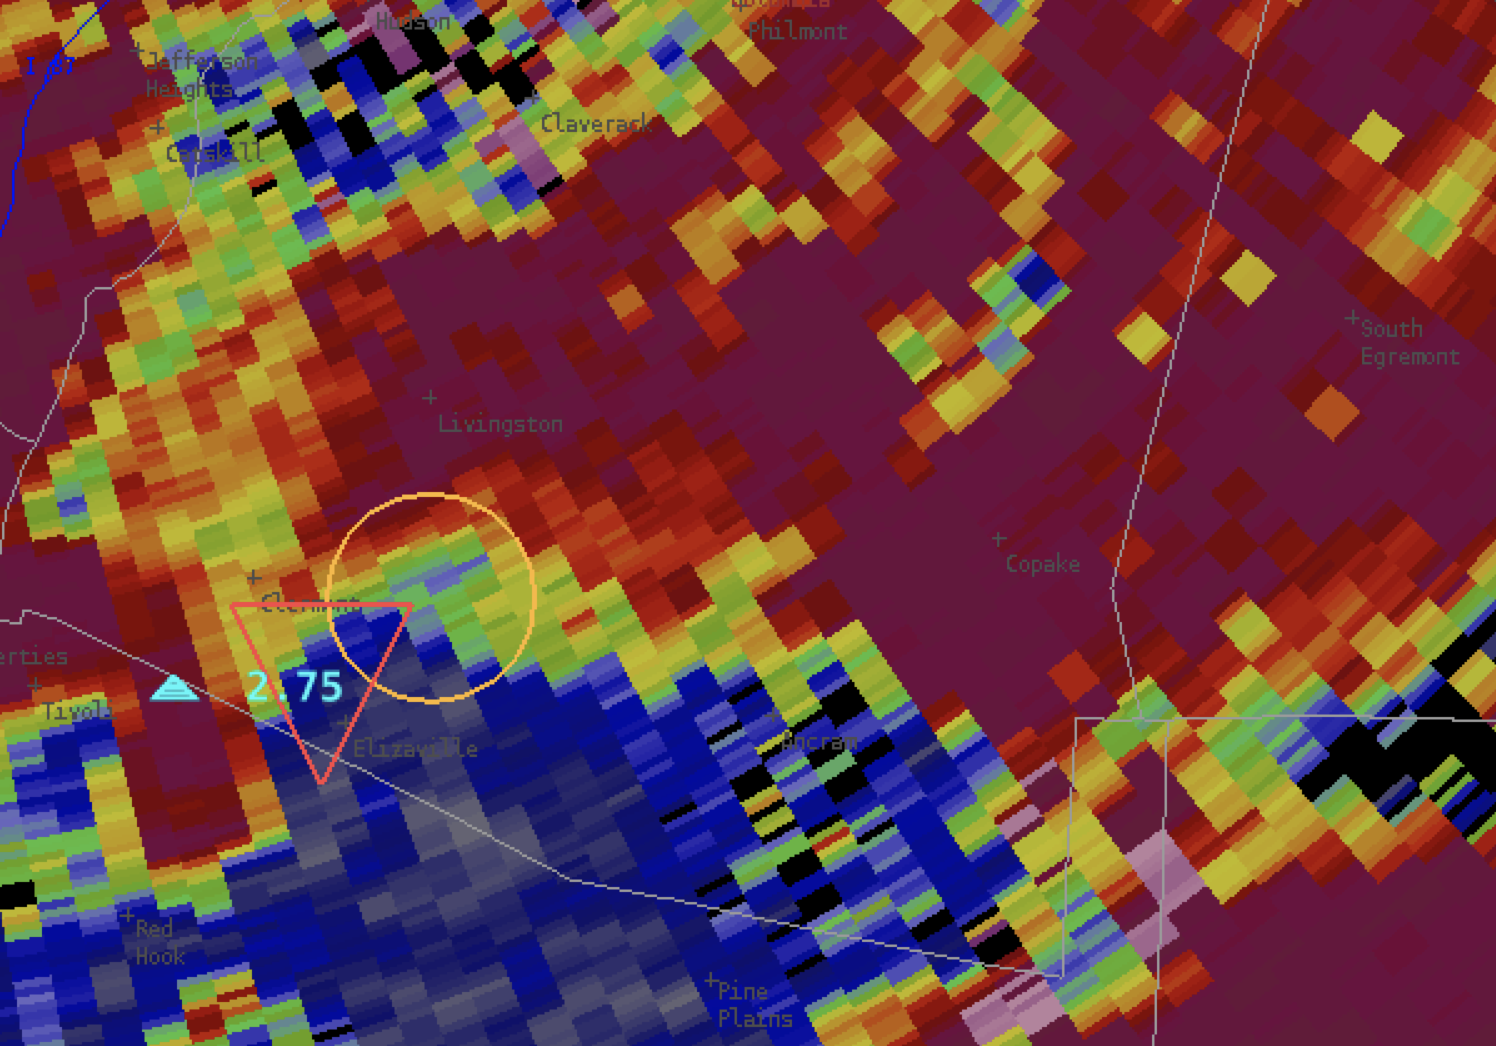
Looking at the area where the NTDA & the NMDA overlap in the images below, seems to indicate a large hail core where reflectivity is approximately 40 dBZ and higher, and a three-body scatter spike where reflectivity drops to less than 40 dBZ. The NTDA is indicating a probability of around 58% but the storm looks rather messy at this point with several of the highest inbound velocities occurring in areas where velocity is suspect due to the hail spike.
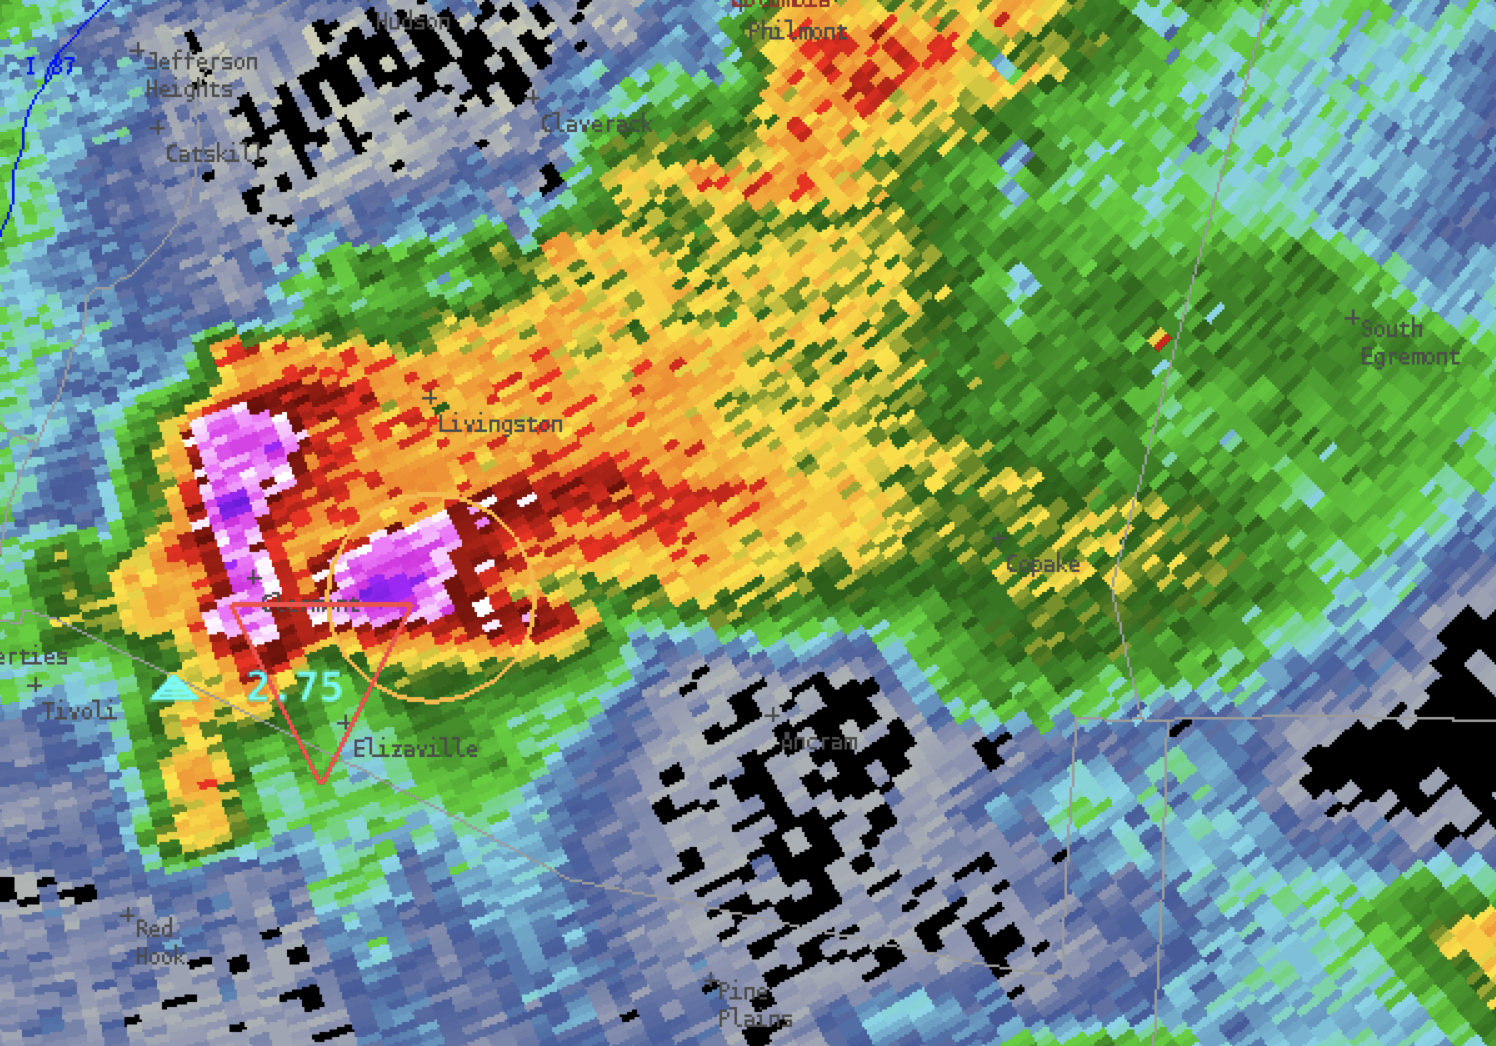
The NTDA and NMDA for KENX had significant shortcomings for the 15 May 2018 event in the ALY CWA. The algorithms struggled to detect clear mesocyclones in cases where a significant hail spike was present. Could this hail spike be interrupting velocity data and causing unnecessary filtering of the algorithm? Also note that the velocity data appears to be more convergent, possibly due in part to the hail spike.
When a new radar slice loads into AWIPS, NTDA takes several seconds to load in on top of it. The legend displays “NO DETECTIONS Not Loaded”, and there are no symbols on NTDA symbols on the radar map. The no detections in this case can be confusing, since it really means the product has not loaded in yet for the valid time.