NEW NUCAPS

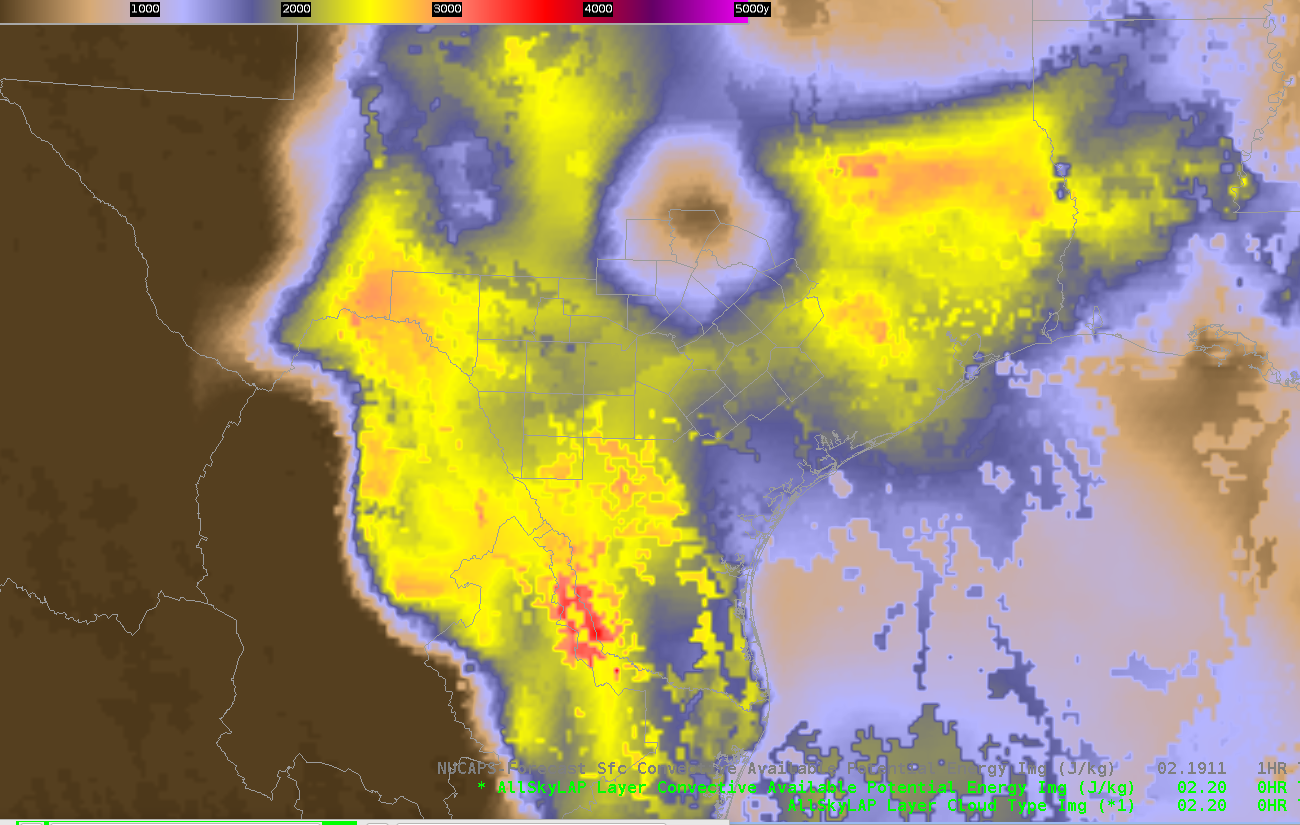
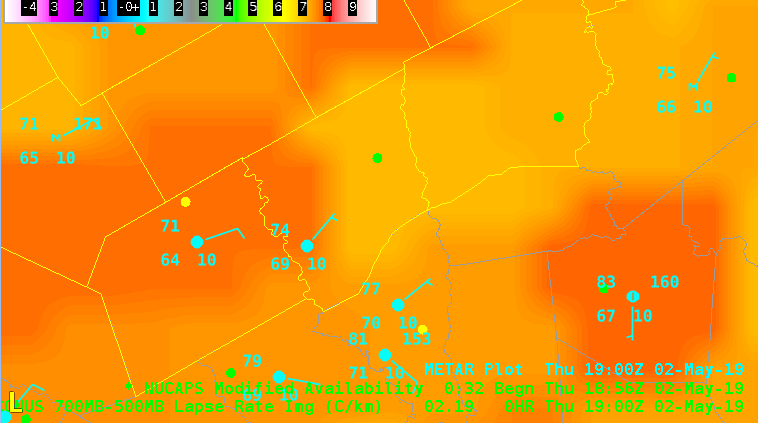
NUCAPS offer a way to get a vertical profile of the atmosphere across the US. However, in areas where soundings were not “retrievable” it can leave many of the products with large holes in them.

Default Output From NUCAPS on w/ vis satellite

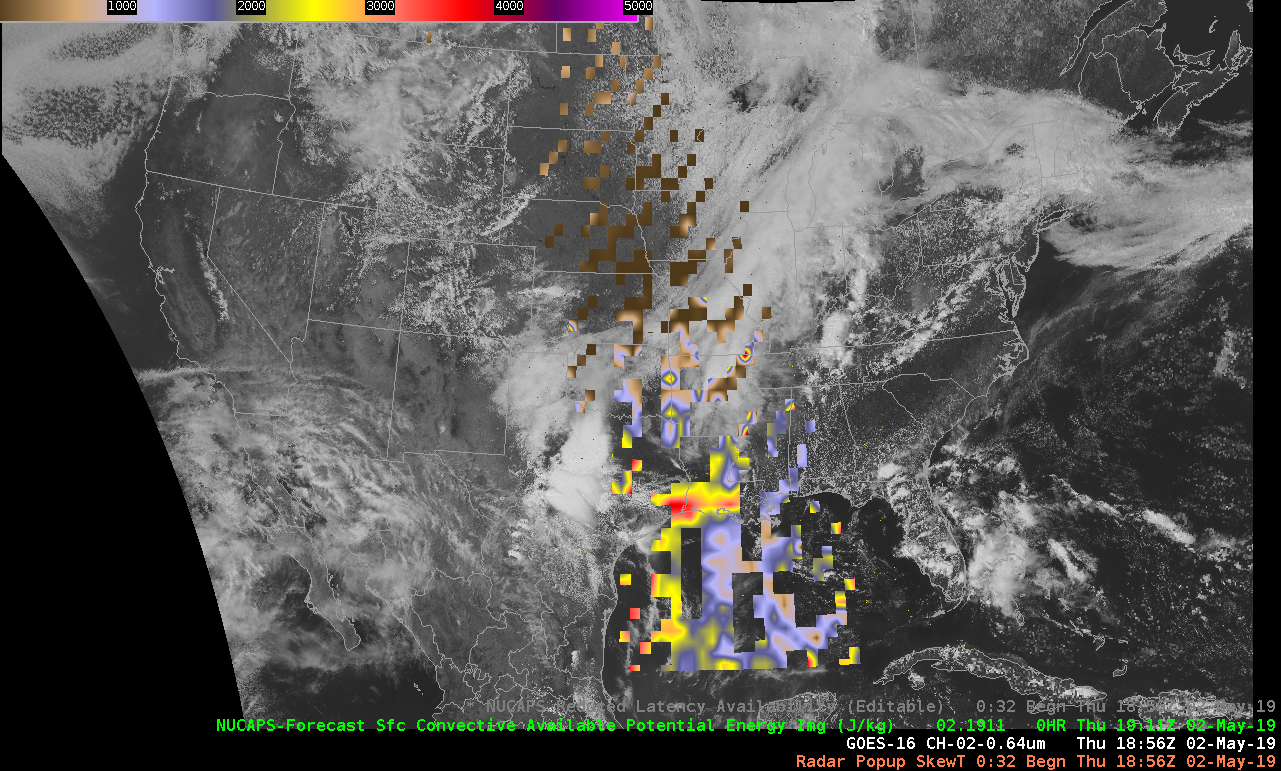
A great application would be some type of algorithm that fills in the “data holes” Two ways to approch this would be:

  1.  Linear interpolation between the grids
  2. Use a model such as the RAP to fill in the gaps
A quick attempt at a combined product with the NUCAPs Forecast and the RAP.

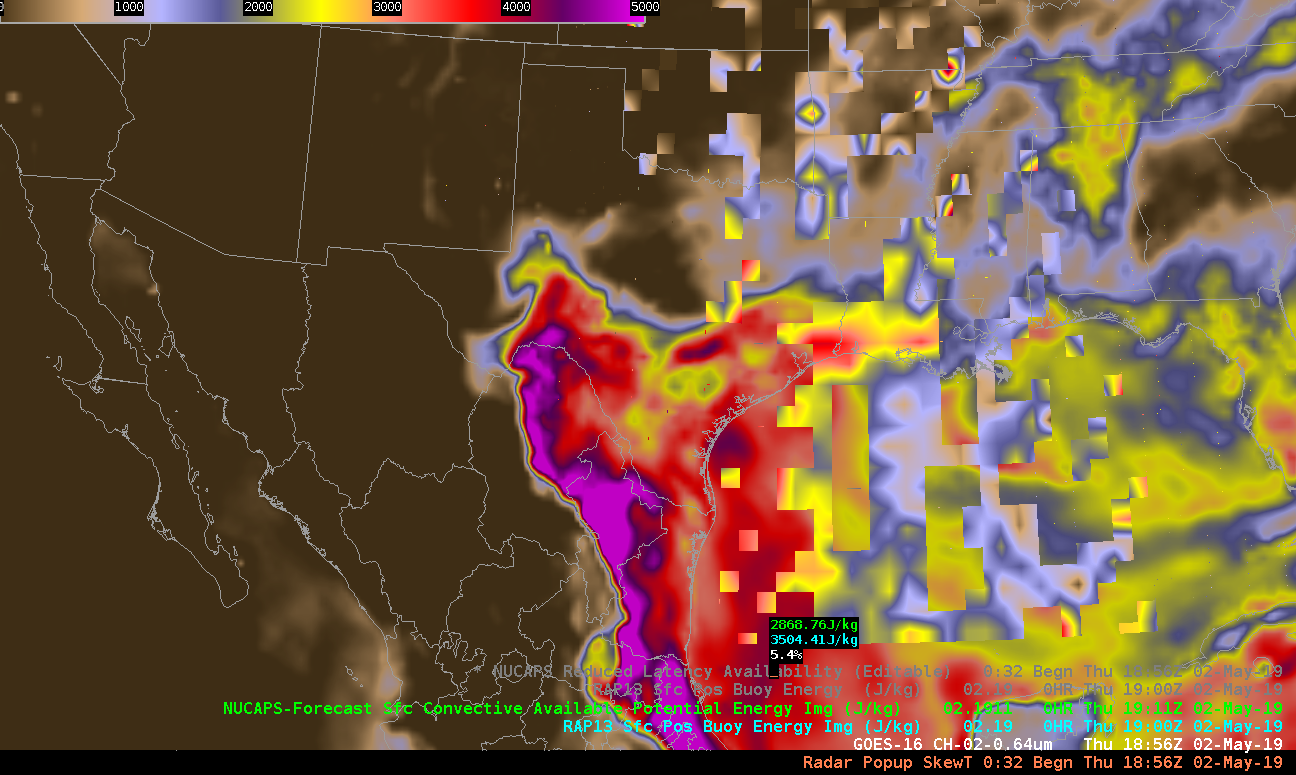
A smoothing of some sort would still benefit the product above, but this would be of great benefit to forecaster’s trying to determine the afternoon environment. (Note: I think it would be beneficial to include a mask that said whether the data was from NUCAPs or a model in each location if a product like this was developed. All in all, this is a useful product, but it needs some further refining.

South Beach

Del Dot CAPE in NUCAPS Forecast

NUCAPS forecast product unrealistically advects the CAPE east through the evening. In reality the CAPE axis extends along and east of the Rio Grande and will likely stay in place but slowly modify toward sunset. Also it might improve the product to interpolate or fill in the gaps with a model (actually Jake’s comment) not mine.

— SCoulomb

NUCAPS Modified Sounding Compared to Surface Obs

NUCAPS gridded 700-500mb Lapse Rate and Modified sounding points.  Lapse rates are favorable for storm intensification across the southern part of FWS CWA.

NUCAPS Modified sounding had 72/69 (temp/dewpoint), compared to closest surface METAR KLHB 74/69 (temp/dewpoint).  This sounding data showed un-capped and unstable environment supportive of surface based convection in southern FWS CWA. -Jake Johnson

AZ Shear Final Thoughts

Ultimately, AZ Shear has a lot of potential value in warning operations. It is really good at highlighting areas that need immediate investigation. Notice in this case how AZ shear maxima are present along a segment of the the storm that has begun to bow. Additionally, it has highlighted an area of rotation along the QLCS. Within a warning environment, I could foresee it increasing lead time on warnings because your attention is gravitated immediately to specific areas of AZ shear maxima. One thing I think would be of great benefit is making some of the az shear values closer to zero transparent, so that it can be easily overlaid on velocity products. In this case, I would also recommend using a different color scale than red because it will end up blending in with the velocity data.

A weak bowing segment and velocity couplet highlighted by AZ Shear

South Beach

Mesoscale discussion using All Sky and SPC mesoanalysis page

Favorable 0-6km shear aloft from SPC Mesoanalysis page above across FWS CWA

All Sky Total PW above shows deeper moisture in southern FWS CWA.

High DCAPE values across the FWS area per SPC mesoanalysis page above


Mesoscale Discussion…40-50kts of wind shear aloft and high DCAPE values show conditions favorable for severe winds to occur, mainly for locations where  All Sky total PW shows strong moisture gradient along surface front in southern part of the CWA.

This is a loop of radar and All Sky LAP CAPE.  Notice the higher CAPE values in the southern part of the CWA. This is were linear convection could grow upscale become surface based and capable of produce damaging winds.  -Jake Johnson


The ProbSevere Wind spiked to 80% with a thunderstorm that later moved across southern FWS CWA, which was our area of concern.

All Sky Moisture Advection

All Sky Layer PW Surface-900mb                                               All Sky 900-700mb layered PW

700mb analysis from SPC Mesoanalysis, shows good warm air advection across Dallas/Forth Worth CWA.  The All Sky 900-700mb layered PW product shows good west to east moisture gradient across the central part of the CWA associated with the 700mb warm air advection signal.  -Jake Johnson

GLM comparison for Line of thunderstorms

A linear storm was moving east across western FWS CWA producing 1″ size hail.  Look at the cursor location, GLM Flash Extent Density and Event Density products were highlighting the most intense part of the storm better the GLM TOE product.  The GLM Total Optical Energy is preferred for initial storm development.  When thunderstorms become mature its best to use the GLM Flash Extent Density or GLM Event Density product to compare storms in the mature phase.  -Jake Johnson

Azimuthal Shear Application to Velocity Couplet?

An application of AZ-Shear that may show some promise is that it seems to hint at storms/areas which may develop into a velocity couplet. In this example you can see that high Azimuthal Shear values are beginning to be detected by the program, while very little response stand out in the velocity field.

Using Az-Shear to hint at the development of a couplet. (Watch the small red marker near the Alabama-Georgia border.)

Notice how a few minutes later a velocity couplet is beginning to form, when only a few minutes prior AZ Shear was the only indicator. If this becomes is a trend that develops, it might be able to increase warning times on tornadoes.

A few minutes later a velocity couplet is beginning to take shape

South Beach