Single-Radar AzShear demonstrates superior performance on variety of thunderstorm modes

The single-radar AzShear product shows demonstrable improvement over MRMS Merged AzShear. The spatial detail of the best circulations is much better than that of MergedAzShear, which introduces spatial discontinuity and broader areas of interest. The AzShear color table, in particular, is exceptional in highlighting developing areas of rotation along with locations of convergence along bowing segments. In the example below, you can see the rotation signatures from several discrete supercells, an embedded supercell along the line, and a couple areas of convergence associated with the QLCS. For each of these cases, the AzShear performs well and gives a representative view of the severity associated with each circulation. -Atlanta Braves

Lightning observed but no GLM

ProbSevere gives every indication of a severe storm over Morton County, ND (see ProbSevere read out below).  The Earth Networks lightning suggests there of 52 fl/min but GLM FED gives 0 fl, TOE 0 fJ, and AFA 0 km^2.  The two depictions below show those three GLM fields with the MRMS 1 km reflectivity.  Perhaps there is an issue with viewing angle at this northern latitude. – Jonathan Wynn Smith (ESSIC/UMD)

ProbHail: 93%; ProbWind: 95%; ProbTor: 5%
– MESH: 1.83 in.
– VIL Density: 3.20 g/m^3
– ENI Flash Rate: 52 fl/min
– ENI Flash Density (max in last 30 min): 0.89 fl/min/km^2
– Max LLAzShear: 0.007 /s
– 98% LLAzShear: 0.006 /s
– 98% MLAzShear: 0.008 /s
– Norm. vert. growth rate: 2101Z 1.3%/min (weak)
– EBShear: 38.0 kts; SRH 0-1km AGL: 155 m^2/s^2
– MUCAPE: 2925 J/kg; MLCAPE: 1657 J/kg; MLCIN: -36 J/kg
– MeanWind 1-3kmAGL: 26.4 kts
– Wetbulb 0C hgt: 9.0 kft AGL
– CAPE -10C to -30C: 546 J/kg; PWAT: 1.3 in.
GLM: max FED: 0 fl; sum FCD: 0 fl/5-min
GLM: max TOE: 0 fJ; avg AFA: 0 km^2
Avg. beam height (ARL): 1.28 kft / 0.39 km
Object ID: 273531
PS: 98

Merged AzShear Vs. AzShear oh my

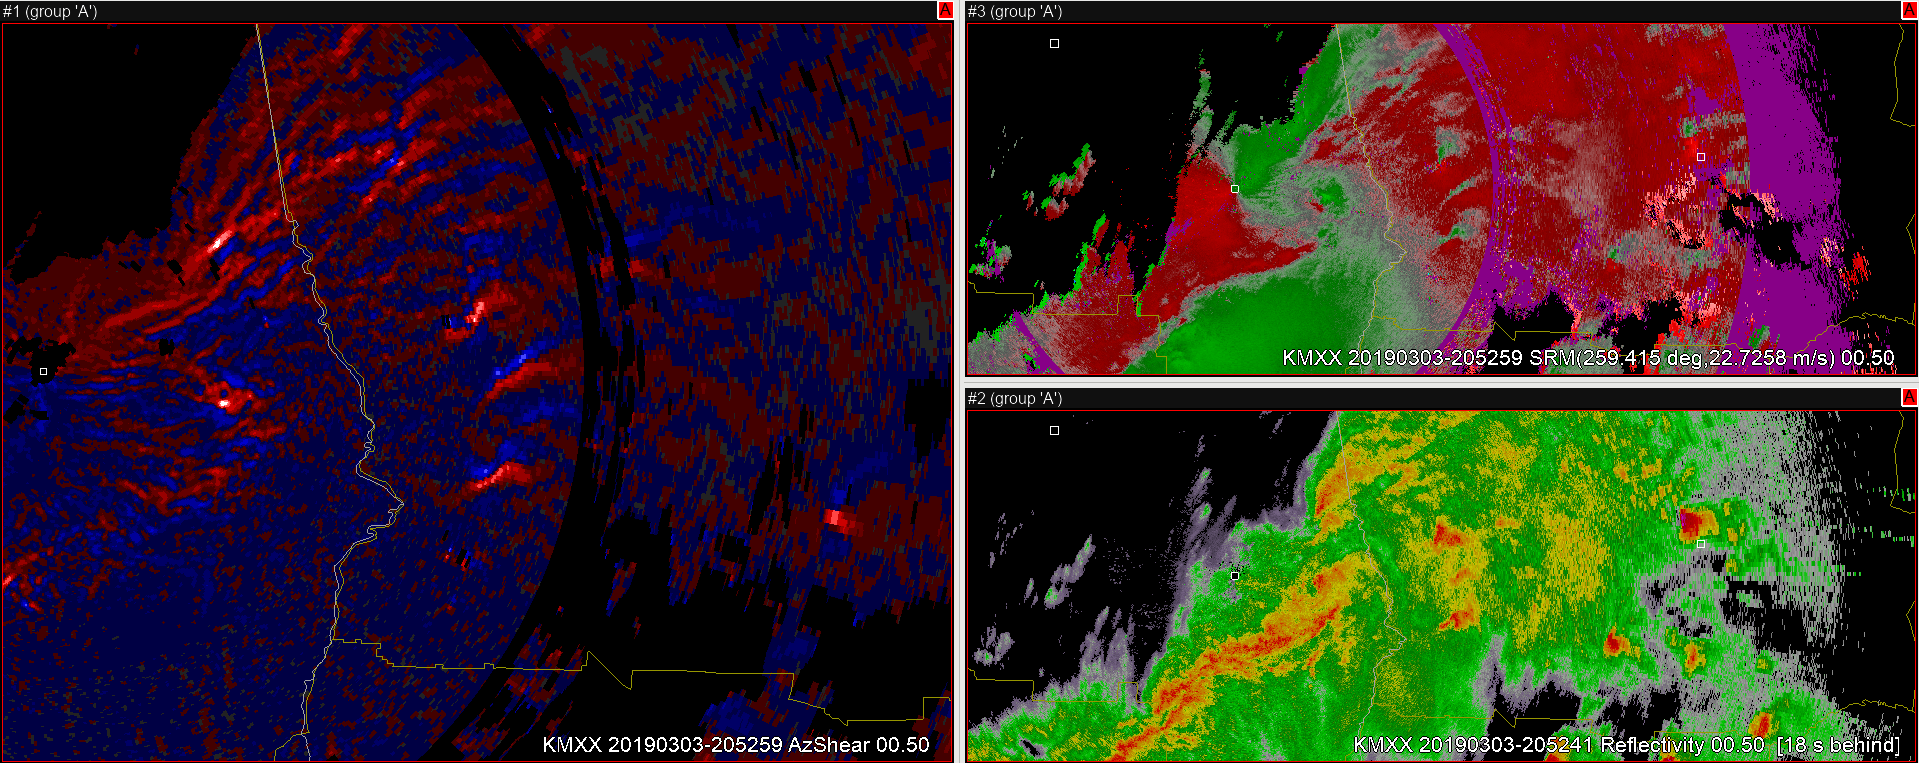
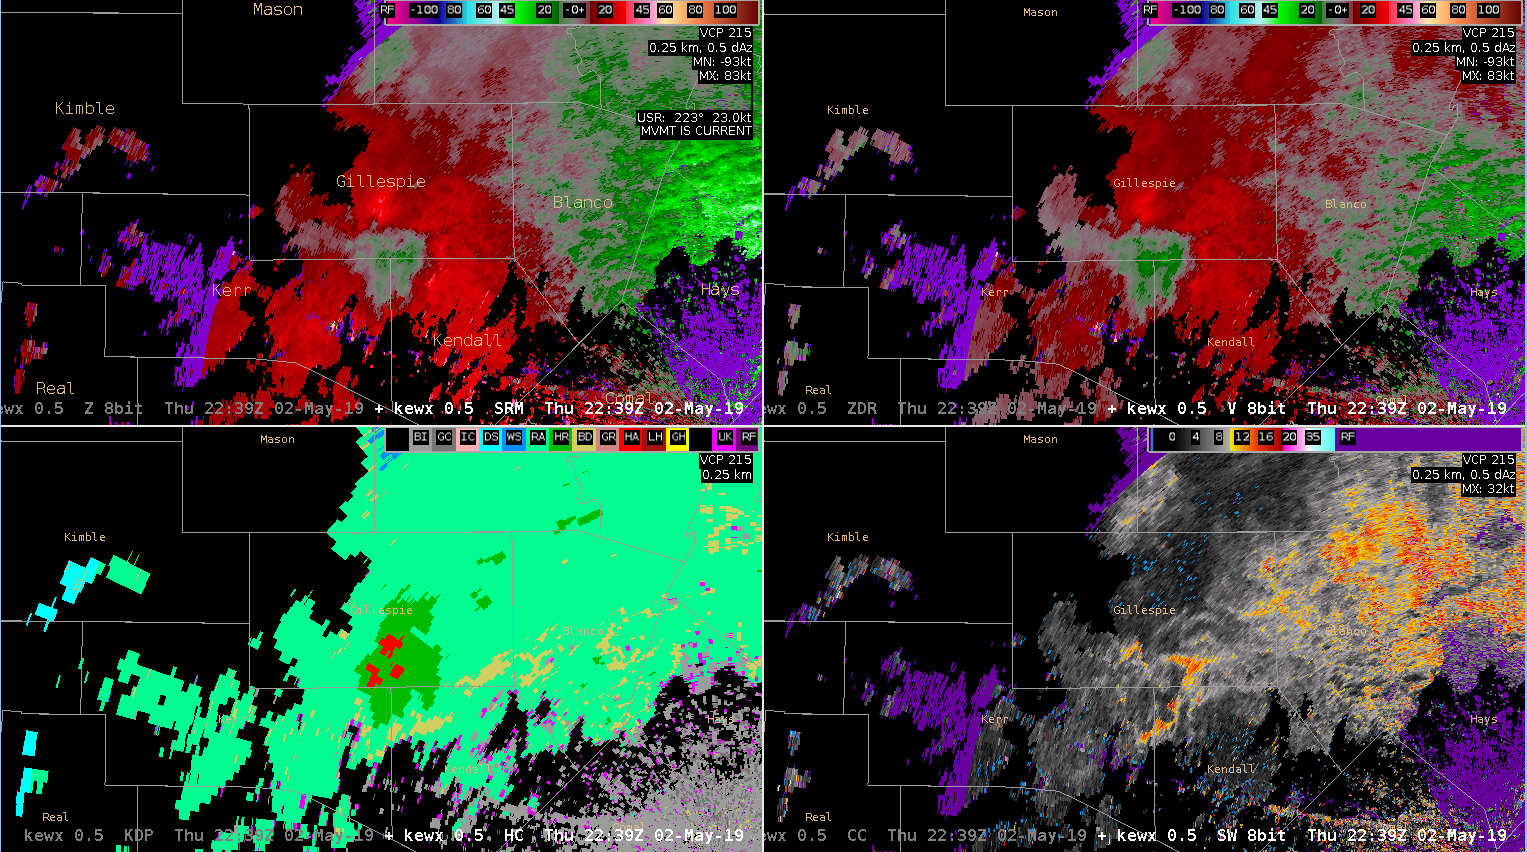
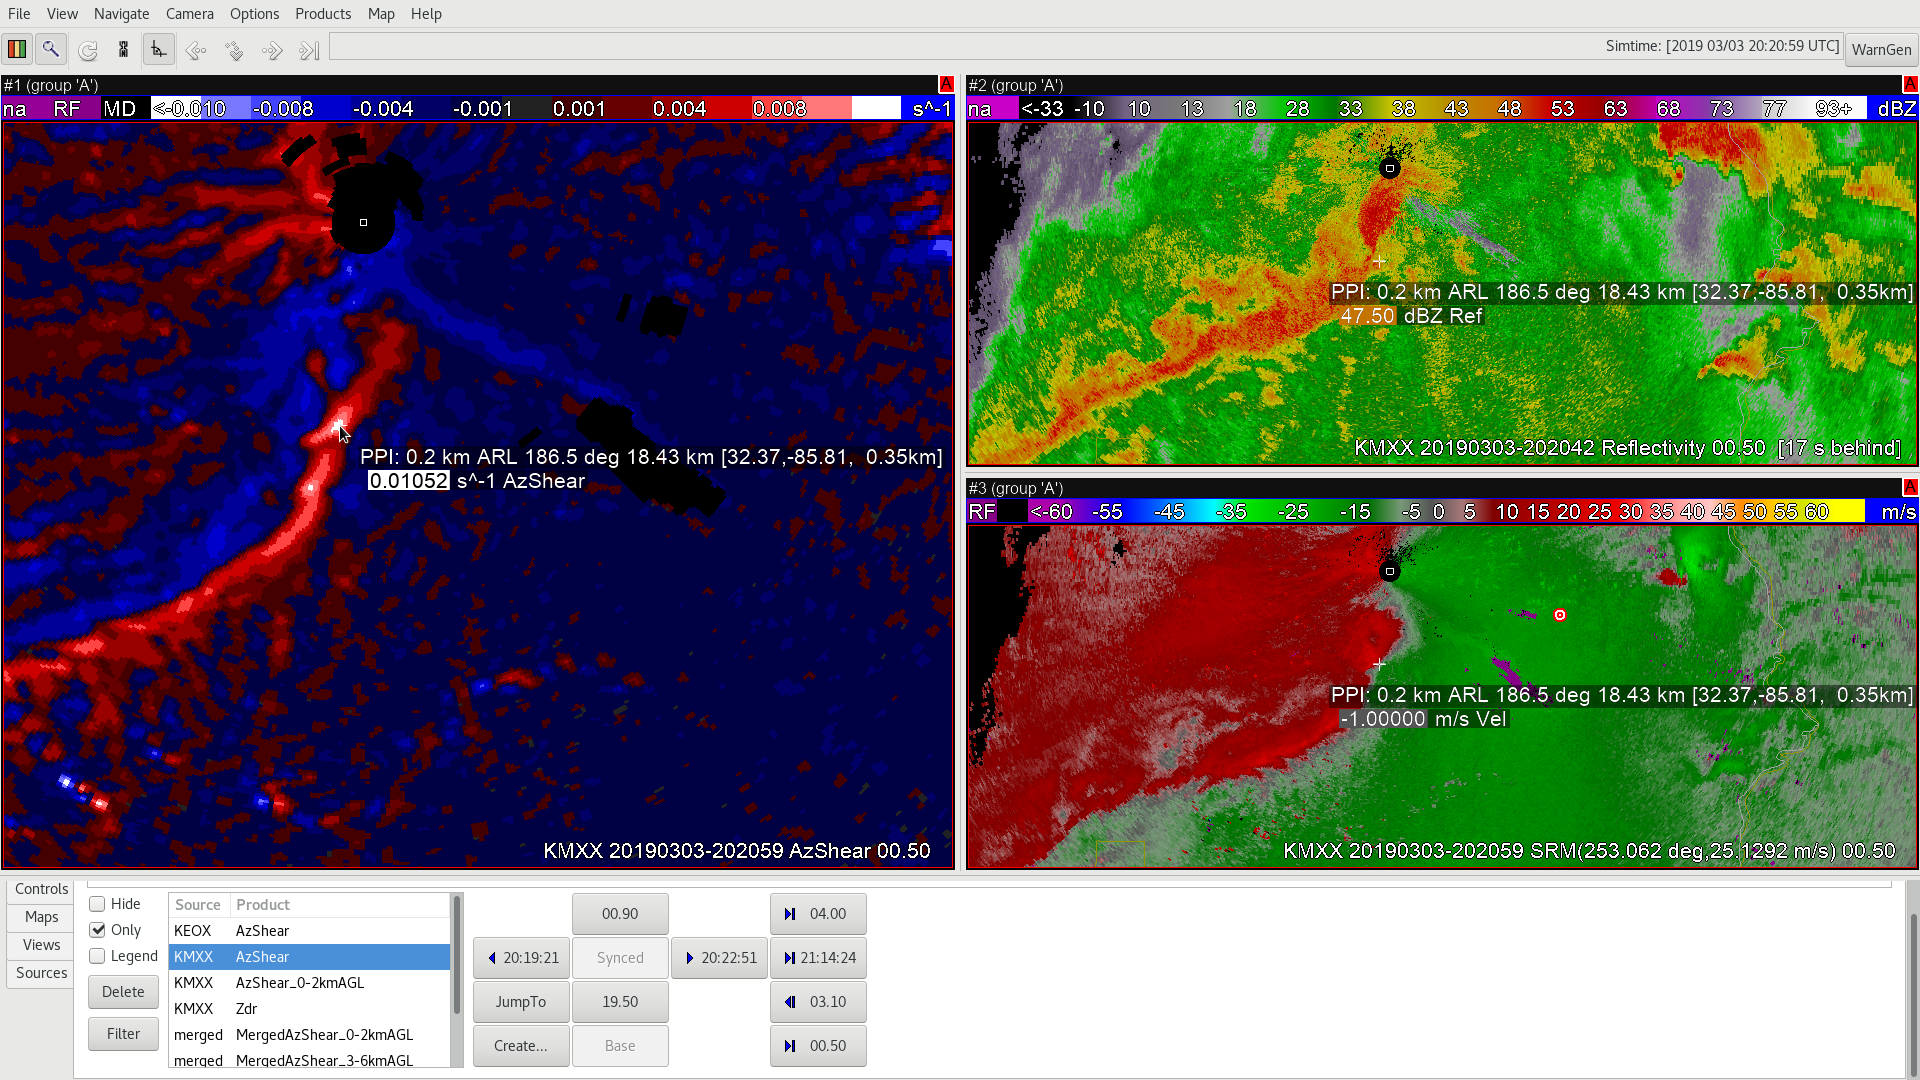
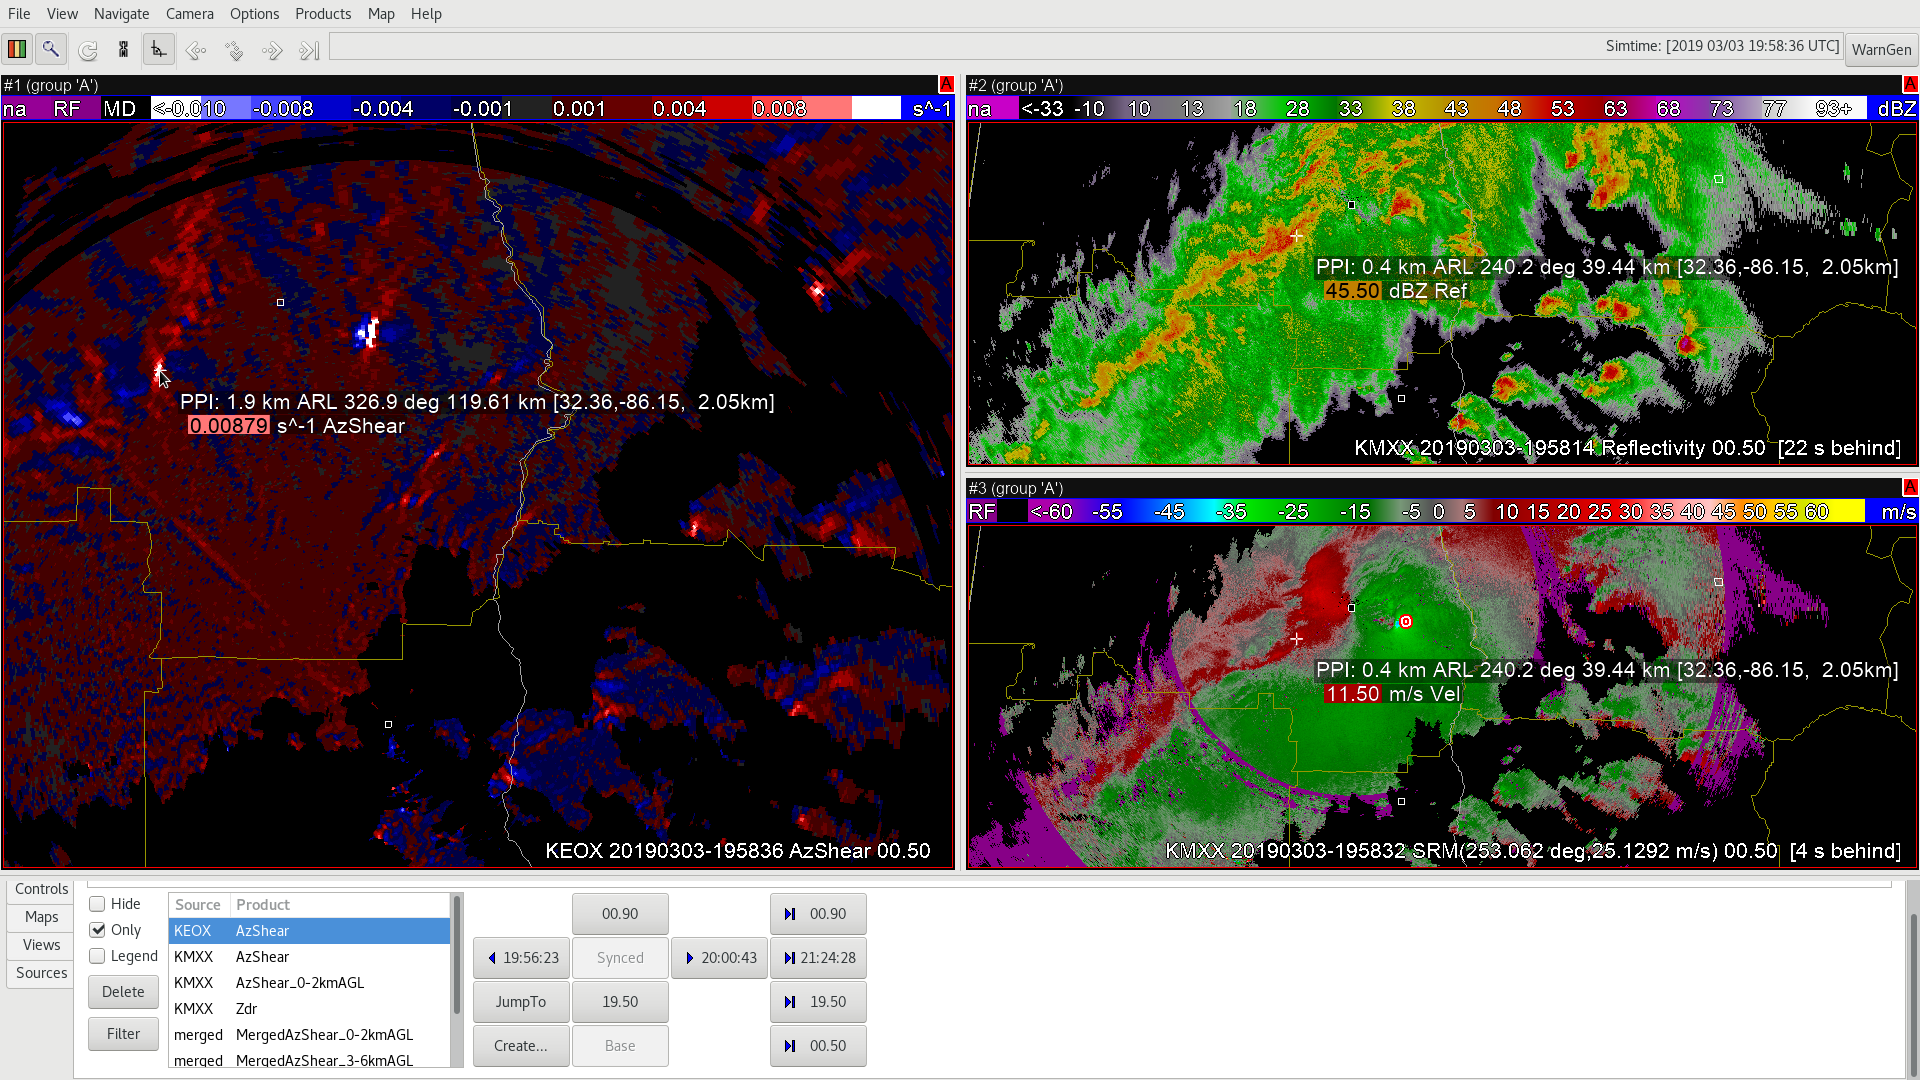
The first feature I noticed at first glance of all of the AzShear products was the “time lag” so-to-speak of the merged AzShear products. More specifically, I compared the velocity couplet with the AzShear product and the merged 0-2km AzShear product. The merged product shows a disconnected and smeared/cluttered version of the max shear couplet region, making it difficult to find exactly which high value center you would like to focus on.

Above is an example of those three products with my mouse over the circulation center for reference. In particular, I grabbed the 0.9deg radar tilt to get the middle of the averaged layer (~1km AGL).   Because of this multi-maximum issue in the merged product, I find the main AzShear product more useful and trustworthy than the merged product with this particular case.

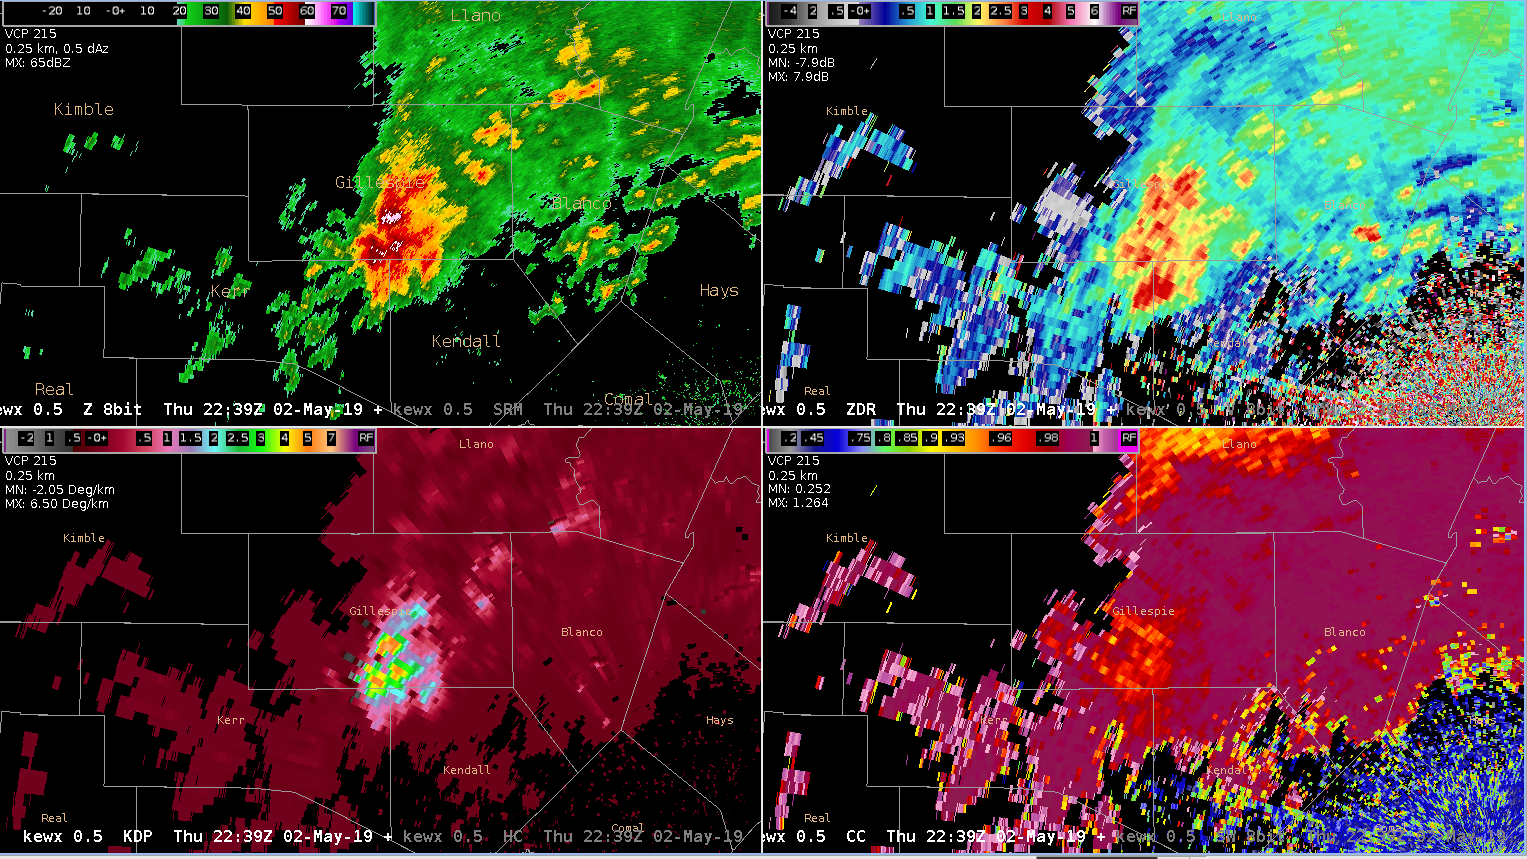
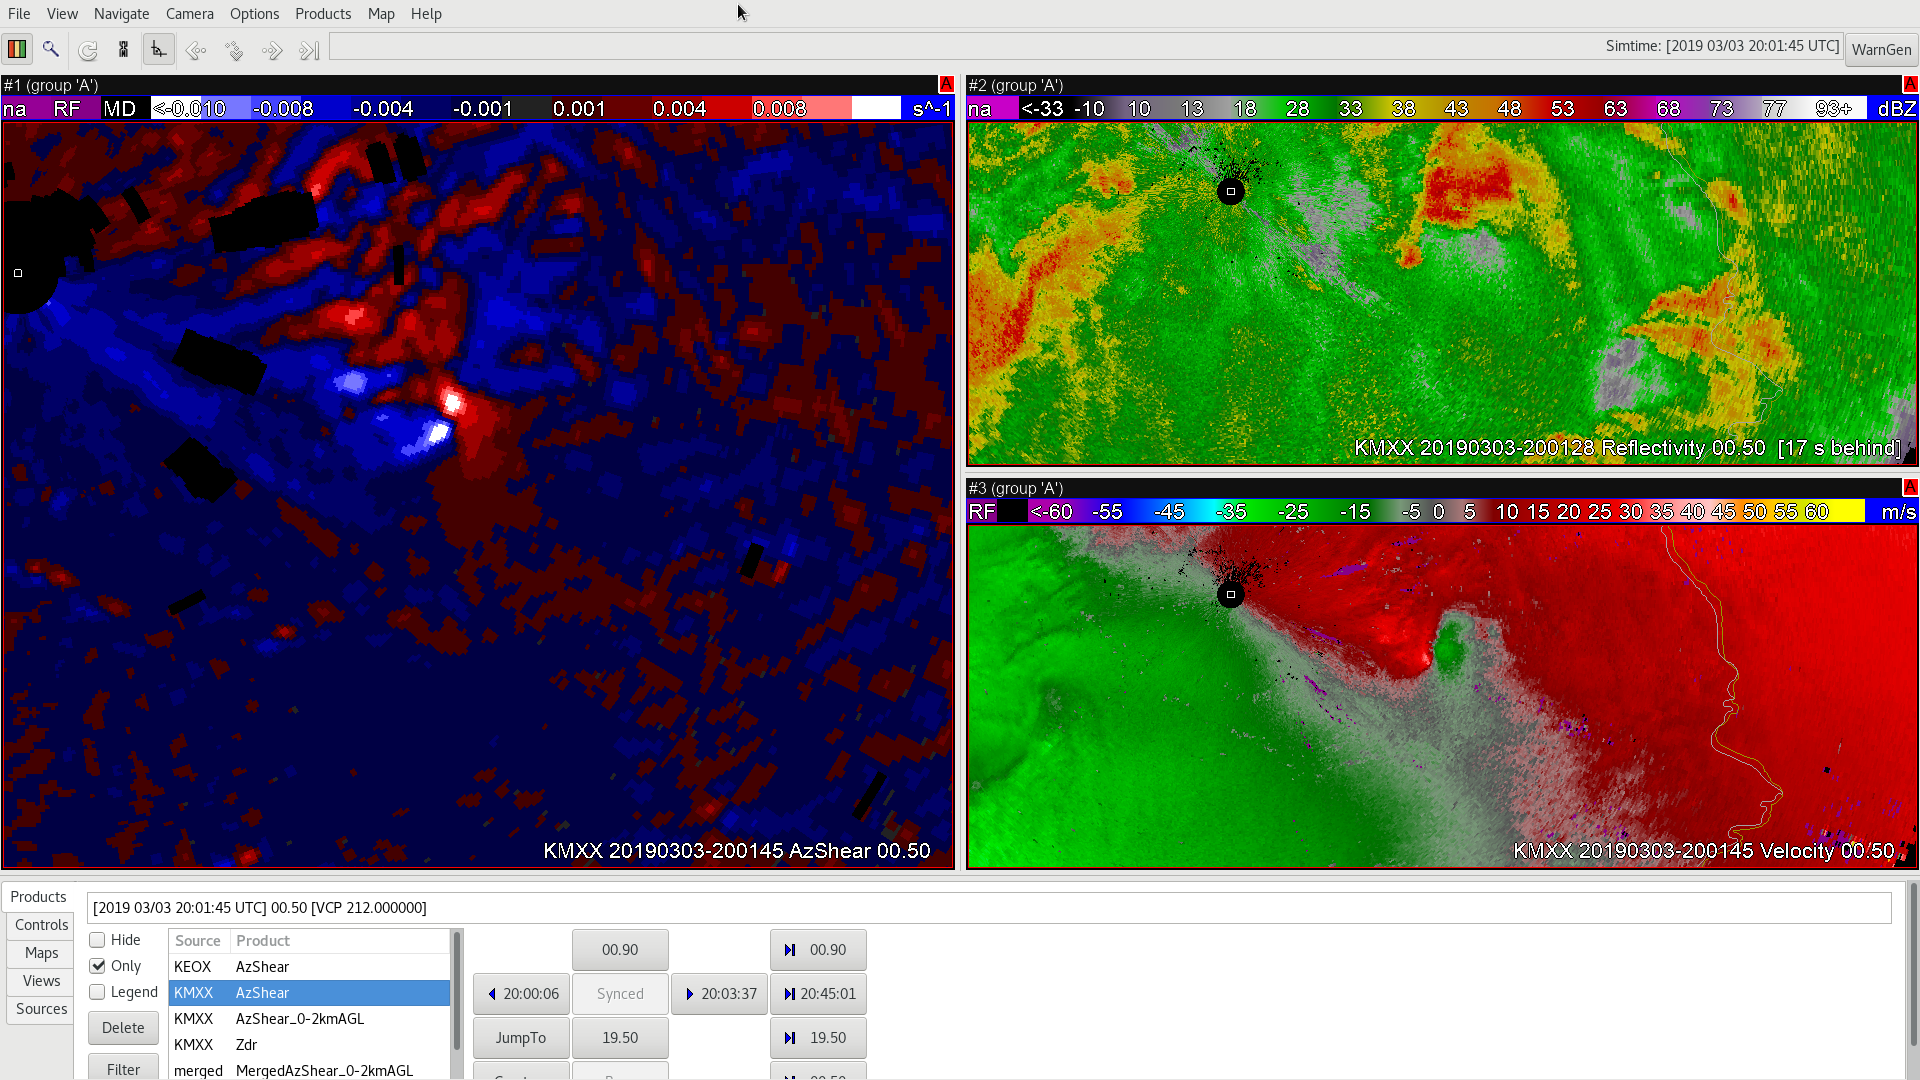
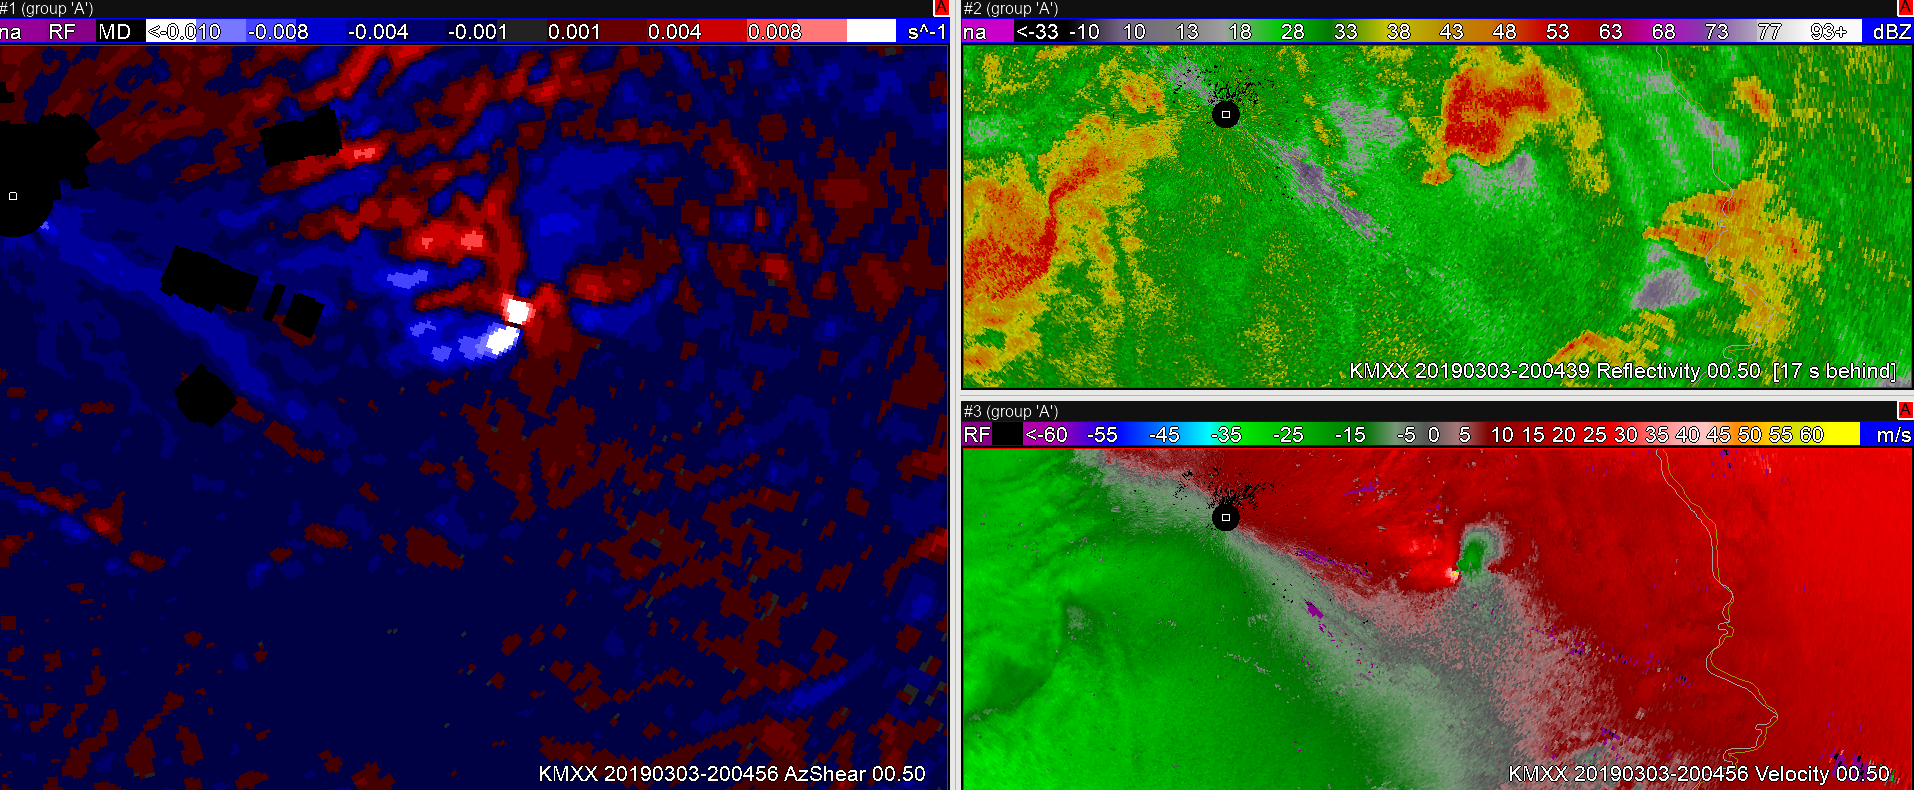
In addition, I was able to pick up a “debris ball” signature at a similar time. I noticed the low CC was spatially ahead of both of the AzShear product maximum couplets. This tells me to not solely rely on a one product as the main location of greatest shear or tornadic location, just because there will be a slight spatial lag between products (more noticeable in the merged product) . This also makes it clear in making sure to continue to utilize velocity data (as is well known with debris ball signatures).  Image below:

This debris ball signature was notable at both the 0.5deg tilt and the 0.9deg tilt, so I kept the 0.9deg screen for consistency.

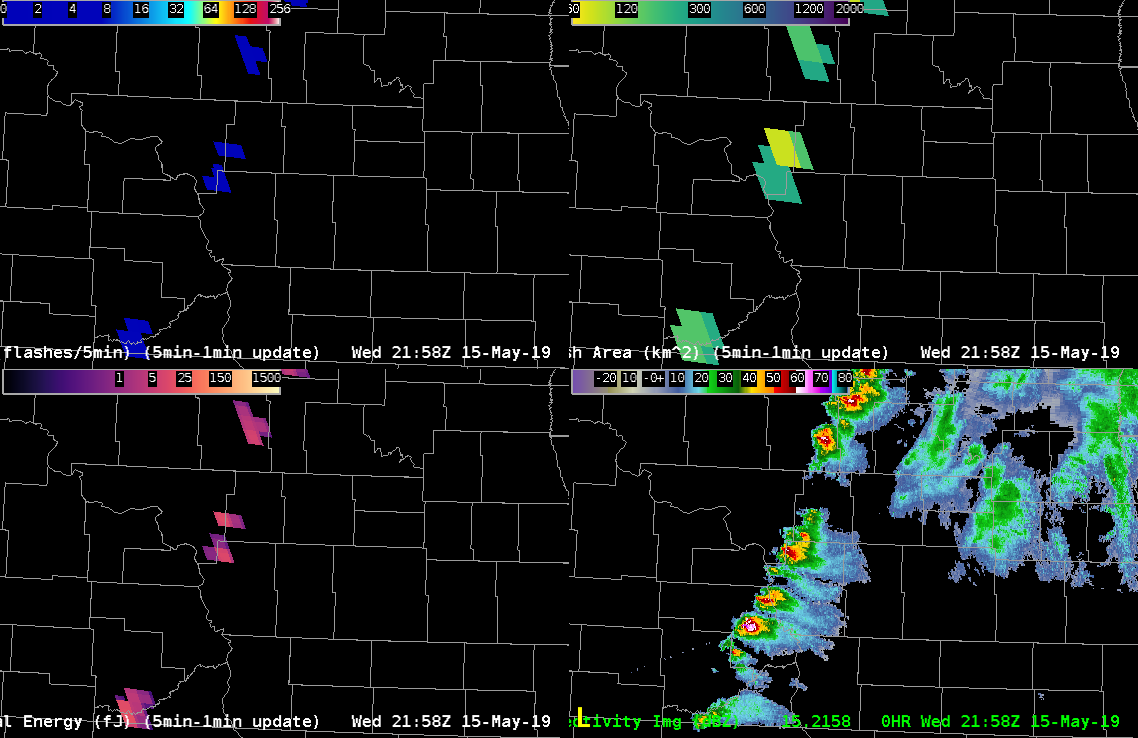
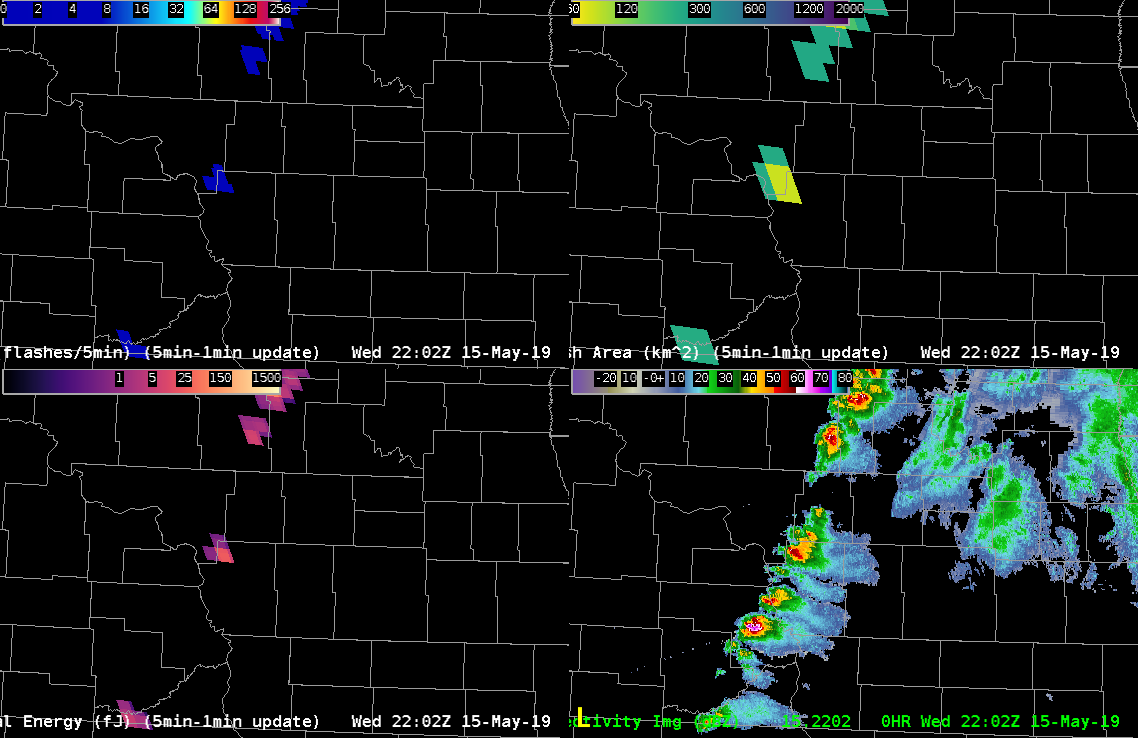
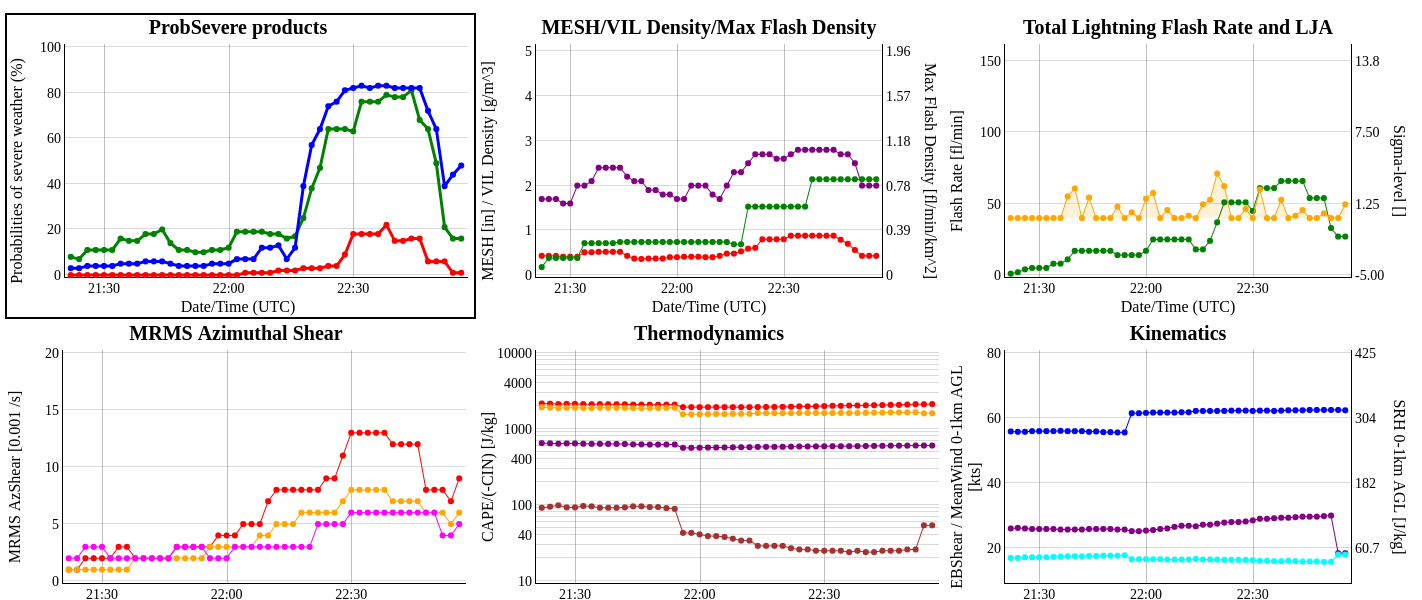
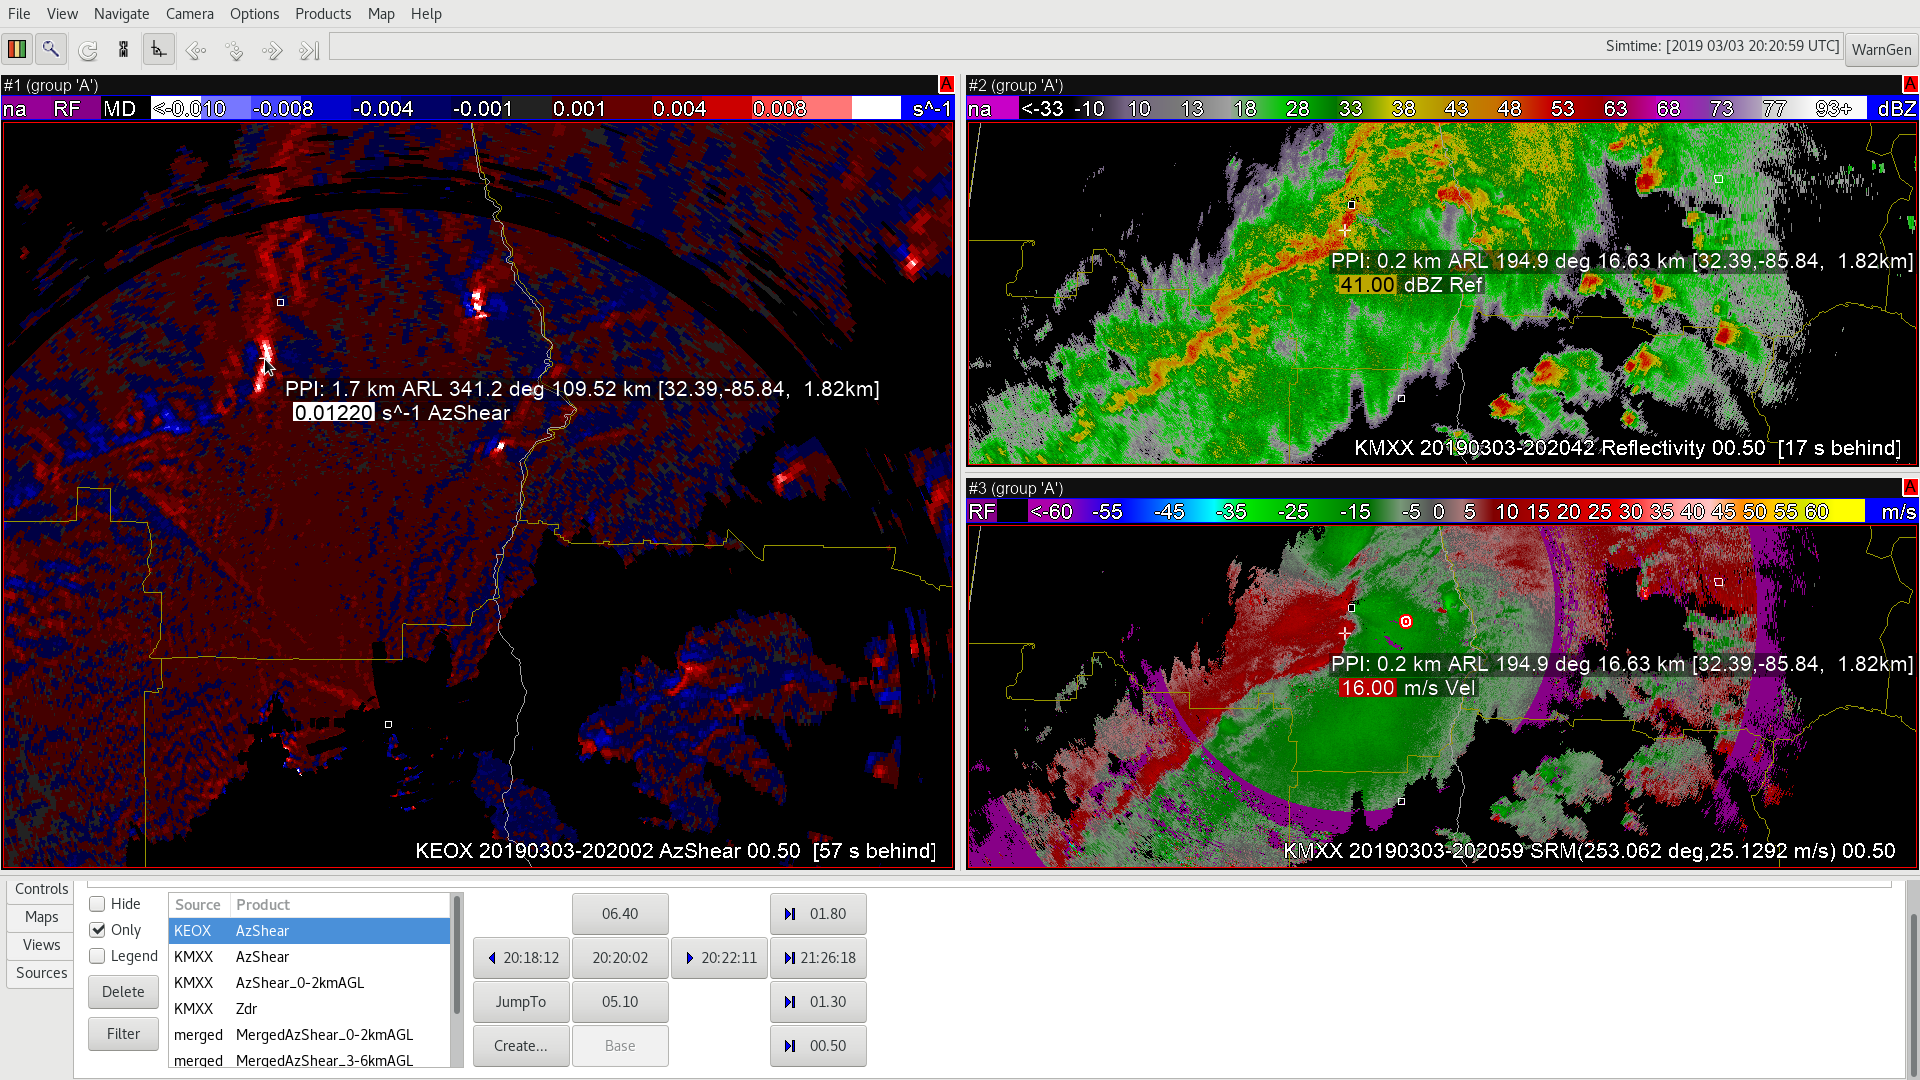
Lastly, I noticed the strength of the AzShear couplets began ramping up and showing maximum values in prior temporal radar scans to the debris ball signature, which is to be expected. I would be more concerned if it was the other way around. Having all of these signatures in place further verifies the strength of the system.


Good non-severe storm with agreement from radar/satellite products

One storm became near severe around 545 pm in EWX CWA. All parameters; lightning, ProbSevere and Dual-pol radar agreed on the evolution of the storm and expected impacts. Radar data suggested there to be equal wind and hail threat based on high ZDR and KDP within the core suggesting sub-severe hail. There was some notching in the back side of the storm’s reflectivity as the front end of the storm surged eastward suggesting some wind threat. Lightning over this time had increase from 10 fl/min to 20 fl/min about 15-20 minutes prior to the development of some weak mid level rotation. As the storm cycled and weakened, so did the lightning and ProbSevere values. An uptick in GLM event density was followed by a slight increase in ProbSevere values toward the end of the loop.

KEWX 4-panel – Refl (UL), ZDR (UR), KDP (LL), CC (LR)

KEWX 4-panel – SRM (UL), V (UR), HC (LL), SW (LR)

GLM sequence of Gillespie County storm – 1-min(FED)(UL),AFA(UR),TOE(LL),EventDensity(LR)

ProbSevere time trends from http://cimss.ssec.wisc.edu/severe_conv/plots/PSplots.php?ID=176047

— SCoulomb

Lightning Event Density As A Proxy For Storm Intensity

Lightning Event Density was mirroring the storm near point F for a fair amount of time. Notice how the prob severe graph almost directly correlates to the product. When Flash Event Density decreased, the Prob Severe decreased as well. Greater Flash Event Density seems to correlate to storm intensity.

Lightning Event Density Before Storm Weakens (Point F)
Lightning Event Density After Storm Weakens (Point F)
Trend-line for the storm…notice the drop-off that occurs when the flash event density decreases.

South Beach

Viewing angle from different radars using AZ_shear is important

The top image shows two discrete supercells in the center of the image.  Meanwhile the middle image is from KMXX radar which shows weak/harder to identify AZ_shear circulations for the two supercells.  Bottom image is AZ_shear from KEOX that has a different viewing angle that shows much more pronounced AZ_shear circulations.  A Best practice…for using the AZ_shear single radar product is for forecasters to use multiple radars for better situational awareness since some radars might not show that strong of a signature compared to others due to different viewing angles. -Jake Johnson


All-Sky PWAT

The AllSkyLAP PWAT compared fairly well with surface conditions and the merged product however it struggled in the wake of the front/dryline and was too generous with the PWAT values when compared to earlier UA obs. Values in the warm sector were more representative (higher) than the merged product.

— SCoulomb

Archive Event – AzShear

The two images above…KMXX 0-2km AZ product had a bright spot before the velocity couplet developed later on the leading edge of the QLCS which is a helpful pro-active approach to watch this area for possible QLCS tornadic development. -Jake Johnson

Two images above…KEOX radar had a different viewing angle compared to KMXX and it actually showed a brightness in the AZ_shear product way before KMXX.  Its best to look at multiple single radars and look for developing AZ_shear circulations for better situational awareness. – Jake Johnson

Merged-TPW compared to Sfc obs

The merged-TPW product compared well to the surface obs with 1) the strong gradient along the dryline 2) the lower PWAT values behind the MCS and 3) axis of greater PWAT along the immediate Gulf Coast. Actual values however were too high in the dry air (MAF/DFW) and too low in the moist air (DRT/CRP). Values compared to 12Z soundings at BRO the best.

— SCoulomb

AZ_Shear from KMXX shows developing circulation

Figure A

Figure B

AZ_Sheer product from KMXX shows developing shear circulation at max values in same location of zero iso-dop on velocity product at 2001Z in Figure A.  Then at 2004Z velocity product shows a developed couplet while AZ_shear remains maxed out but grows in size.  The AZ_shear in Figure A had the shear couplets further apart that became closer together in Figure B which is also the same time the velocity couplet first developed. -Jake Johnson