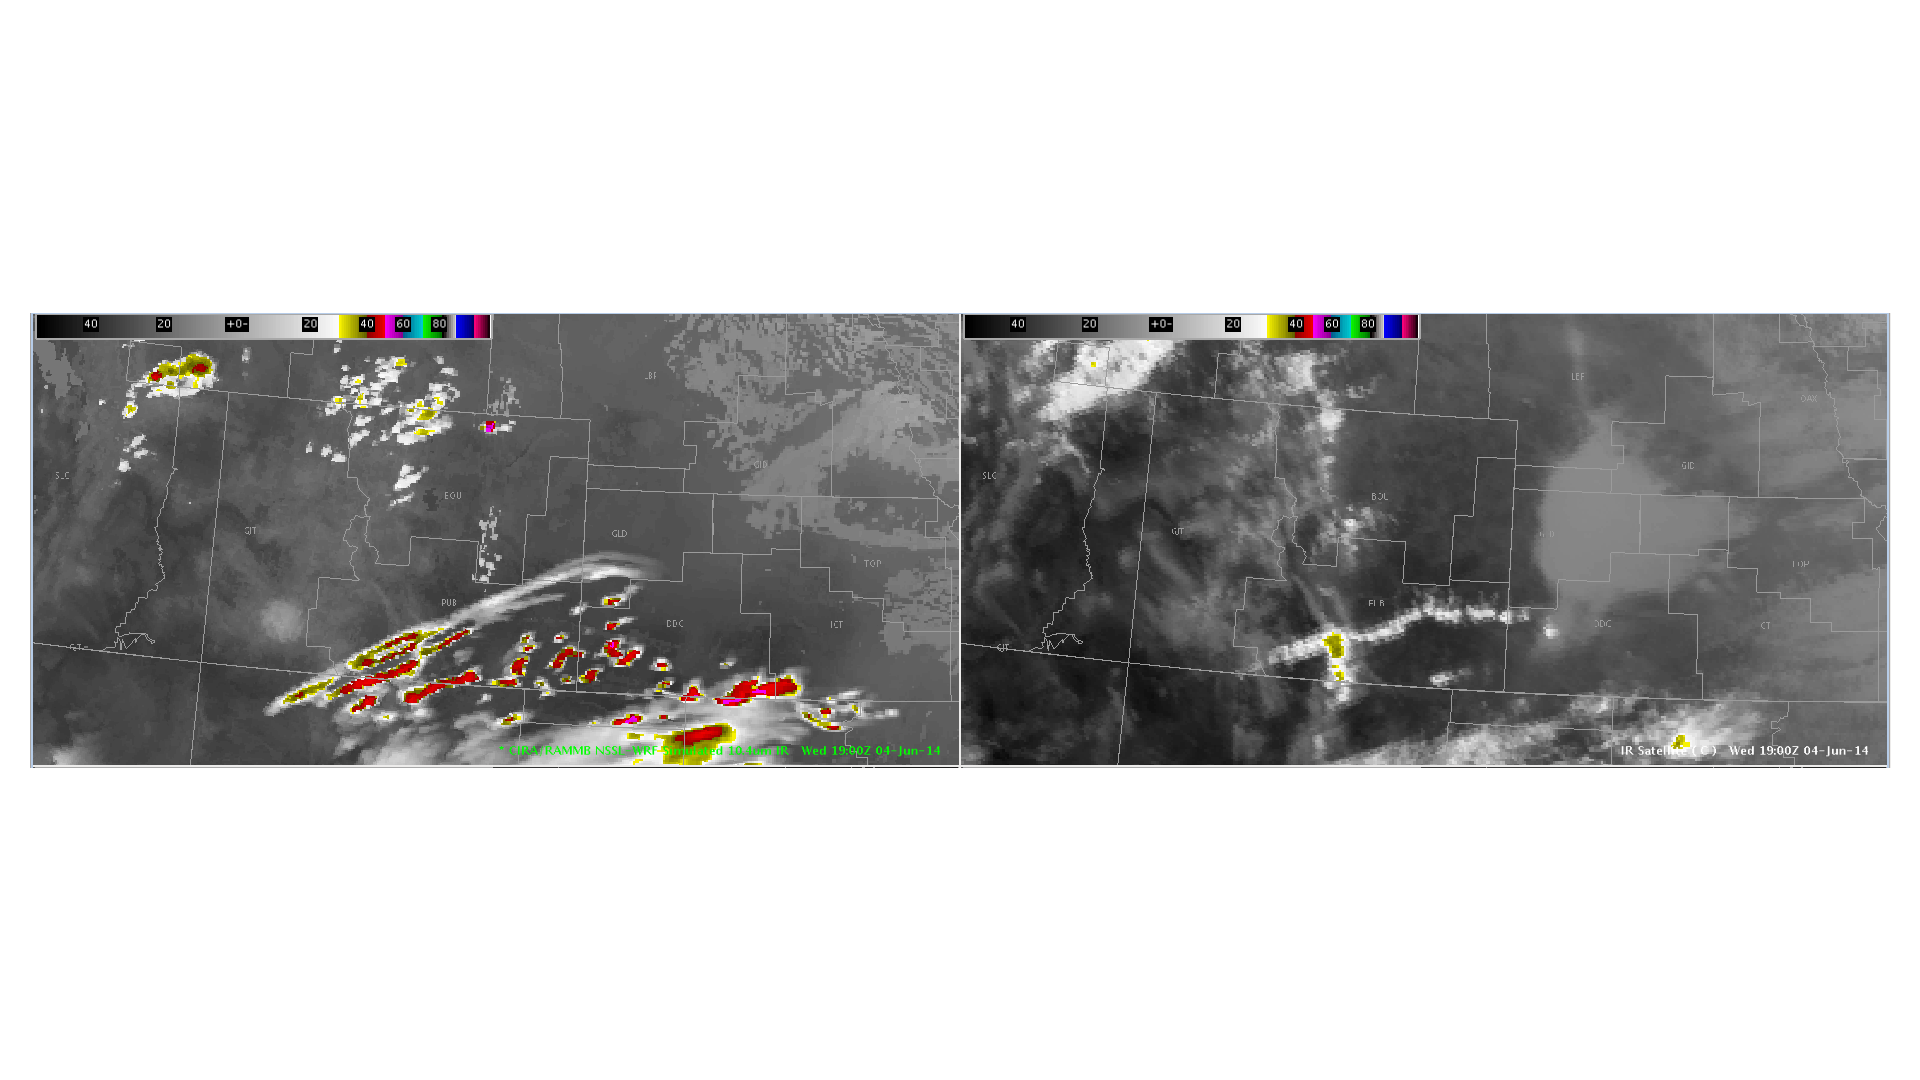
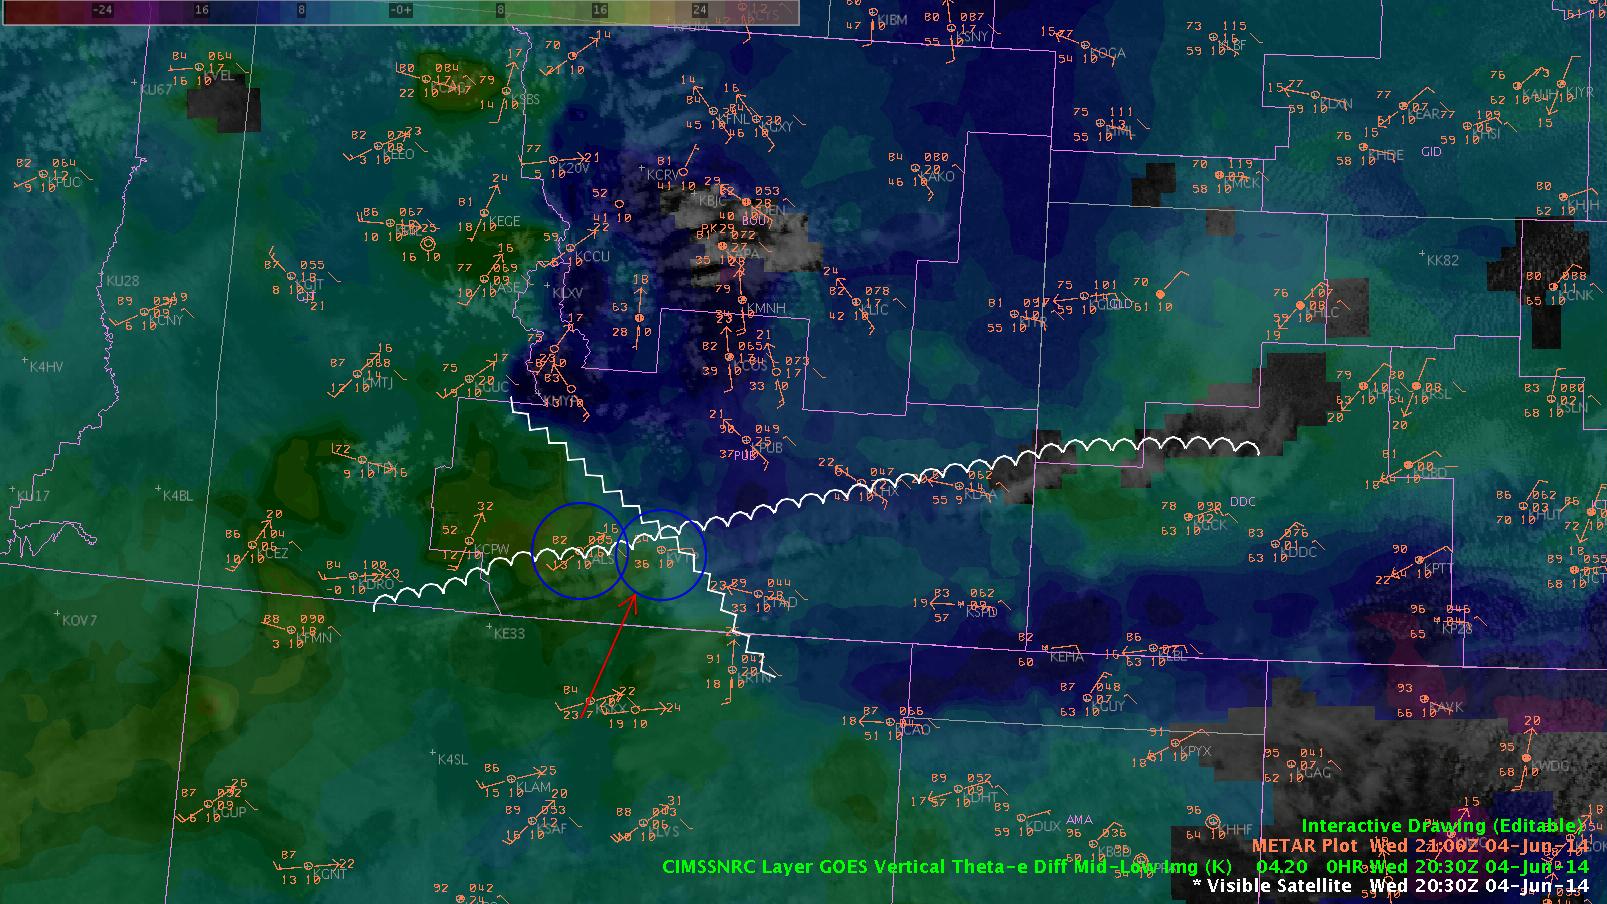
Theta difference and surface based cape analysis over central and North CO. We can see a well defined theta e diff boundary and this is collocated with a SB Cape boundary as well. Some small convection is developing along these boundaries. LMA seeing some very low numbers of CG on cell near CYS,
Theta E diff continues to be valuable in locating boundaries where convection will develop. Better than even using SB Cape by itself. Over the last few days convection seems to develop near these theta e diff boundaries.
D Satterfield
KP


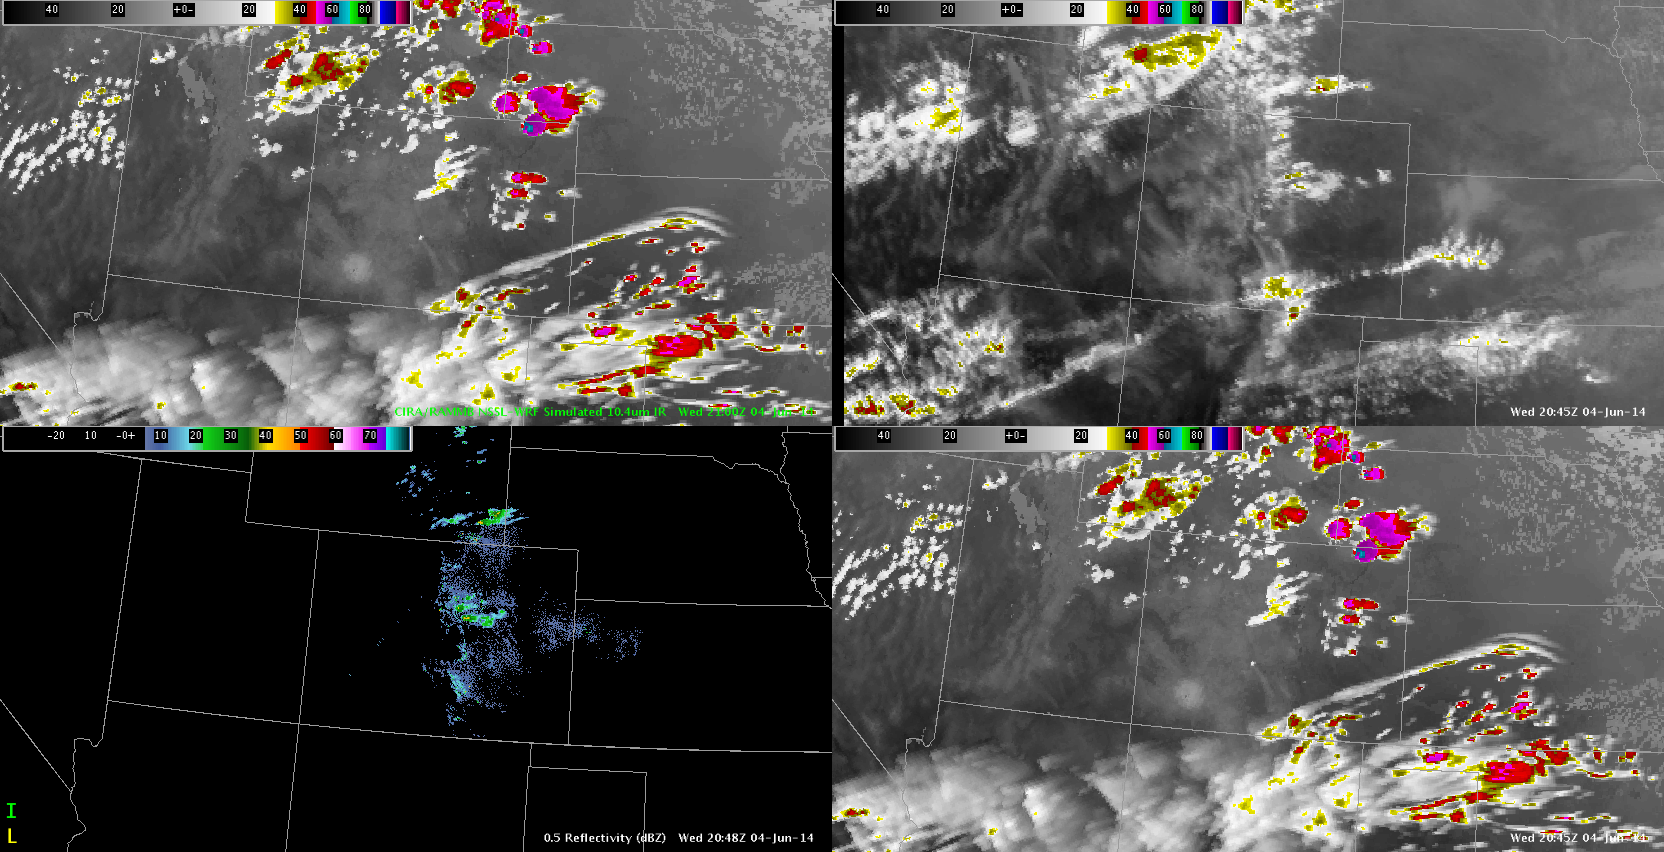
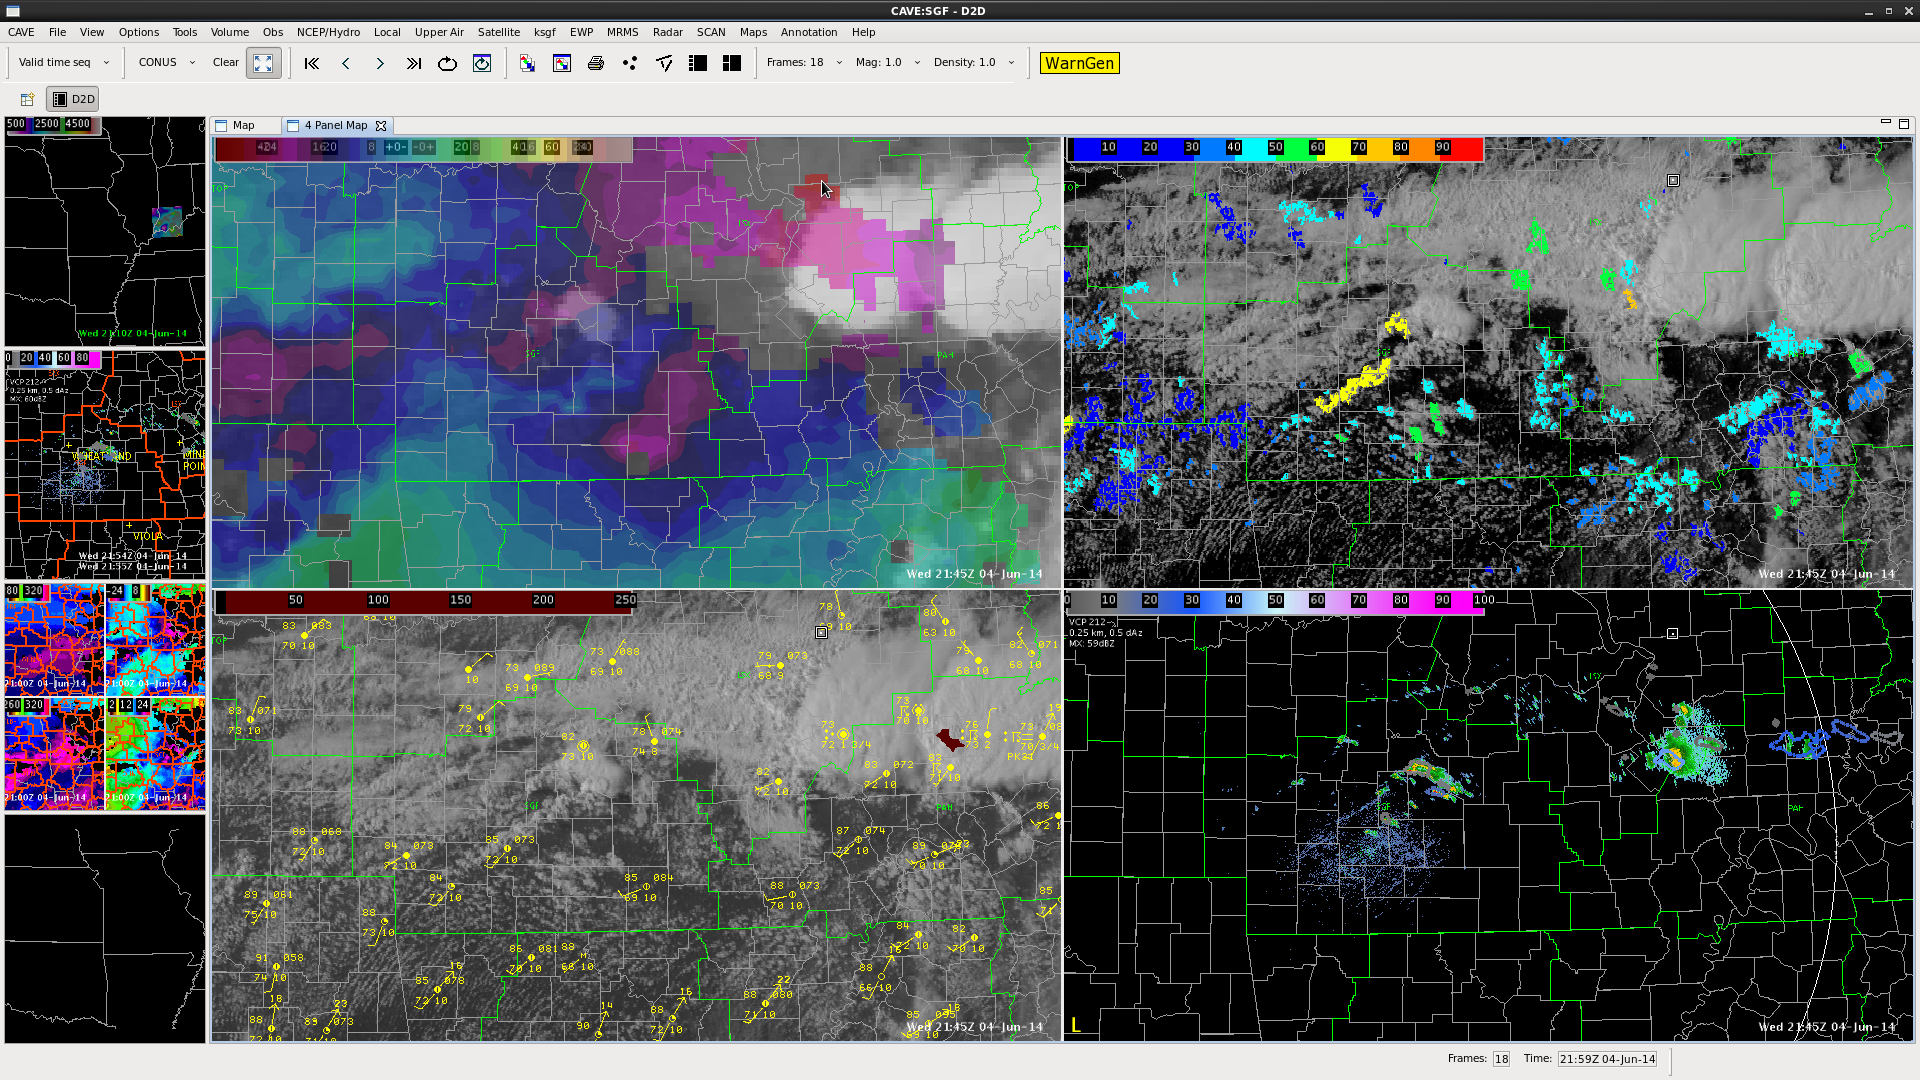 This 4 panel would be an ideal SA display for forecasters not only as convection is on-going (a non-radar operator) or as a nowcast tool. We are looking at theta-e difference, CI, sat with overshooting tops and sfc obs, and radar with prob severe.
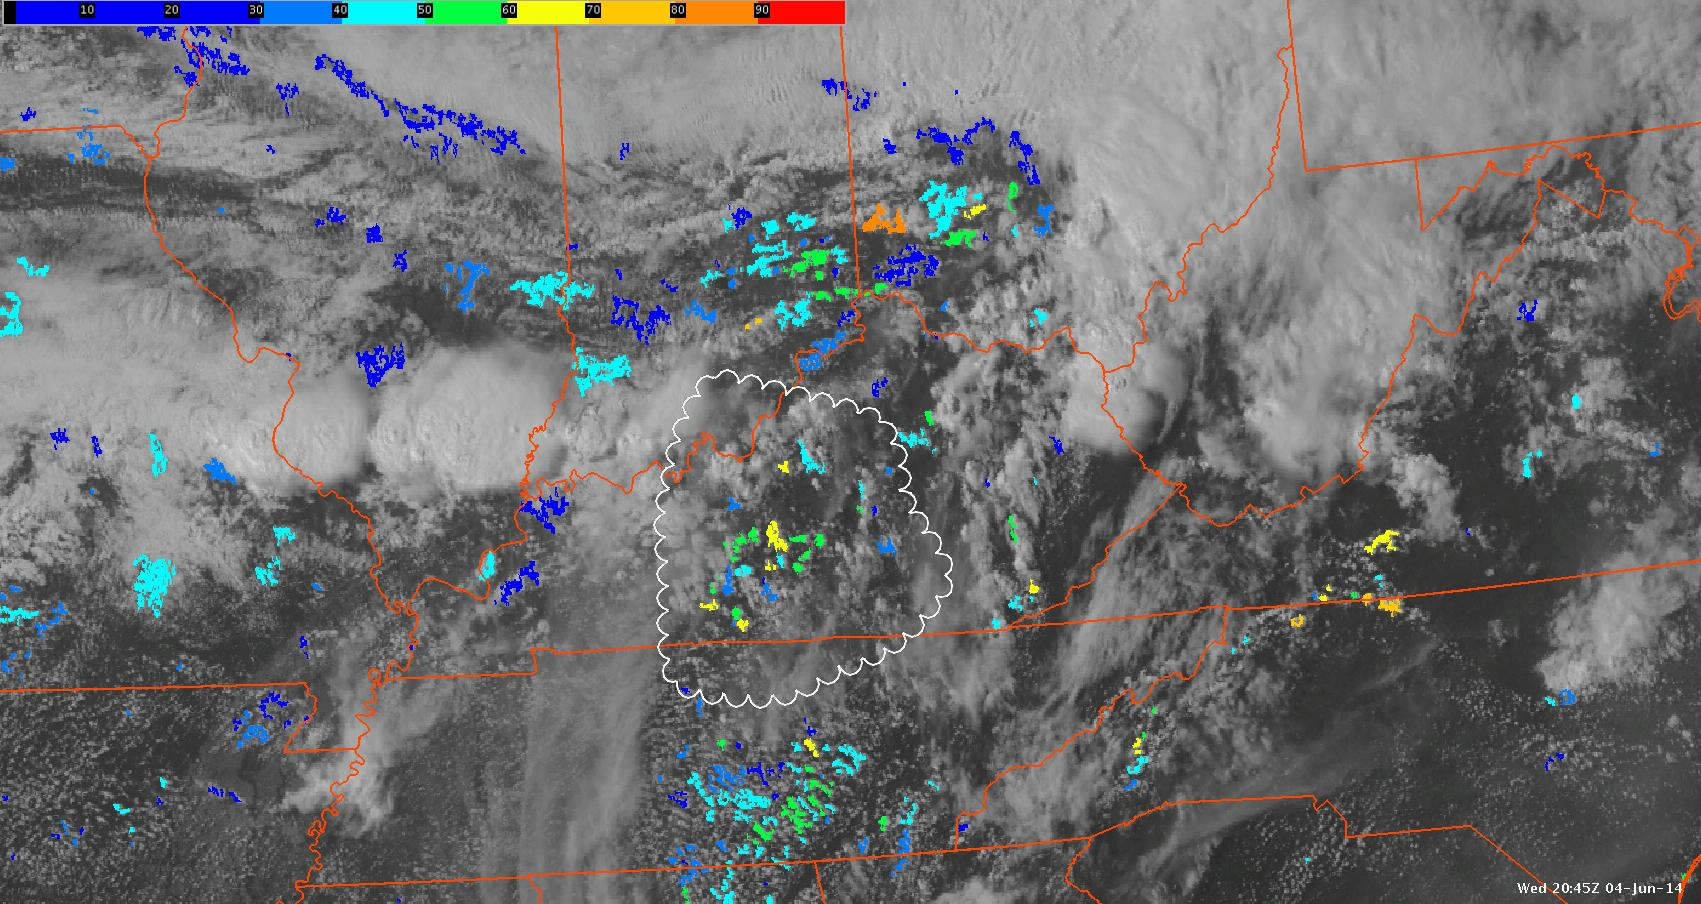
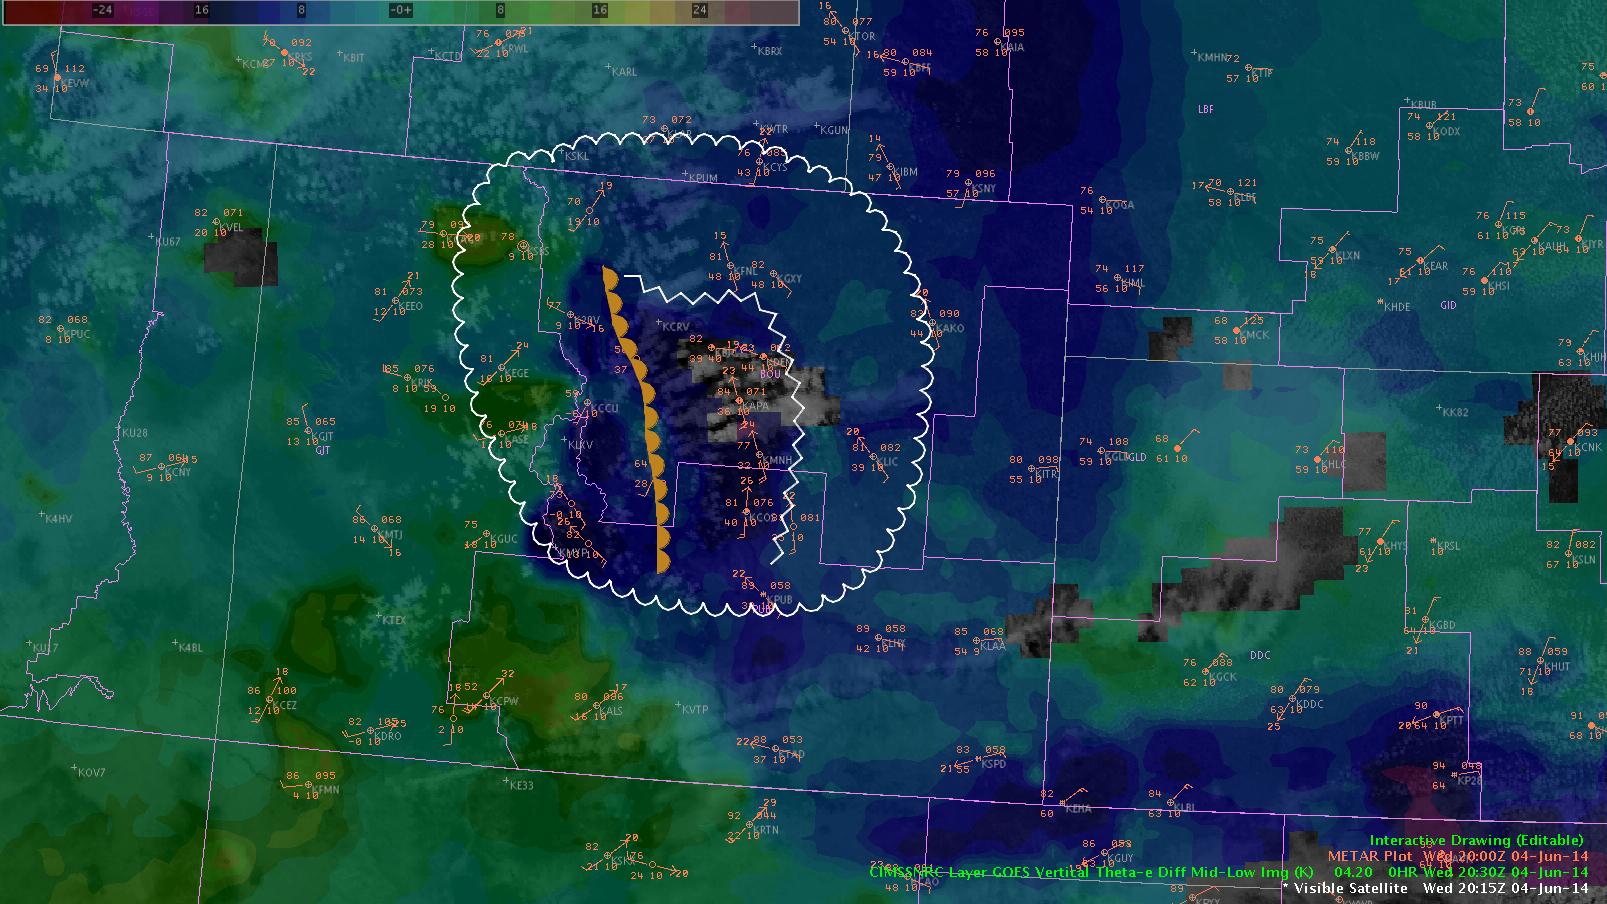
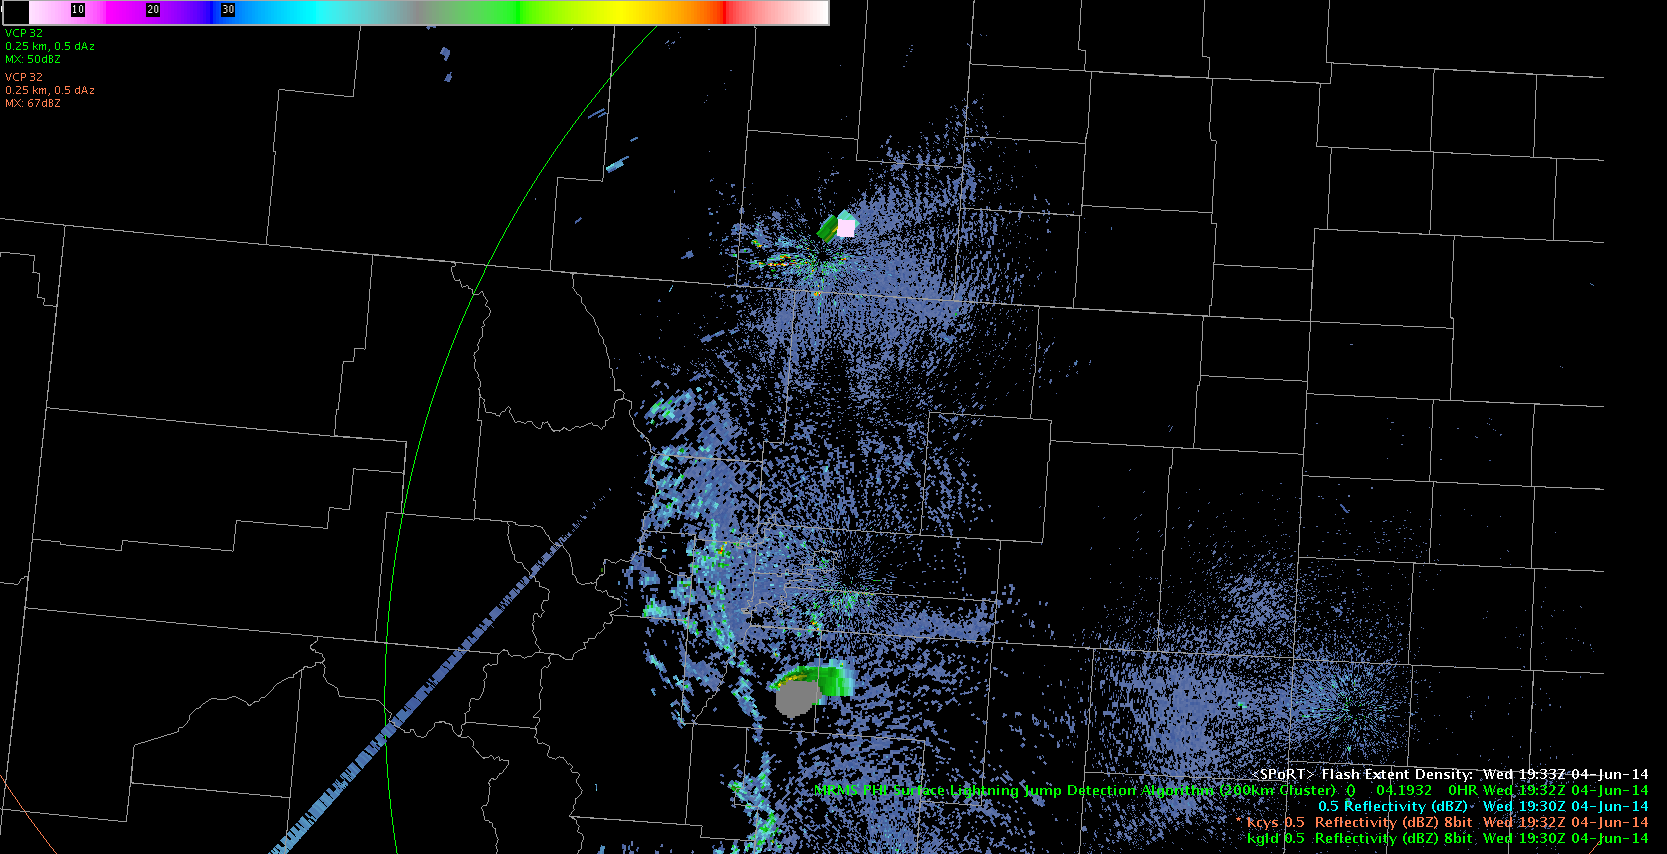
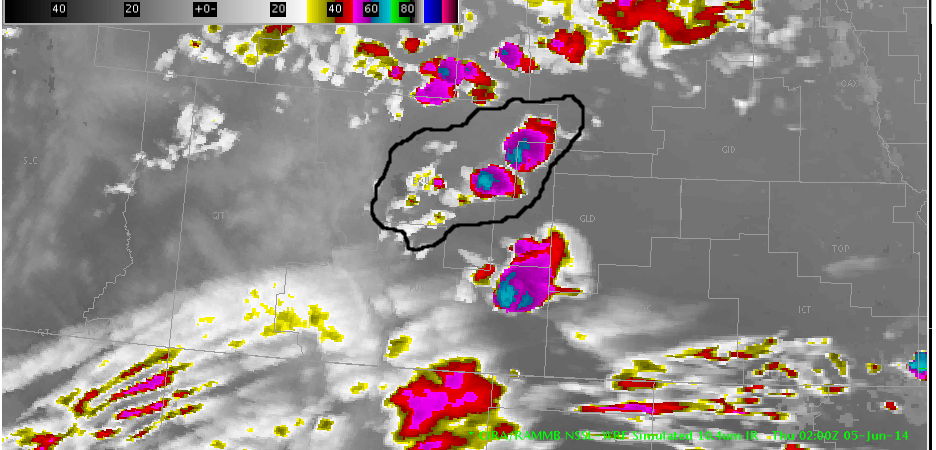
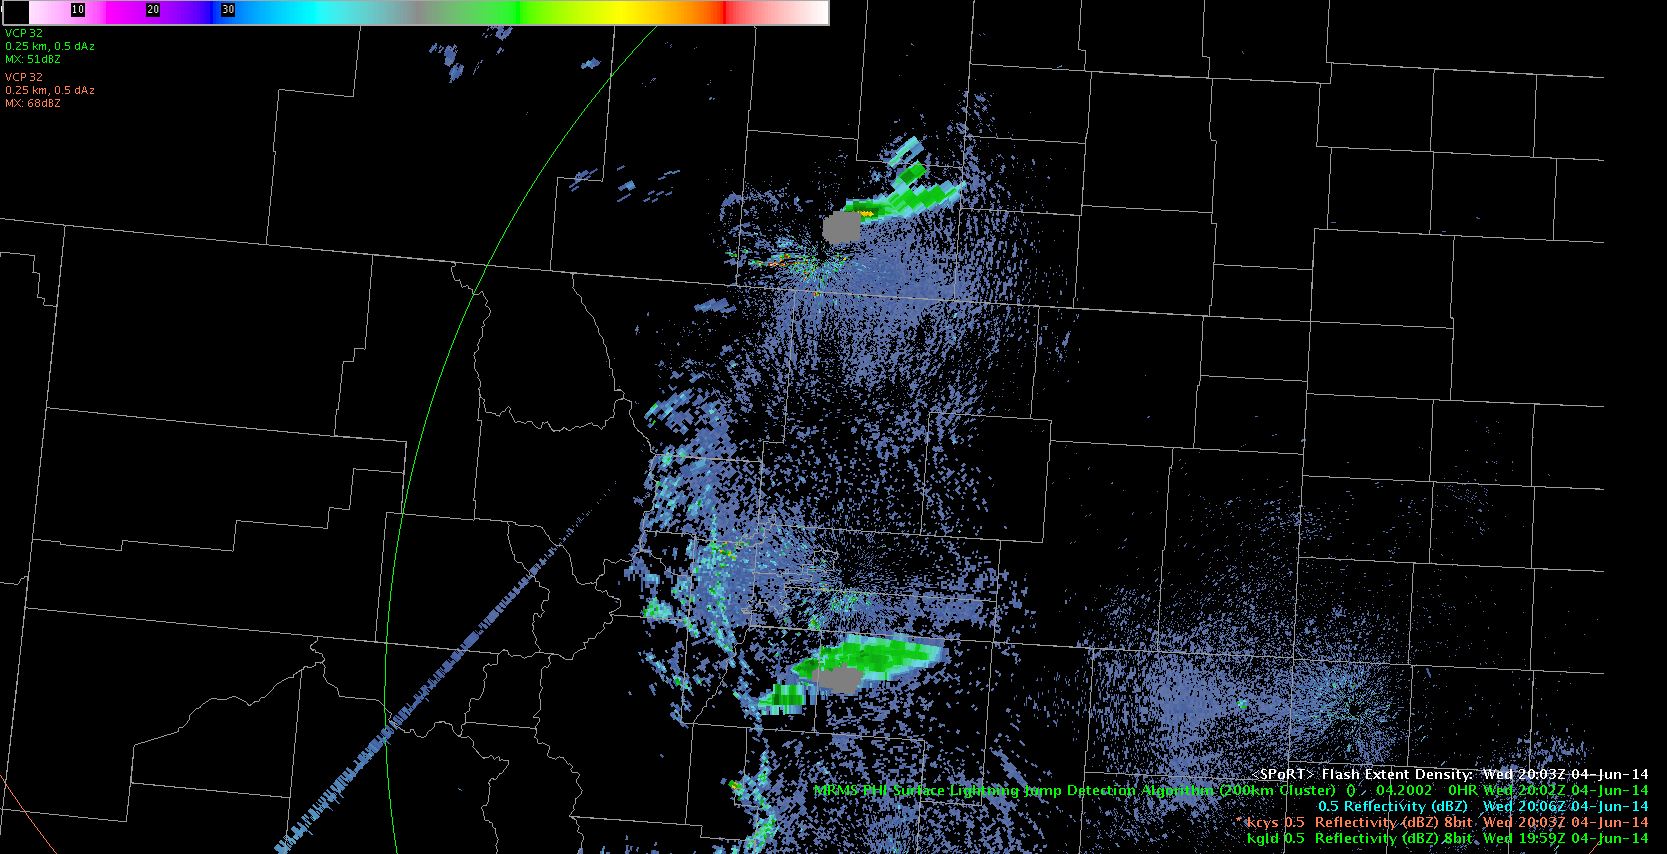 screen below is the earliest showing flash extent. Screen above is one scan later. with Light jump algorithm indicating tracking.