PHS
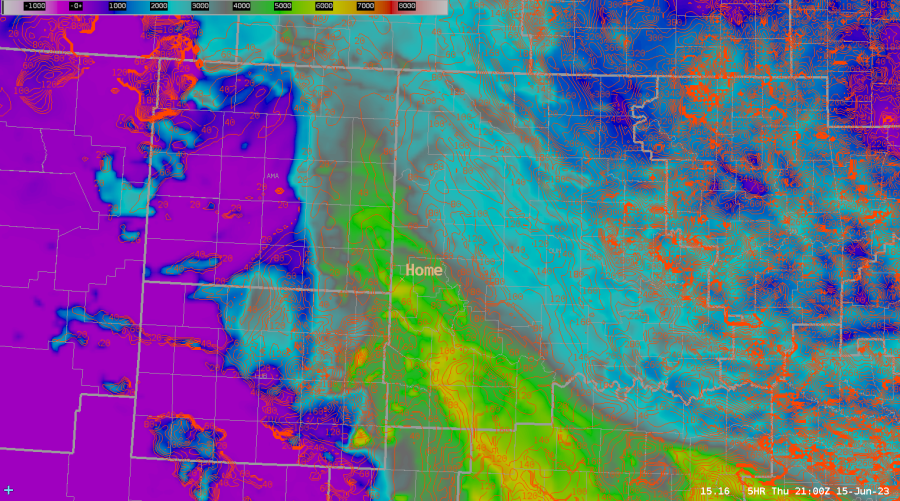
The surface based CINH at 20z lined up rather well with the satellite imagery showing the slightly more stable clouds over the eastern CWA.
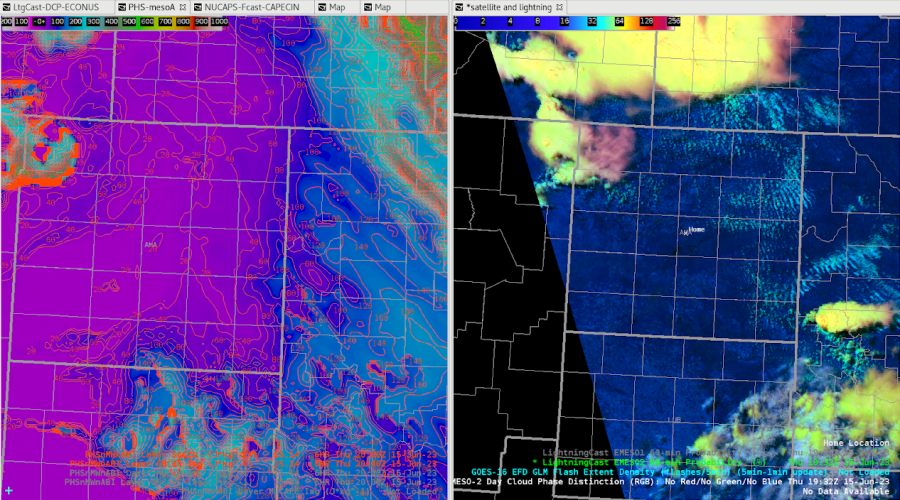
When sampling an image versus contours, the contour sampling has the entire product name in the readout
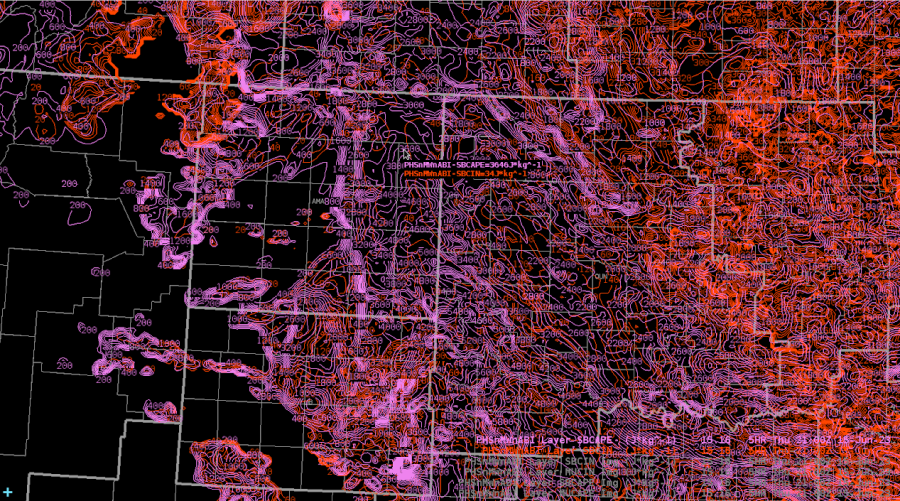
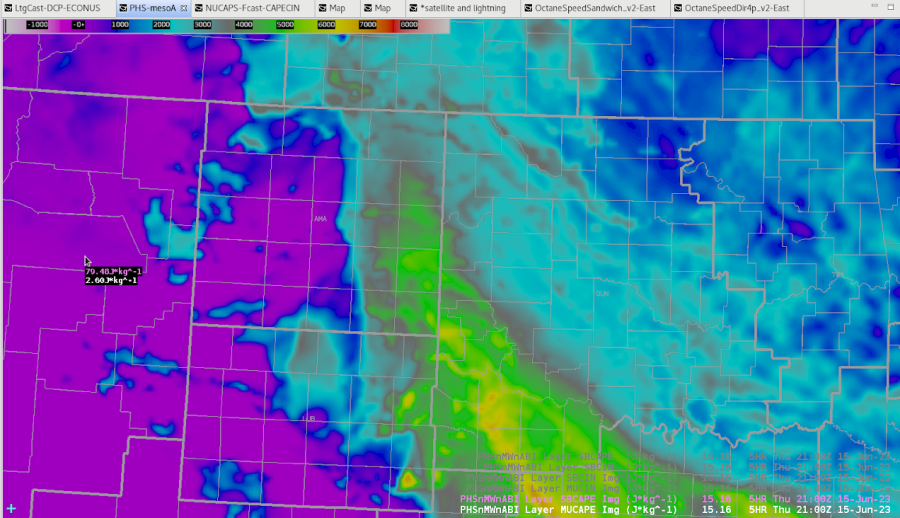
PHS captured the initial convection just east of AMA well, even though the convection started an hour earlier than PHS indicated. Image on right is PHS SB CAPE and contours are PHS SB CINH. Home is roughly where the storm is located. Satellite image is around 1930z and PHS forecast is 21z when CINH dropped from 80j/kg to 40 j/kg.
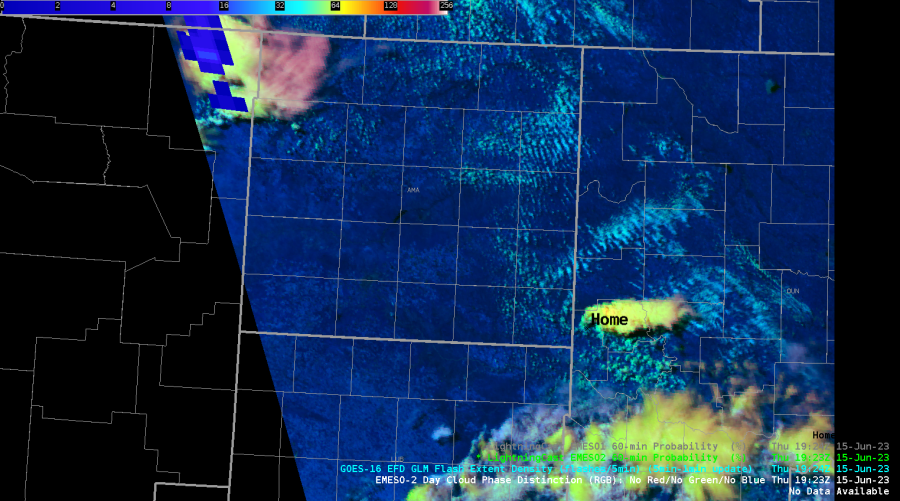
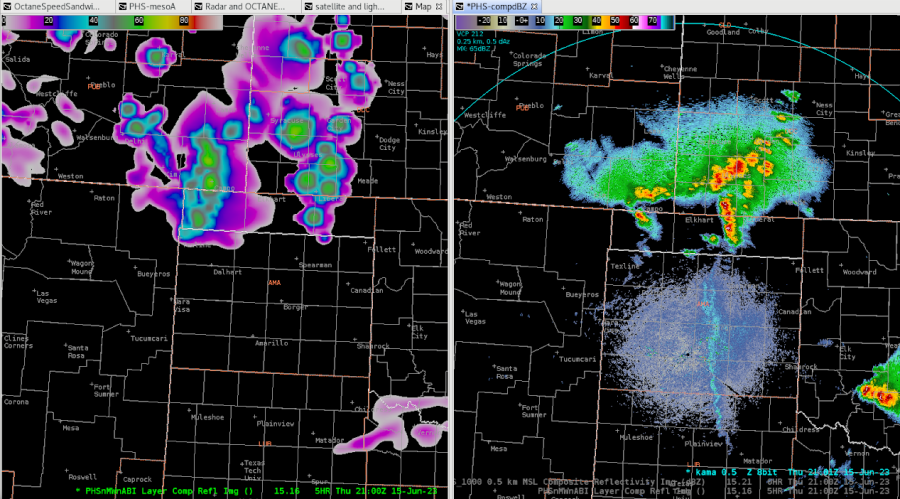
PHS did a reasonable job predicting the general storm coverage by 21z from the 16z run.
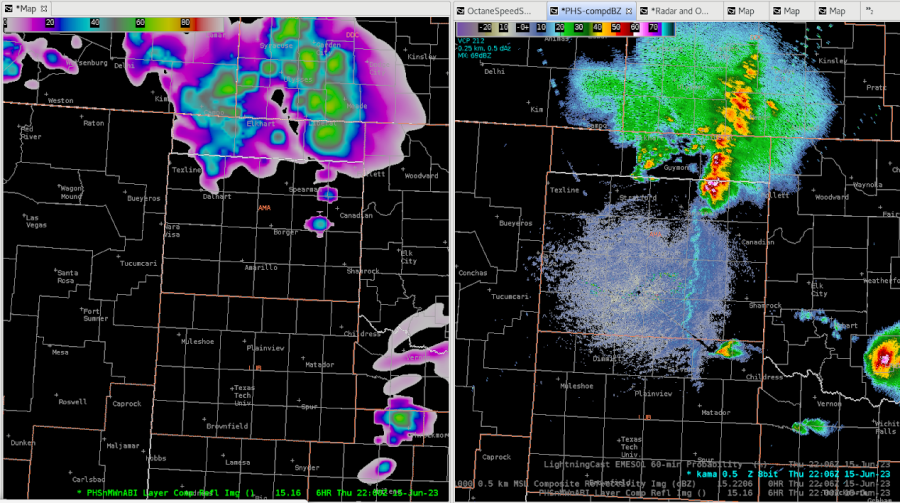
Toward the end of the exercise, the storm coverage was well captured by the PHS 16z run. Should have taken this into account for my public graphics when describing the storm evolution.
NUCAPS
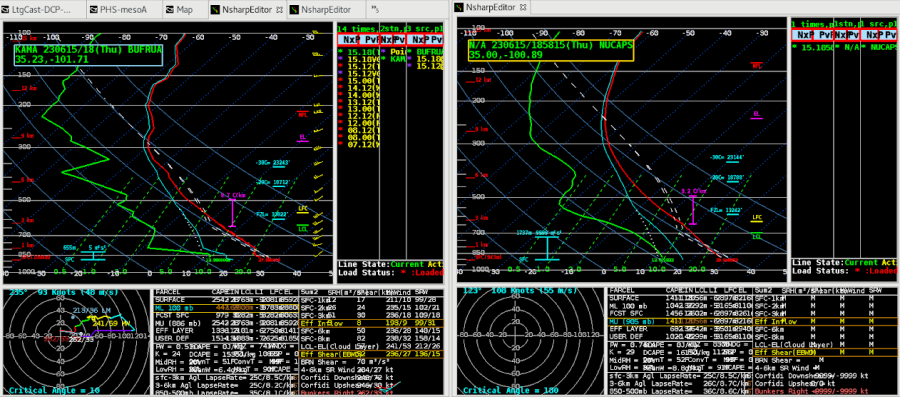
This is a NUCAPS sounding in the TX panhandle near AMA vs. a RAP40 sounding at the same point. The RAP has the same trend in the dew point profile as NUCAPS, but is lower.
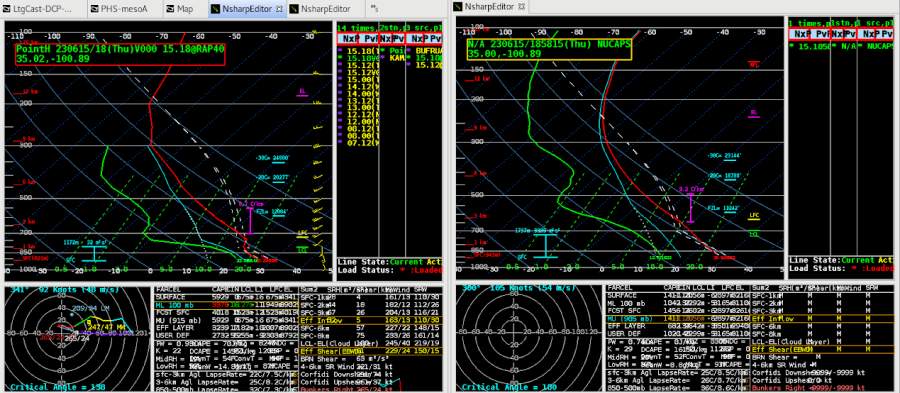
Noticed the NUCAPS sounding didn’t have the lower dew points around 400 mb as shown in the special sounding. NUCAPS did have a hint of the weak cap near the surface though.
NUCAPS 700-500mb lapse rates from the gridded data was a constant 34.17 C/KM across the map.
NUCAPS forecast for ML CAPE was slightly less than what SPC mesoanalysis had at the same time of 20z.
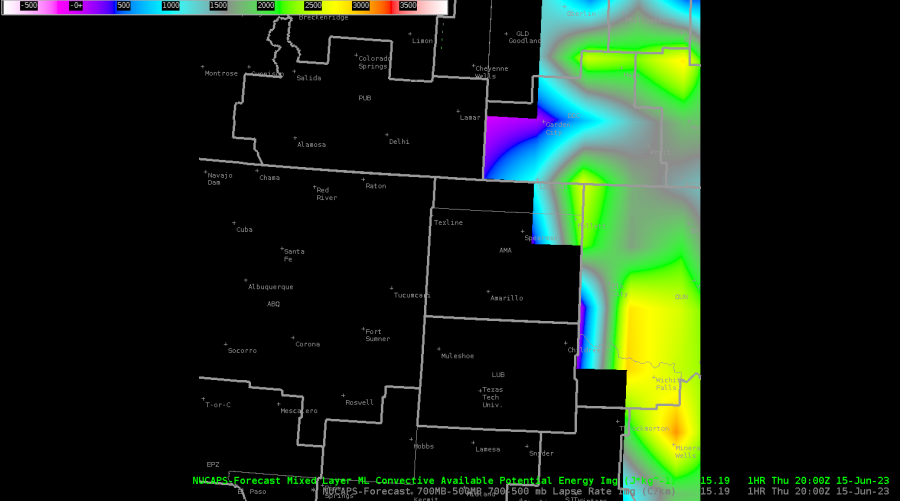
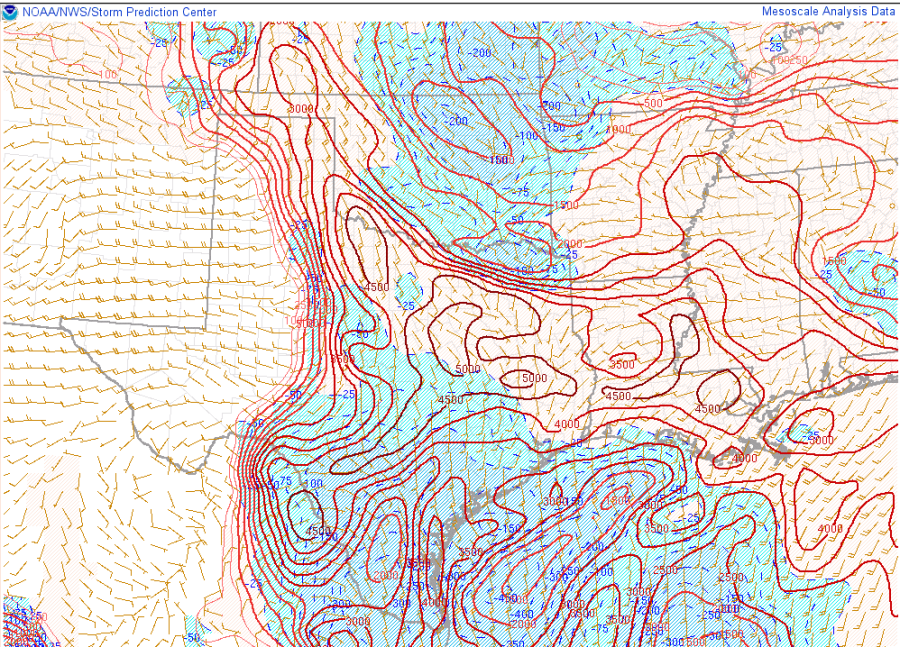
NUCAPS ML CINH was higher than SPC Mesanalysis for 20z, with some parts of the CWA having almost 90j/kg of CINH south of Liberal, KS.
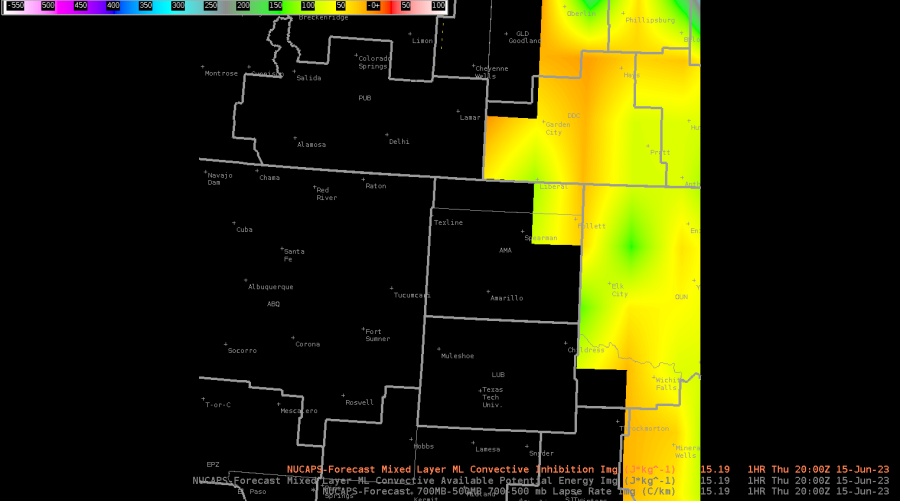
The 700-500mb lapse rates matched well with SPC meosanalysis for 20z.
OCTANE
OCTANE showed the cumulus developing along the dry line and warm front well. Can also distinguish which clouds are becoming taller.
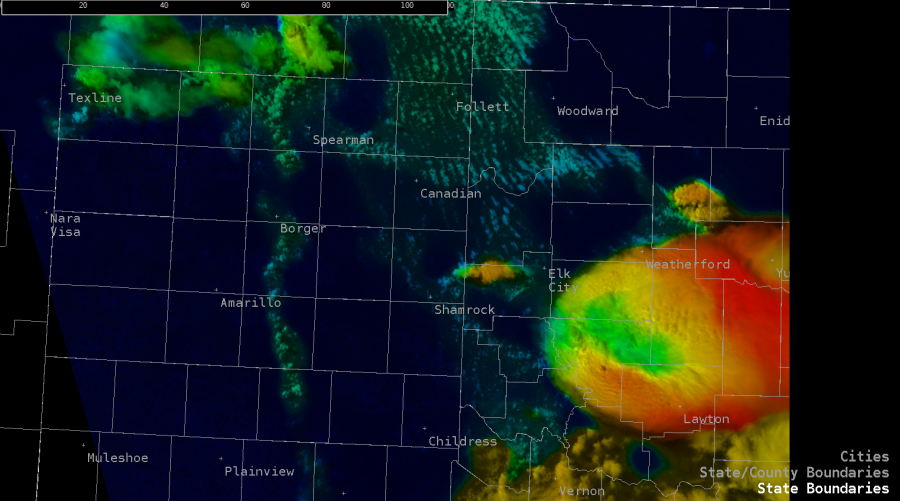
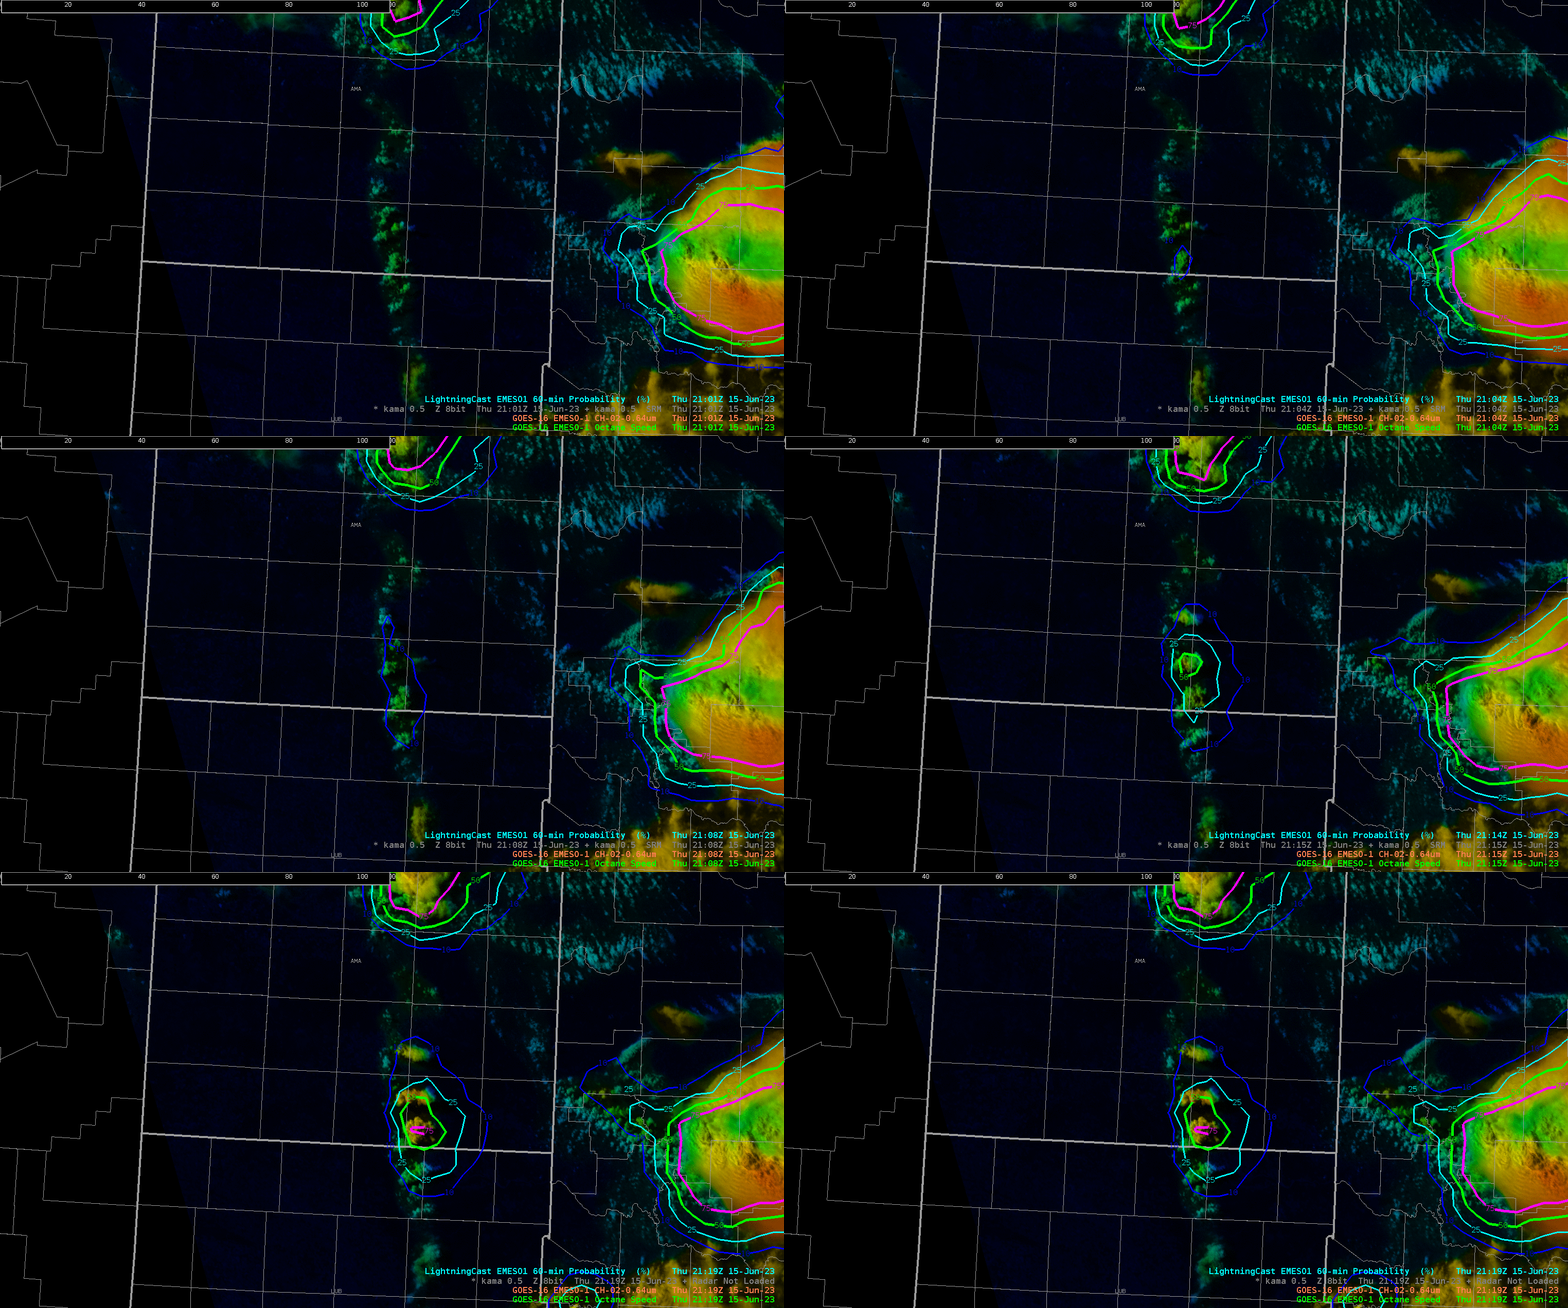
OCTANE highlighted where convection was taller, and Lightning Cast started to show probabilities for those same updrafts.
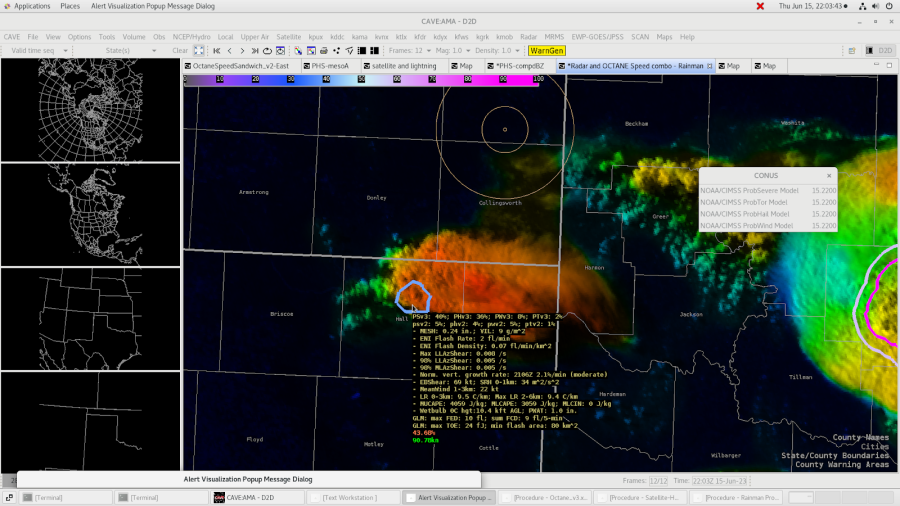
ProbHail
Noticed what could be an above anvil cirrus plume with the storm in question. Prob Hail only had a 35% chance for severe hail at the time.
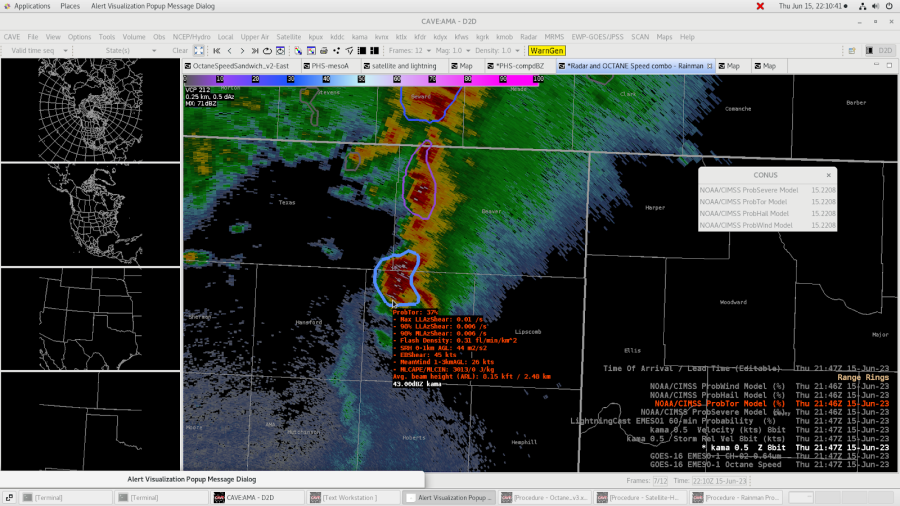
Prob Tor
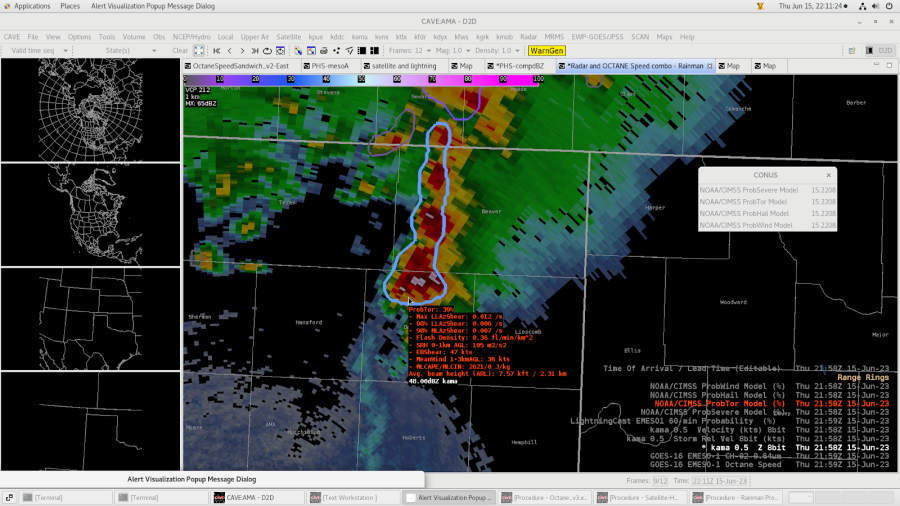
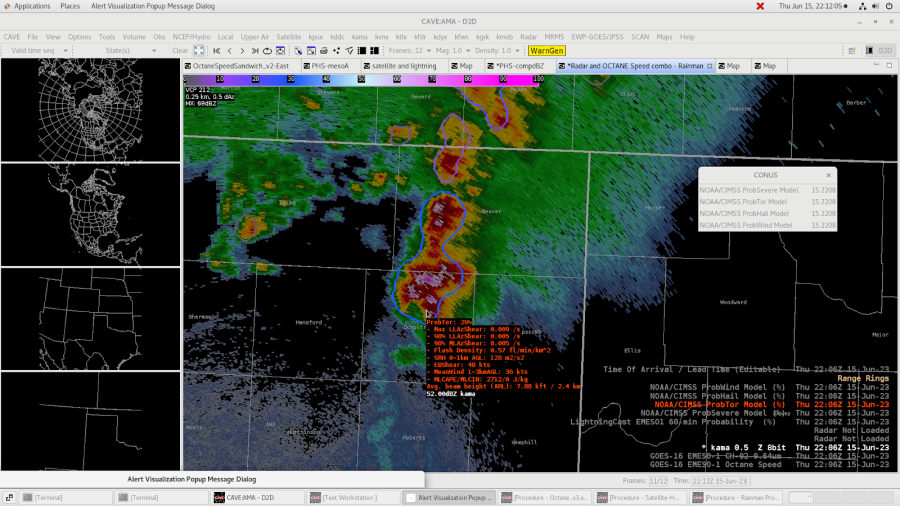
Noticed the Prob Tor jumped up depending on what cells it was encompassing. Took three screen shots to denote the trend. Seemed reasonable for it to increase since the end cell was ingesting the dry line at the time the probabilities increased.
-Rainman

