
Pulsing storms were occurring today across the Grand Forks CWA, but not much in the way of severe storms early this afternoon. However, storms began to intensify on radar at the eastern edge of the CWA and approaching the western edge of Duluth’s CWA in north central Minnesota. A few tools were analyzed during this process to help identify why storms were suddenly increasing in strength. Mid-level water vapor satellite analysis with 500mb RAP heights showed a potential shortwave moving across the area and helping to intensify storms for a brief period of time.
A comparison of a model sounding with the NUCAPS profile (non-modified vs. modified) was done in order to see the environment these strong to severe storms were heading into later this afternoon. There were subtle differences, but overall the model vs. satellite profiles were pretty comparable. Instability values were higher with the RAP mainly due to the fact that it had a 5 deg F warmer surface temperature. But both profiles were similar with the dewpoints and overall the thermodynamic profile of semi-steep lapse rates along with no capping inversion. With the observed surface temperatures warmer than the RAP had by 3-4 degrees, we decided to check out the modified NUCAPS profile to see if it had warmer temperatures. The modified NUCAPS profile had the same temperatures as the RAP at the surface and was much closer in comparison. However, both the model sounding and NUCAPS sounding were off by 3-4 degrees F on the actual surface temperature, so mental modifications were made to realize the instability was likely more than given with these profiles.


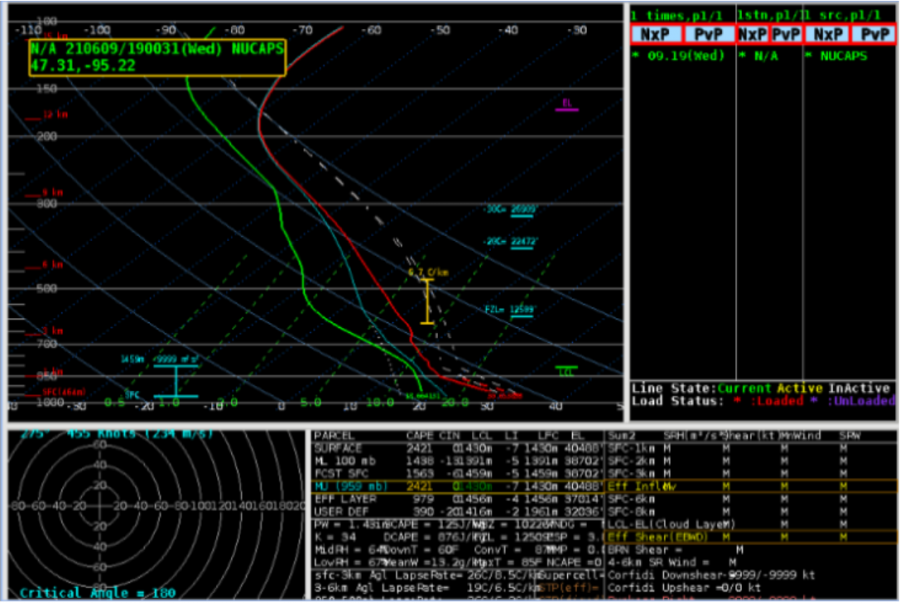
The storms were relatively weak for much of their lifespan, but around 4:30 PM CDT a few cells intensified. A storm in Beltrami County near Red Lake, MN grew steadily in intensity, as seen below with the ProbSevere 3 time series. Wind was the main concern, with plenty of dry air noted on both the NUCAPS and RAP soundings. DCAPE ranged from 800-1100 J/kg on these soundings as well.
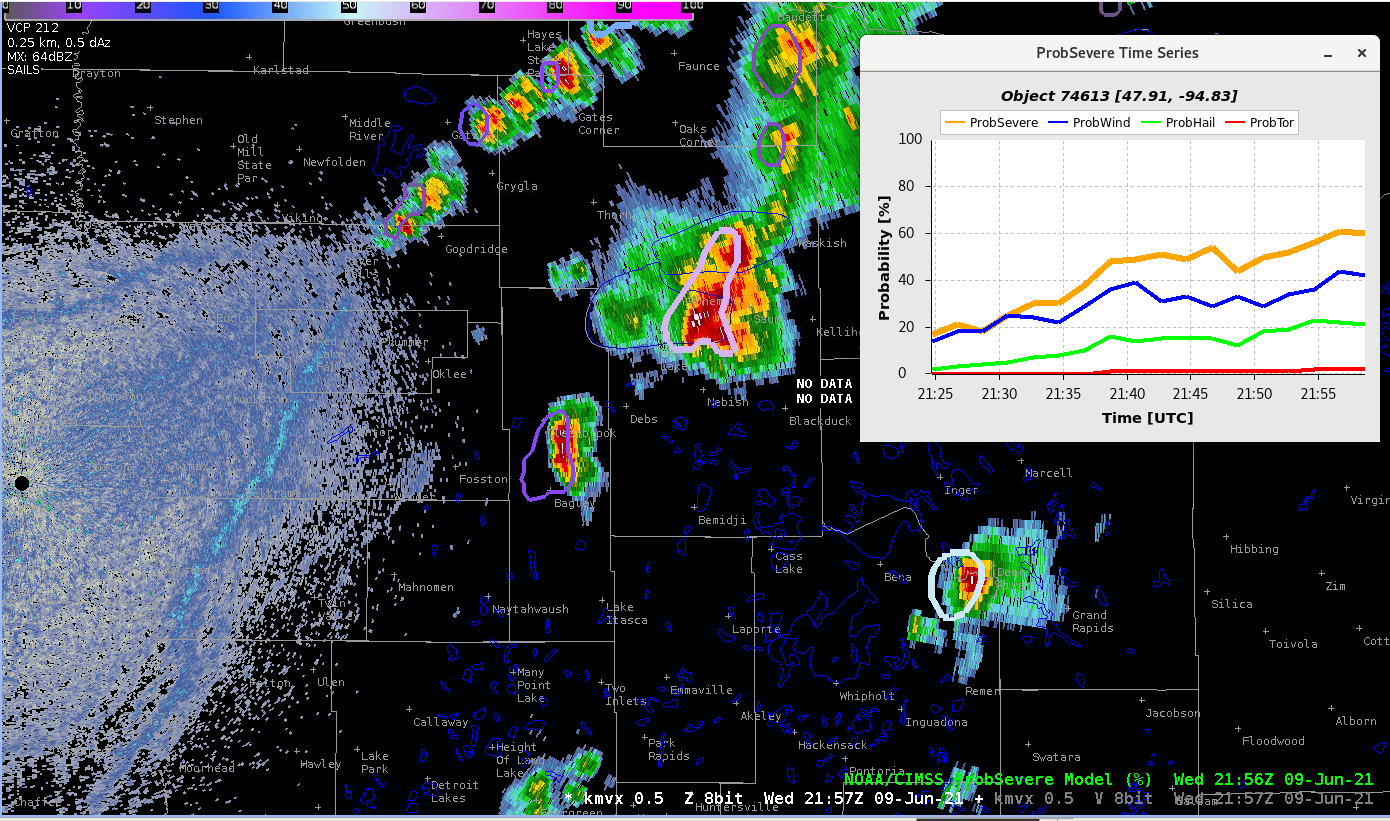
Overall probabilities that the storm was severe can be seen in Image 6, which shows the ProbSevere readout for the storm. Both ProbSevere 2 and the newer ProbSevere 3 showed an overall severe probability of 65% and 61%, respectively. The wind threat is lower with ProbSevere 3, which had it at 44%, as compared to Prob Severe 2. This is consistent with the research that has shown the newer version is more conservative than the old version. Research also shows that the newer algorithm output is closer to what actually happens historically, i.e., about 44% of similar storms produced wind damage according to Storm Data.

– Harry Potter/Dana Scully