
Scattered strong to severe thunderstorms were popping up along the eastern ND and MN border today. However, these storms were struggling to become severe at times with a majority of the cells pulsing up and down. A NUCAPS pass around 19z provided gridded satellite observations and forecasts for the area to compare with SPC’s mesoanalysis page. The gridded NUCAPS at 19z shows CAPE (Image 1) values ranging from 500-1500 J/kg in the area mentioned above with little to no CIN (Image 2) present based on the gridded NUCAPS data. Image 3 below shows the SPC 19z CAPE/CIN data along with the forecast over the next 6 hours (through 01z). When comparing the 19z SPC mesoanalysis to the gridded NUCAPS, there was not much difference between the two with both showing higher CAPE values further south into Nebraska and Kansas. The gridded NUCAPS for CIN seems a bit erroneous with really no signature for -50 or less of CIN, which is present in the SPC mesoanalysis. This is likely due to the lack of detailed boundary layer features with NUCAPS and the fact that it may likely wipe such smaller inversions.
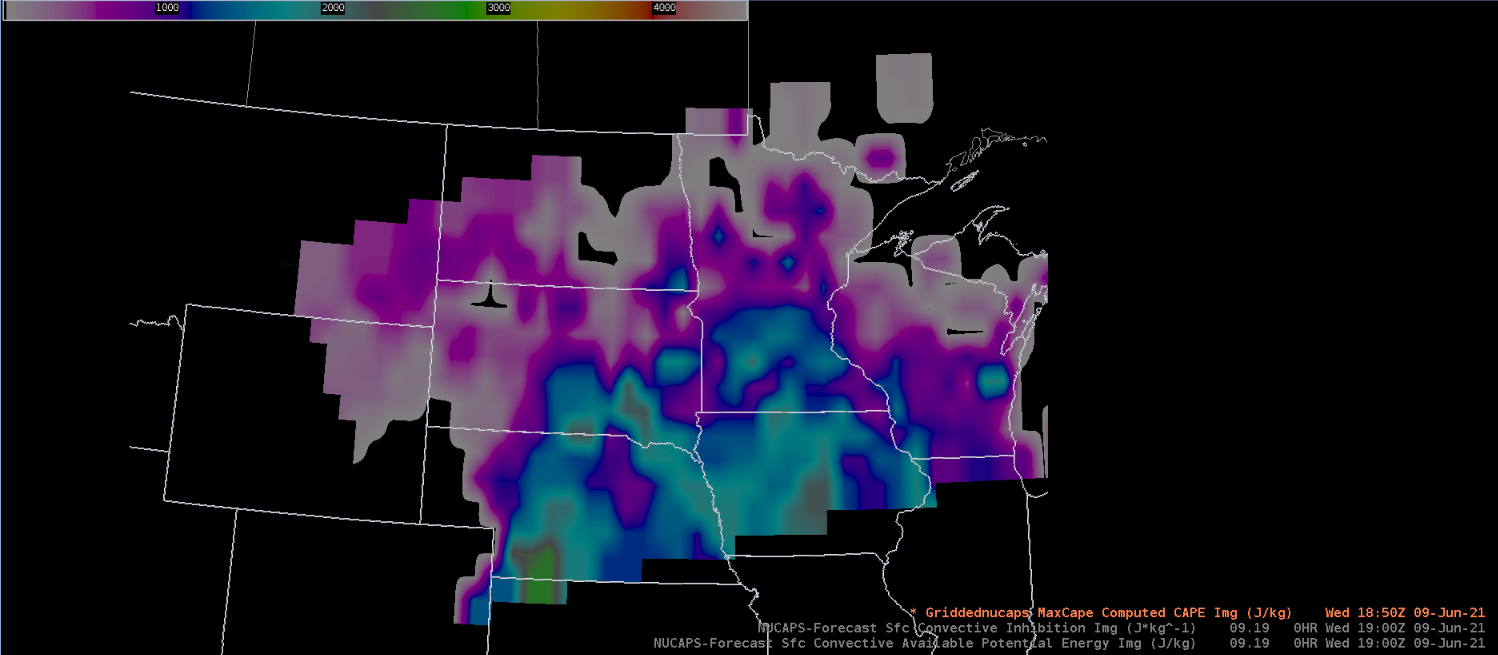

Looking into the forecasted parameters from NUCAPS, there is a much higher bias in the CAPE values. However, they did a great job at pinpointing an area of higher instability to watch for storms to potentially become more severe with time. The overall CIN forecast looked as if it may start to increase further west near Grand Forks later in the evening, but in central MN where the corridor of CAPE values were higher remained uncapped. As time progressed through the afternoon a few storms did start to intensify and become severe across north central MN with a few severe wind reports. A few lingering surface boundaries were present, along with a weak shortwave at 500mb helped to enhance the storms a bit. I do feel the NUCAPS forecast values for CAPE were a bit too high in comparison to the actual environment and should definitely be compared to model data.
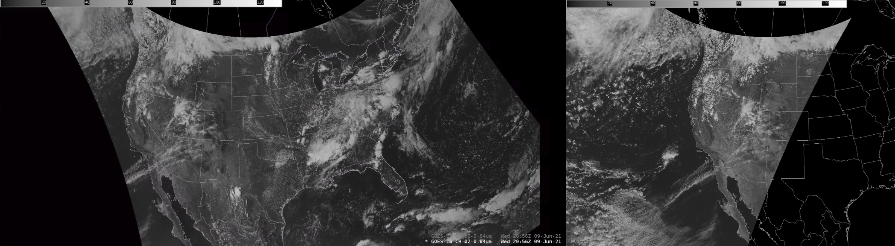
Lastly, the location of storms yesterday provided the chance to compare the GOES-16 and GOES-17 GLM products with one another. However, image 5 shows the extent of the two satellites and GOES-17 was right on the edge of where storms were across the Upper Midwest. As you get further away from the satellite and towards the edge of its coverage, you can start to notice more of a tilt in the gridded data. This may cause some erroneous data as seen in comparison with GOES-16. Comparing the GOES-16 data (Image 6) with the GOES-17 data (Image 7), there is a better display of the minimum flash area and lightning sizes with the GOES-16. You can see GOES-16 shows more of a mixture of shorter and longer flashes (purple and yellow colors), while GOES-17 sees strong shorter flashes (yellow colors). Also, the further away the satellite is to the storms the more likely the flash extent density may be less accurate. This is likely due to the storms being on the edge of the satellite’s reach. Therefore it is important to check out both satellites when possible, but take into account where the storms are in respect to the satellites coverage.
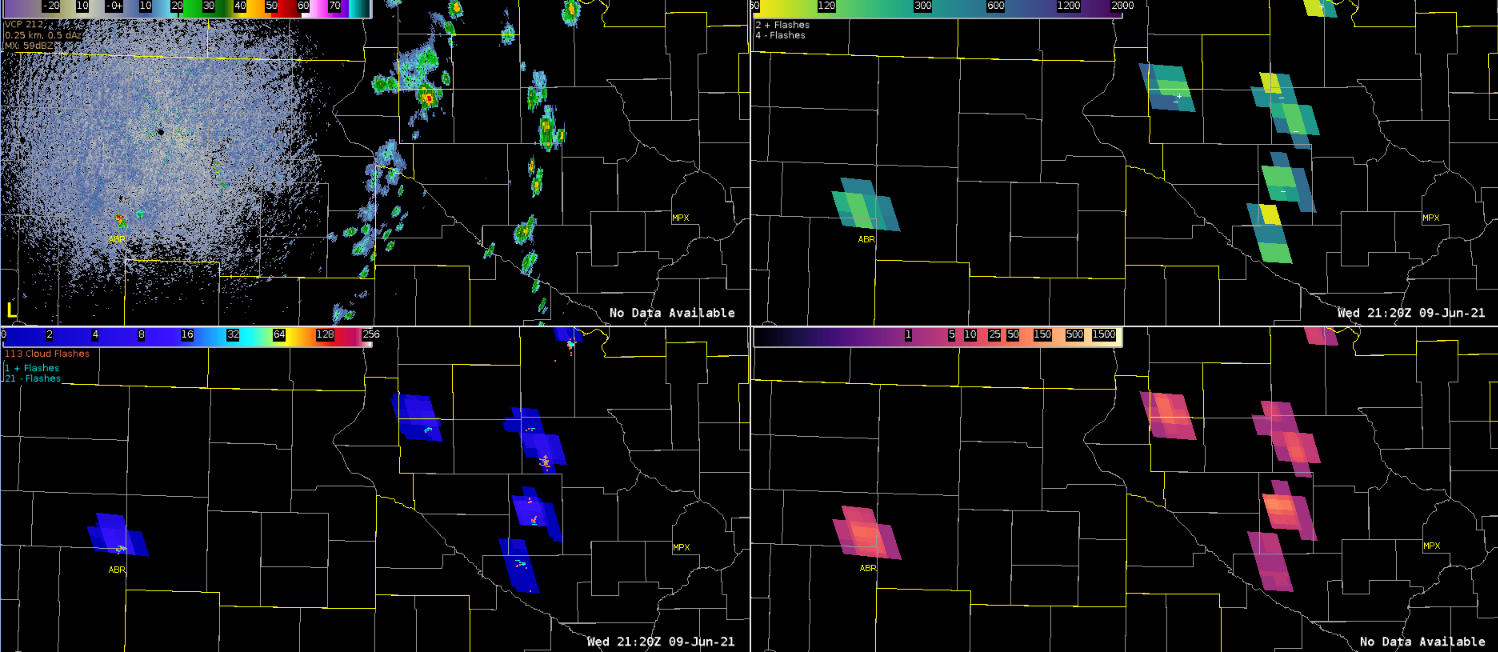

Here are a few more supplemental images of the GLM GOES-16 satellite versus the GOES-17 with similar concerns as mentioned above.


– Harry Potter