An official website of the United States government
Here’s how you know
Official websites use .gov A
.gov website belongs to an official government
organization in the United States.
Secure .gov websites use HTTPS A
lock (
) or https:// means you’ve safely connected to
the .gov website. Share sensitive information only on official,
secure websites.
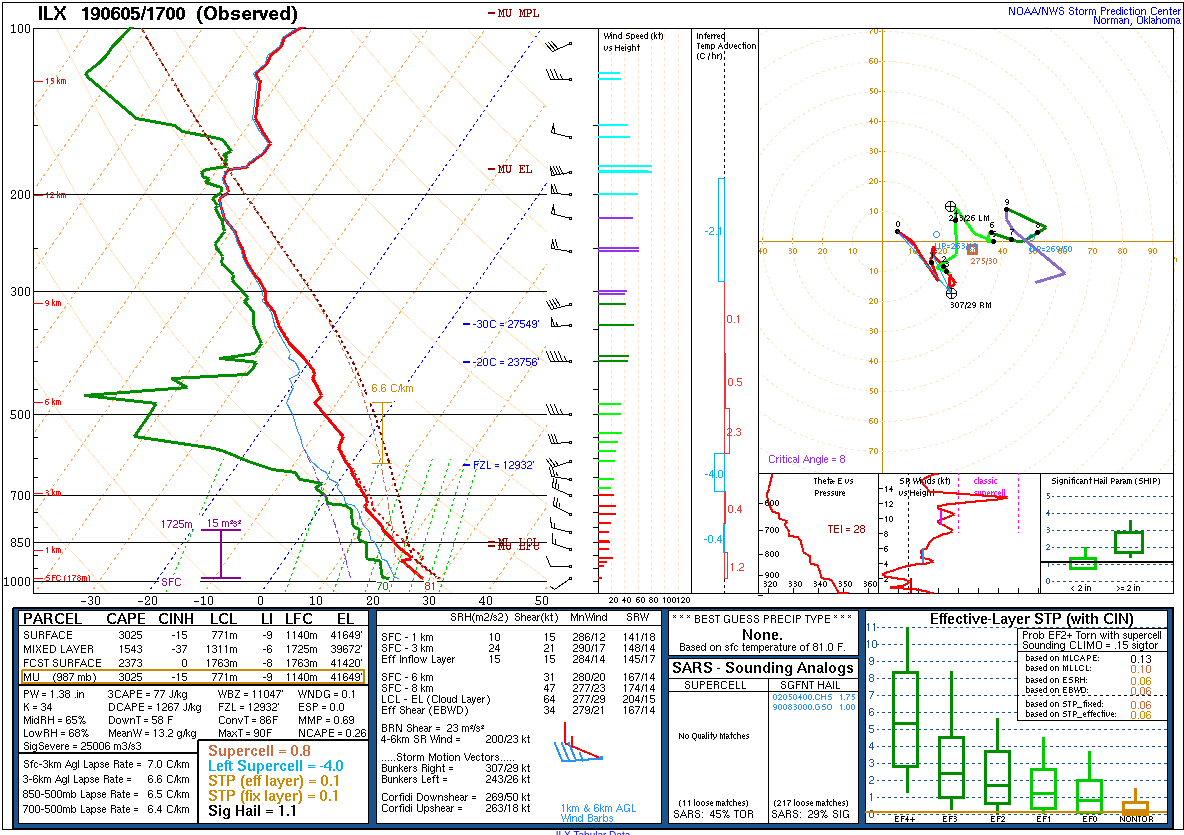
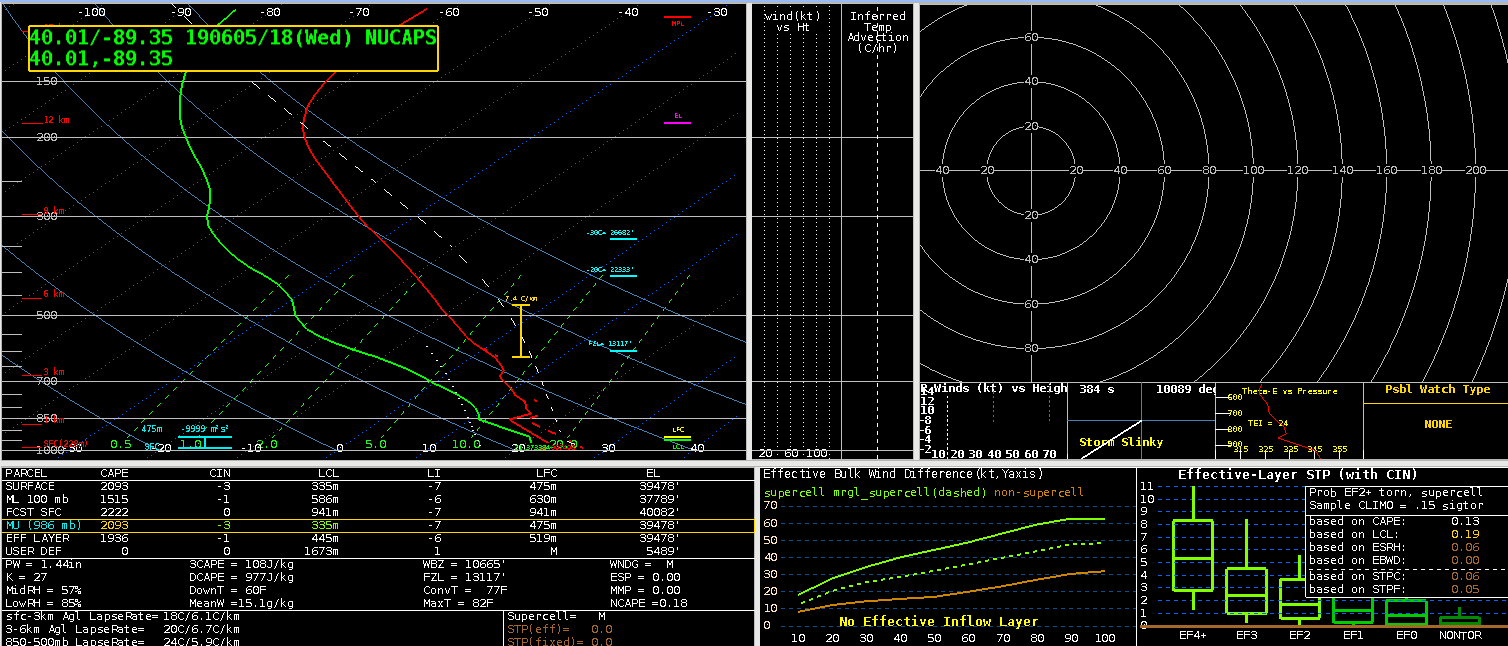
Above is a special sounding released by the ILX office around 17z on June 5th, 2019. Below is the output for the NUCAPS and sequential Modified NUCAPS sounding from around the same time and as close to the same area as possible.
The NUCAPS pass pictured above was primarily in a cloud-free environment behind an old outflow boundary to its south and ahead of a developing line of convection to its north. Visually, it tended to underdue the CAPE values in the environment, especially in the low to mid levels.
The modified NUCAPS sounding (above) did show some skill in incorporating more accurate boundary layer conditions, which in turn, upped the CAPE values considerably (almost 2x in some cases). This brought the values into better agreement to the in-situ observation from NWS ILX with the exception of the SFC based CAPE which remained considerably underdone.
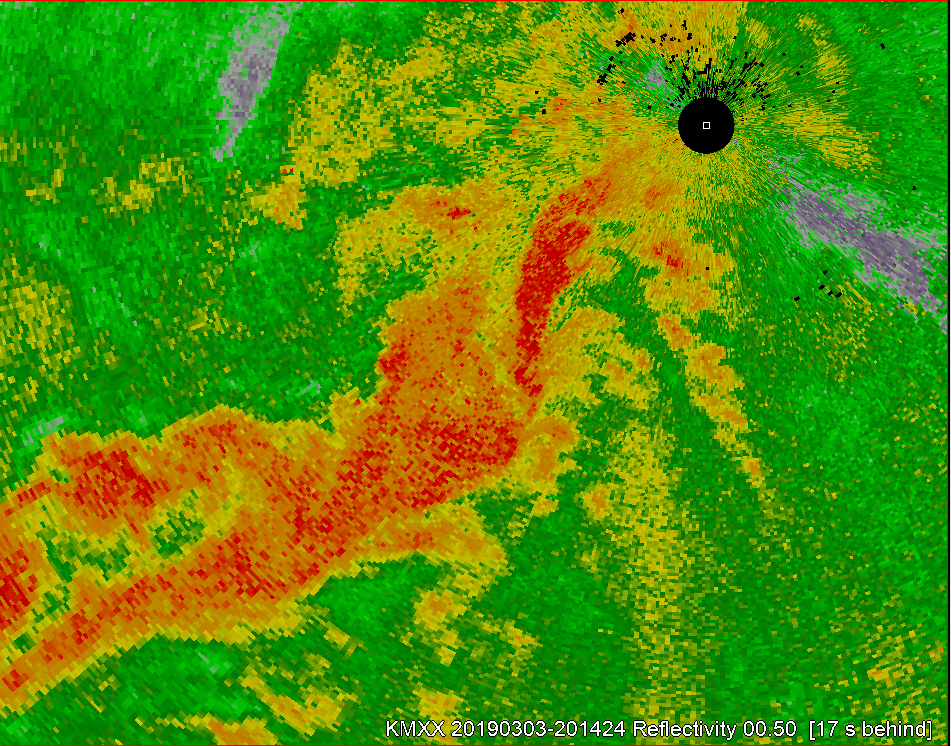
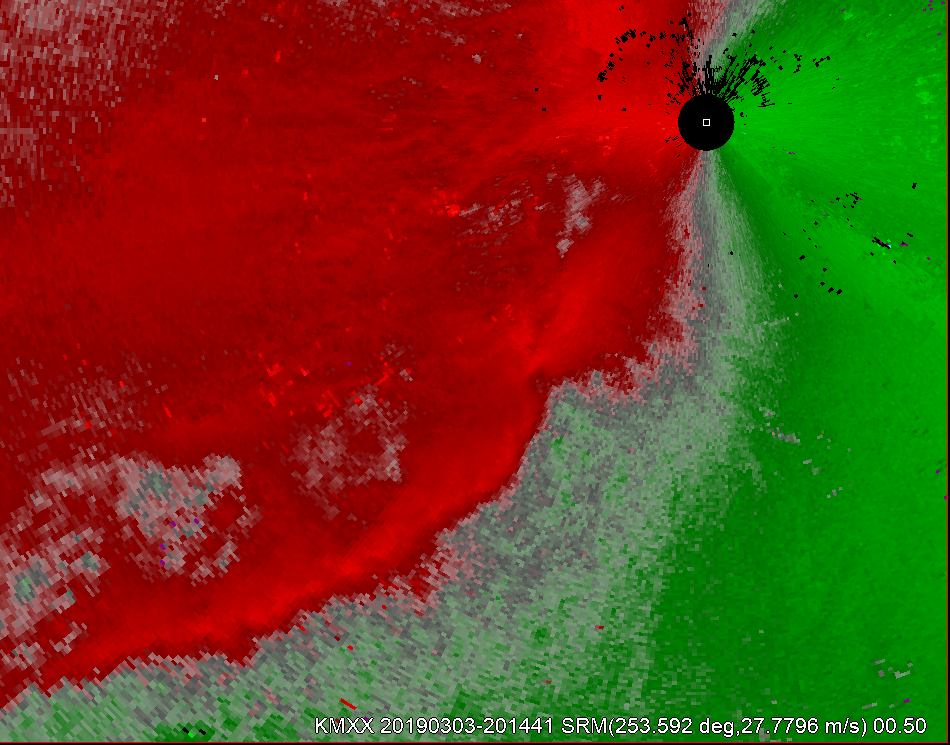
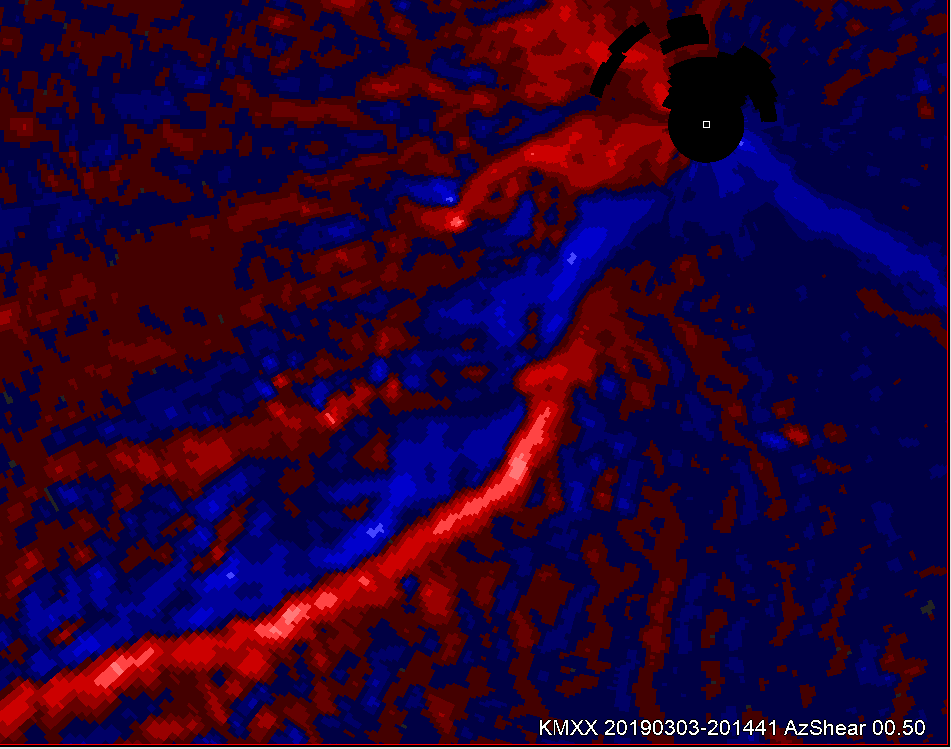
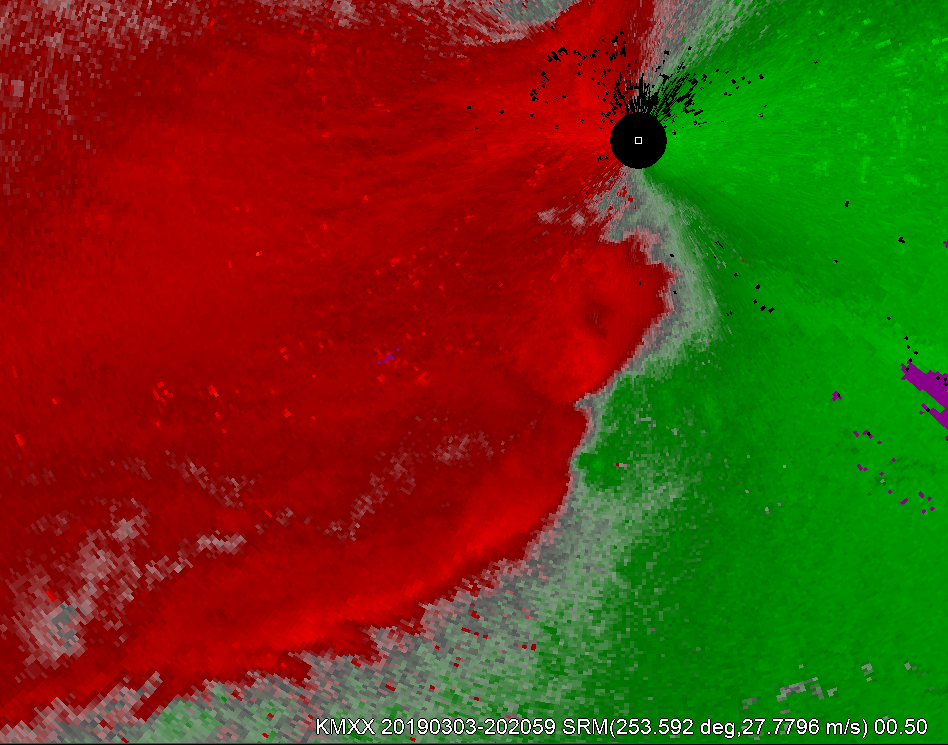
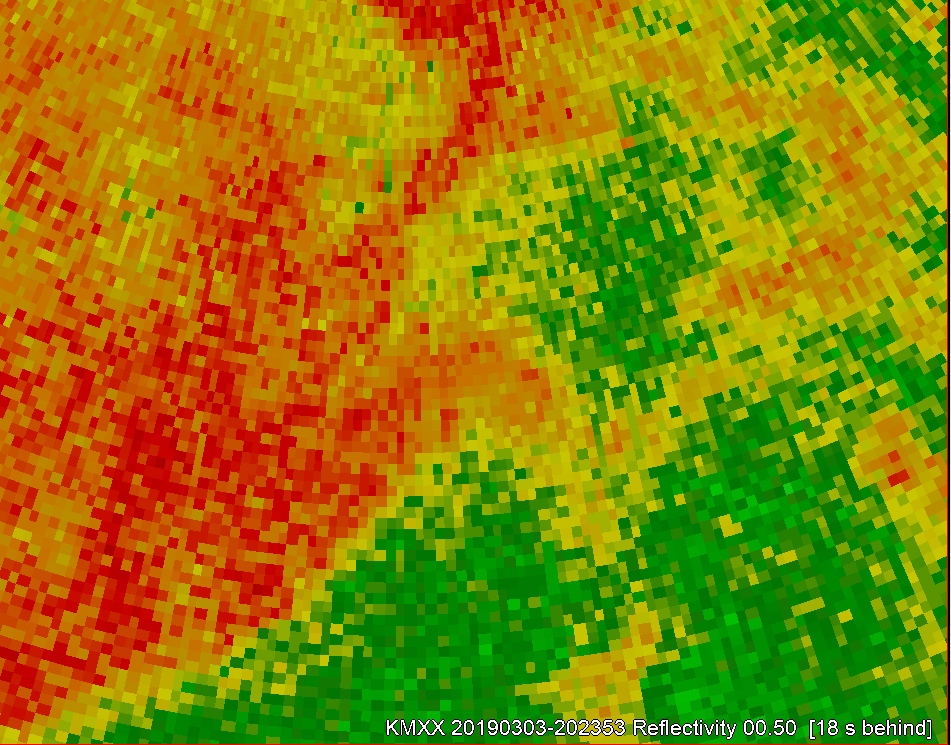
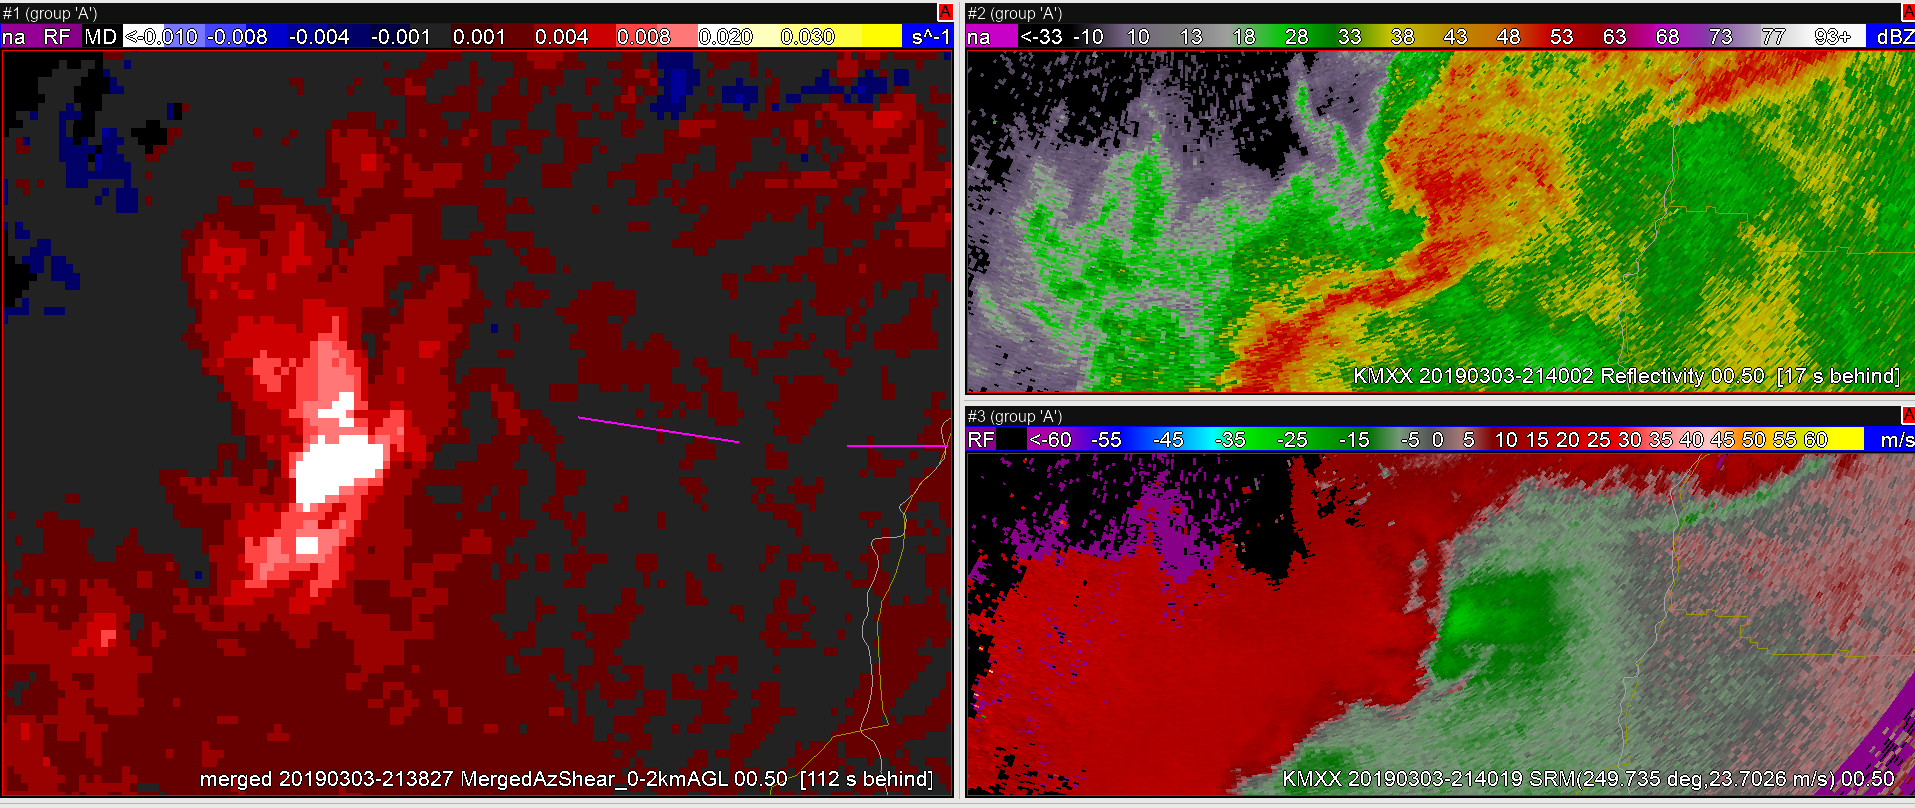
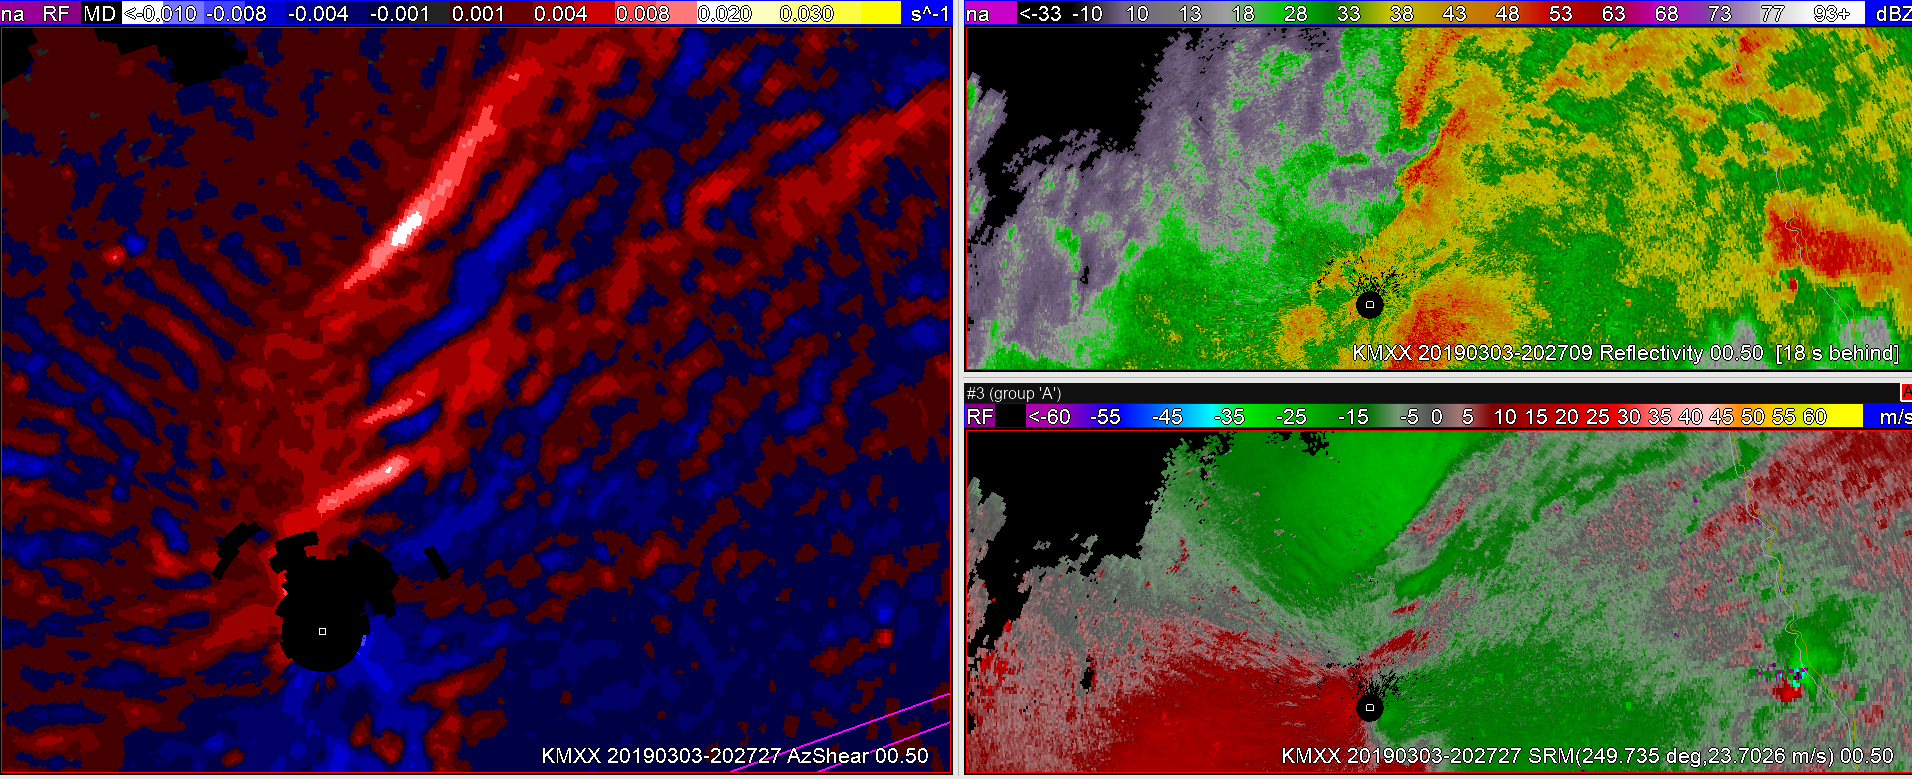
At 2014z the MXX radar showed a line of convection extending to the southwest of the radar location. SRM depicts convergence along the line but it is limited since it is down the radial. There are some notches in the reflectivity, and some wiggles in the convergence line, but there are not direct areas of rotation at this time.
2014z 0.5 reflectivity.2014z 0.5 SRM.
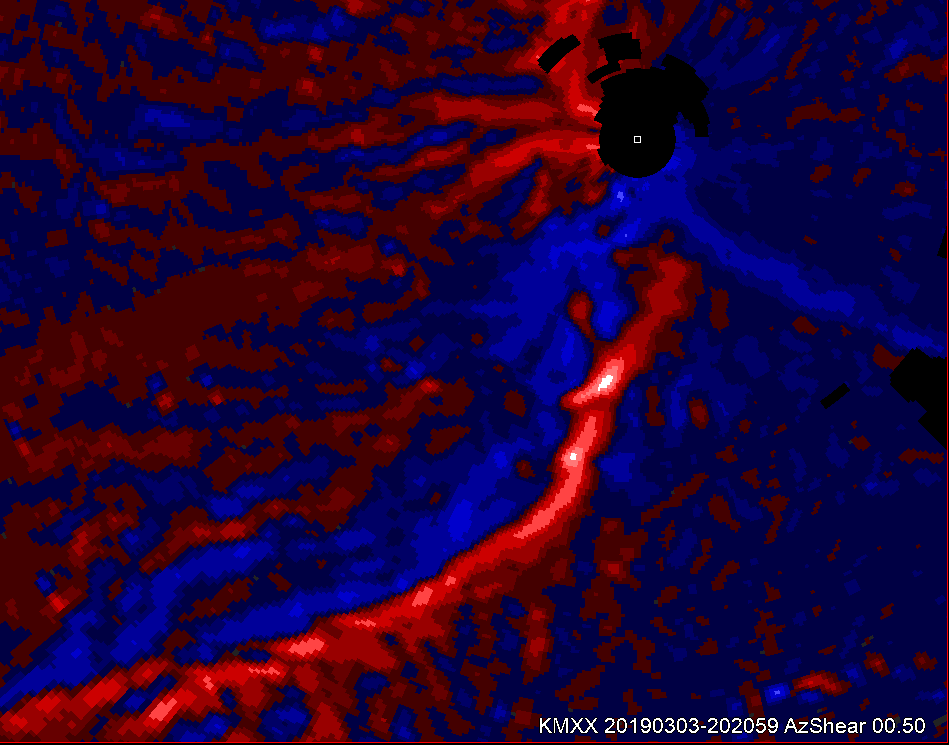
The single radar azimuthal shear supported the idea of a convergent line with a corridor of slightly positive values along the line.
2014z 0.5 AzShear
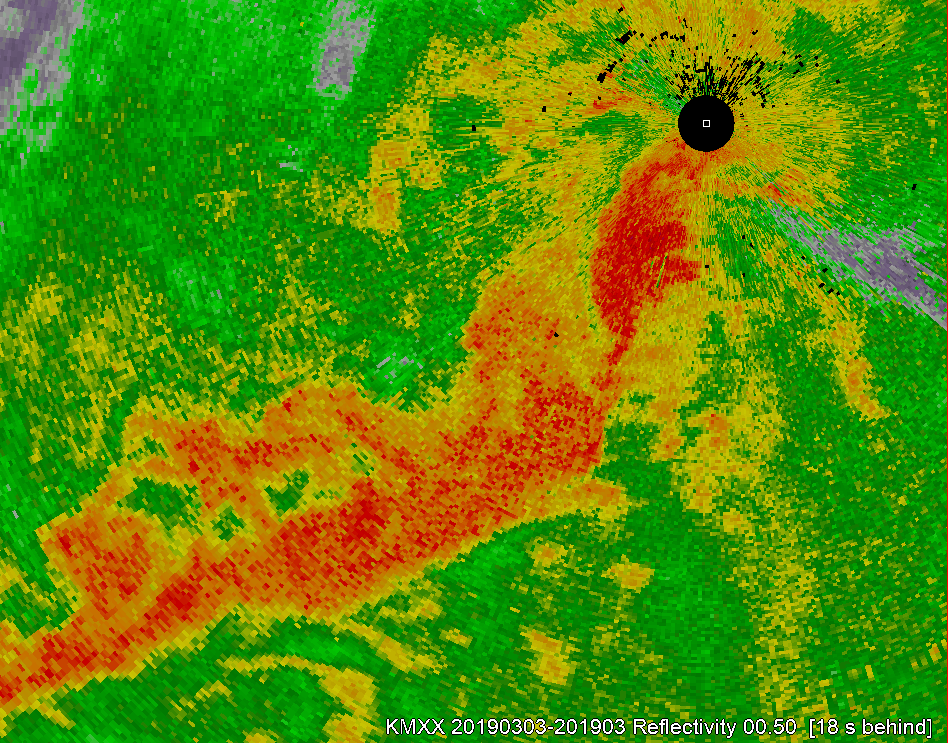
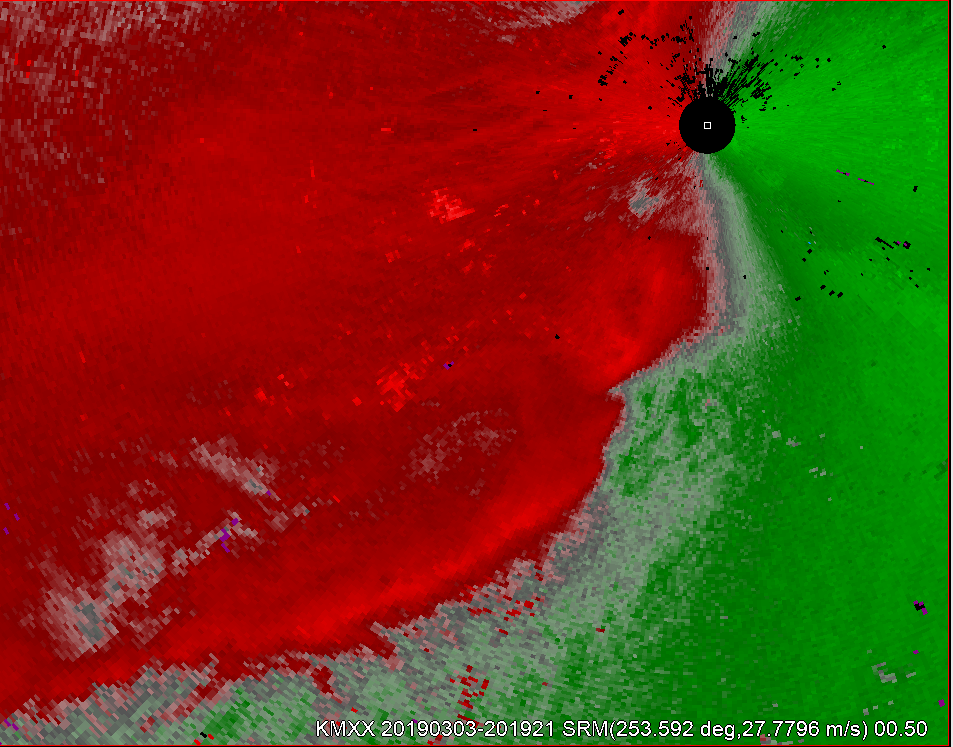
Stepping ahead 5 min some changes appear to be ongoing immediately to the SSW of the radar. The low-level reflectivity depicts that there is some discrete nature to the cell on the northern portion of the line. Of note, this does appear the be occurring near a surface low per the analysis, and upstream of a tornadic supercell. At this same time a kink does develop within the convergence line on the low tilt SRM.
2019z 0.5 reflectivity.2019z 0.5 SRM.
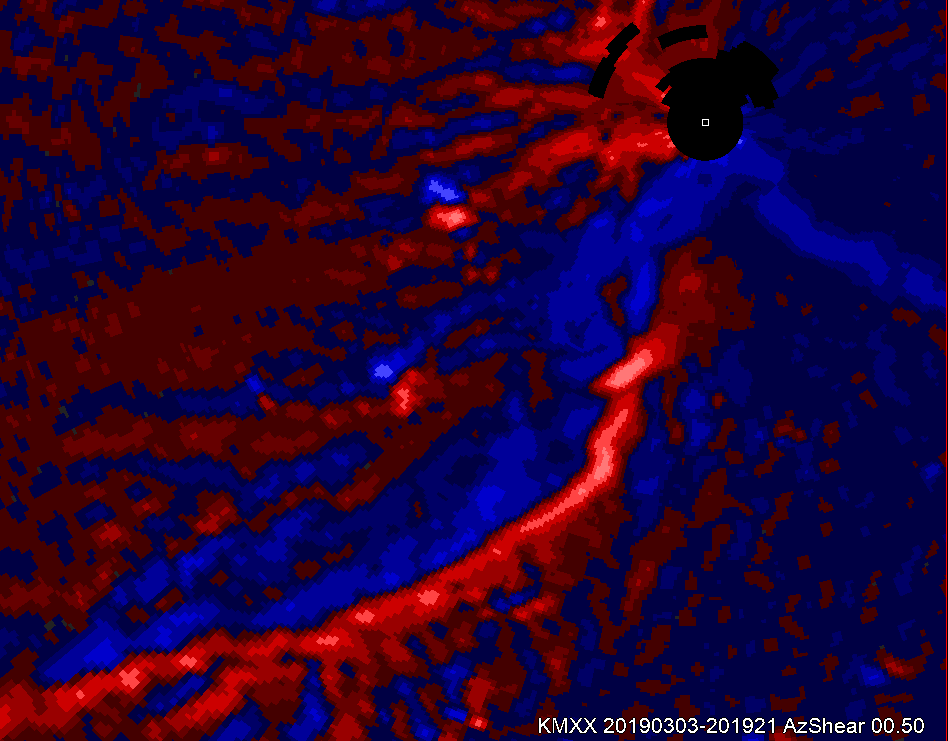
At the same time, the AzShear product shows some enhanced values at the northern end of the line that have become somewhat discrete from the remainder of the line. However, there are some enhanced values immediately south of the aforementioned area.
2019z 0.5 AzShear
Advancing ahead about 2 min, the two areas become more enhanced in the AzShear product. At the same time the SRM does continue to show a kink in the line with the northern area of interest, and some weak and broad circulation on the southern area of interest.
2021z 0.5 AzShear2021z 0.5 SRM
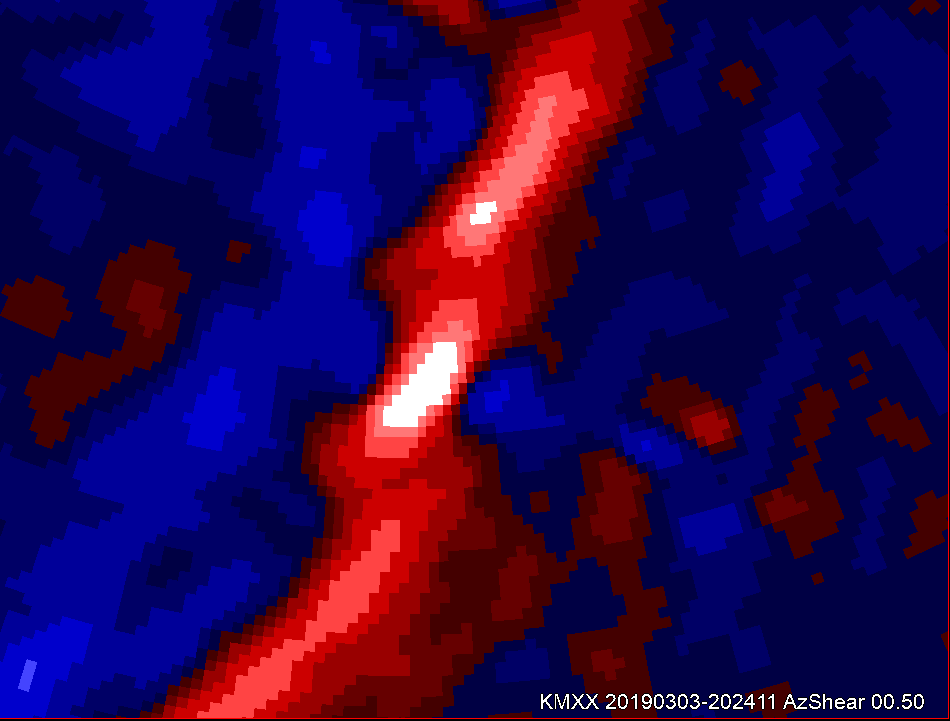
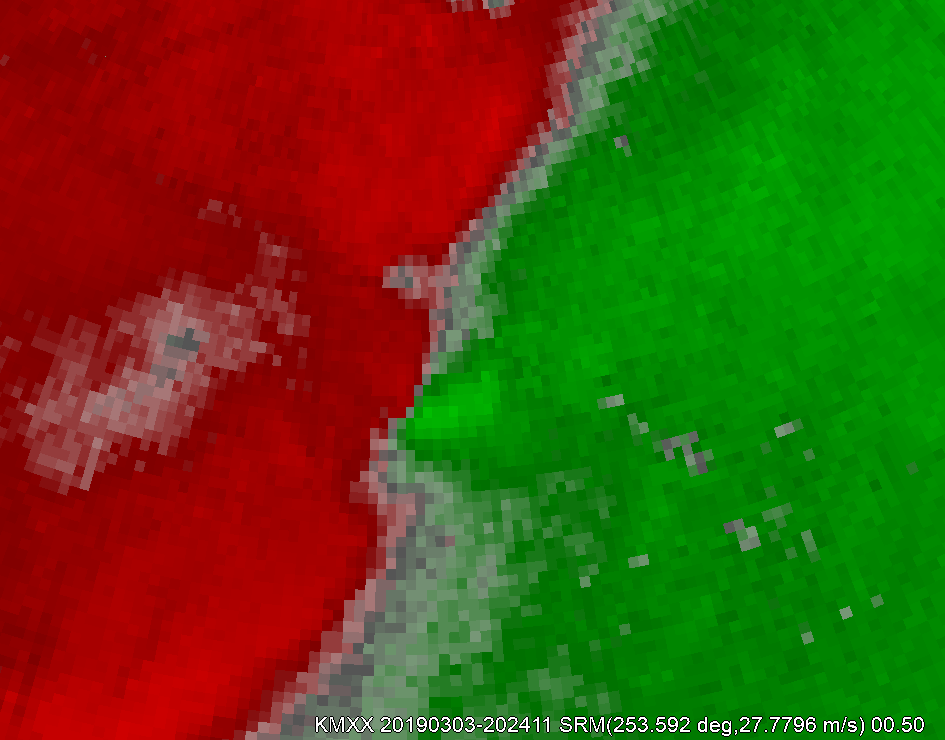
At this time, it is plausible to at least draft a polygon for a tornado warning based on the combination of increasing azimuthal shear and a favorable low-level environment. By 2024z the southern area of interest on the azimuthal shear has become dominant, and there is now a circulation on the 0.5 SRM. The reflectivity also shows high values associated with this circulation. In my opinion, using all three sources of information a tornado warning should be issued at least by this time.
2024z_AzShear2024z 0.5 SRM2024z 0.5 reflectivity
A tornado would develop out of this line shortly thereafter about 2727z and would be rather long-lived. After examining this particular storm in this case I see the single radar azimuthal shear as a ‘confidence builder’ that can be used along-side reflectivity and base velocity or SRM. The azimuthal shear product shows potential in highlighting particular areas of interest, which may provide a few additional minutes of lead-time.
The All-sky CAPE product has shown a pool of lower CAPE values (1200-1300), probably a result of earlier collapsed convection. However, values of CAPE farther down in the southern IND CWA are a little higher (1800-2200), as would be expected. More interesting is the latest modified NUCAPS pass with soundings indicating much higher CAPE values on the order of 3500-4000 in the south and 1800-3500 elsewhere in the central and northern IND area. Based on this information, I’ll be expecting to see convection flaring up in the south in the next hour or so.
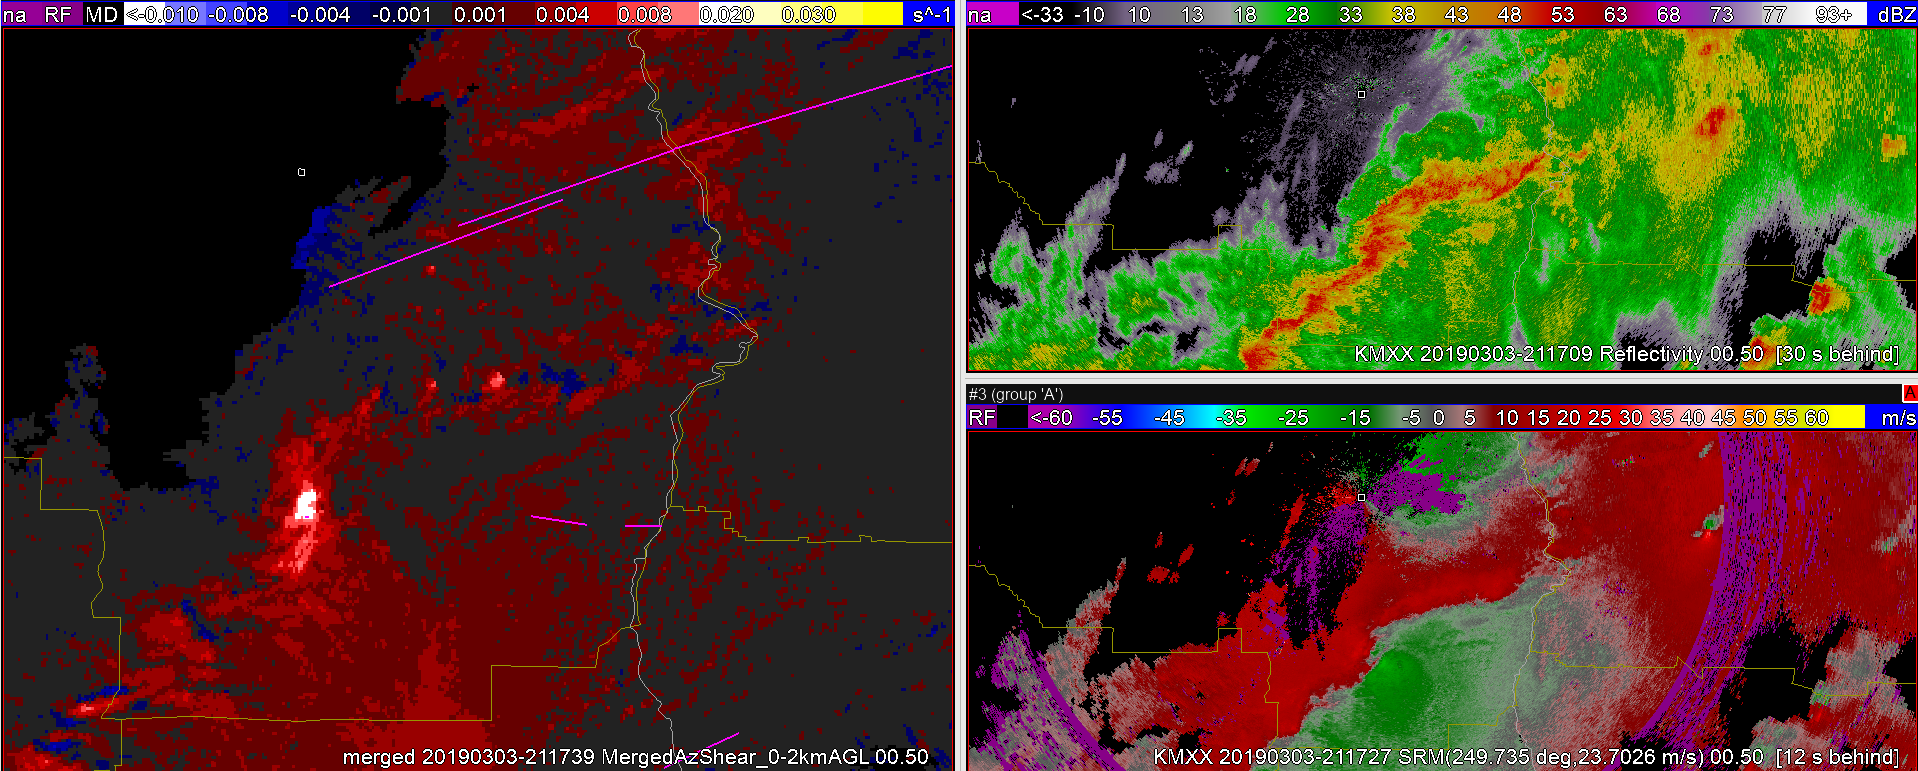
Couplet still is broad on SRM, but reflectivity and 0-2km AzShear still showing signs of organization. With the answer key downstream, perhaps this would be a good time for a tornado warning.
As we go another 10 minutes downstream, the couplet continues to organize along with reflectivity signature. SRM (bottom right below) showing a small gate to gate feature.
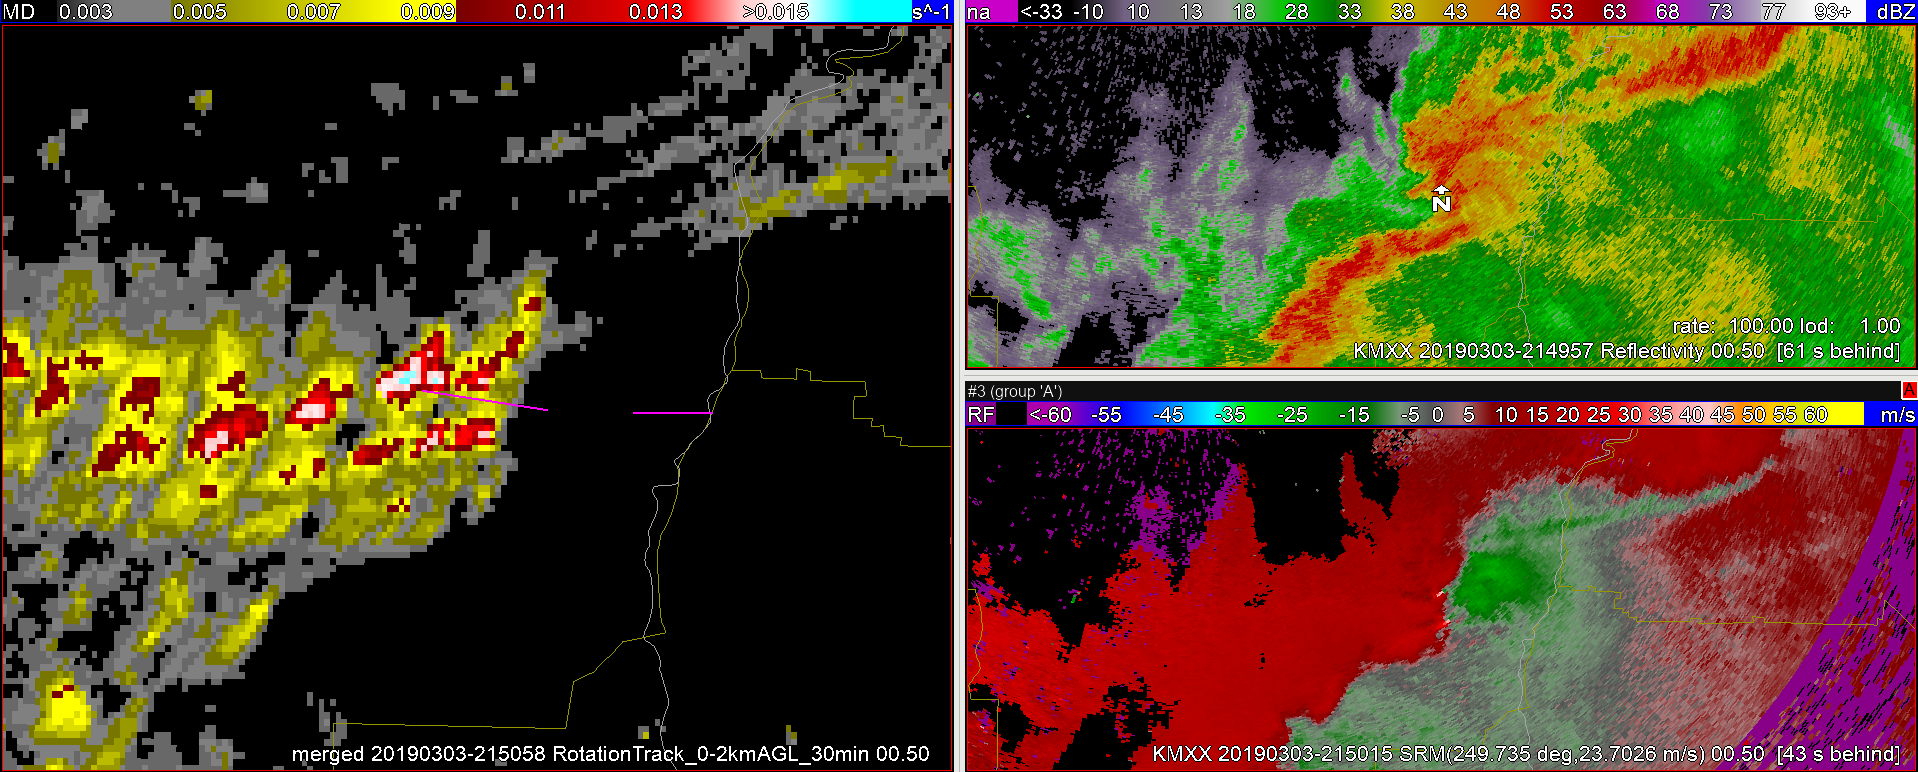
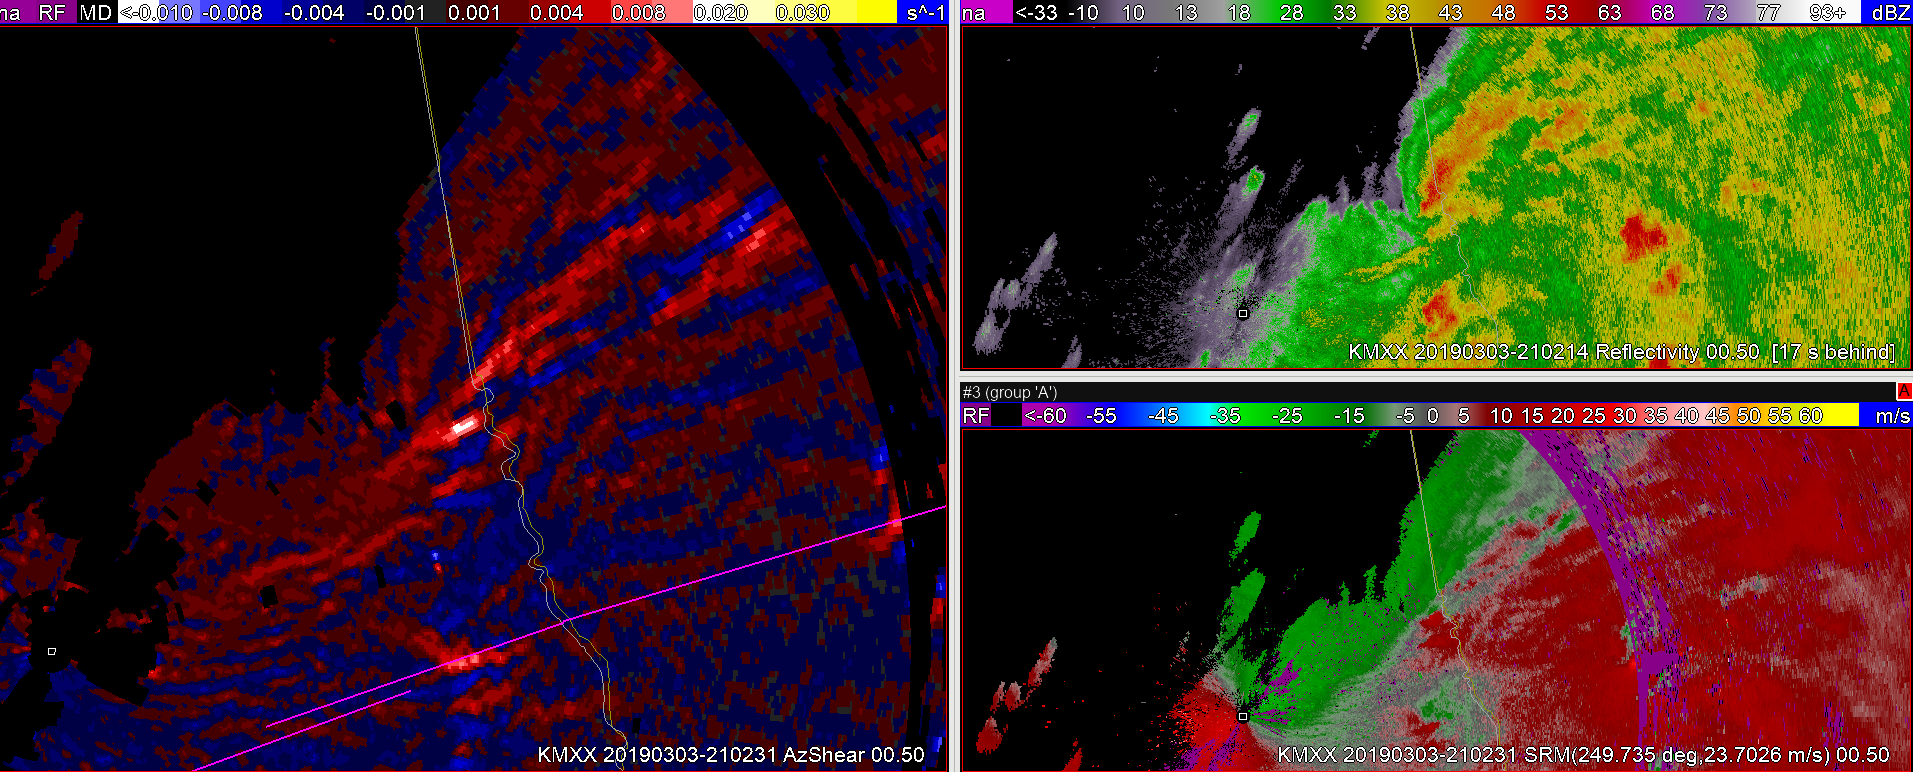
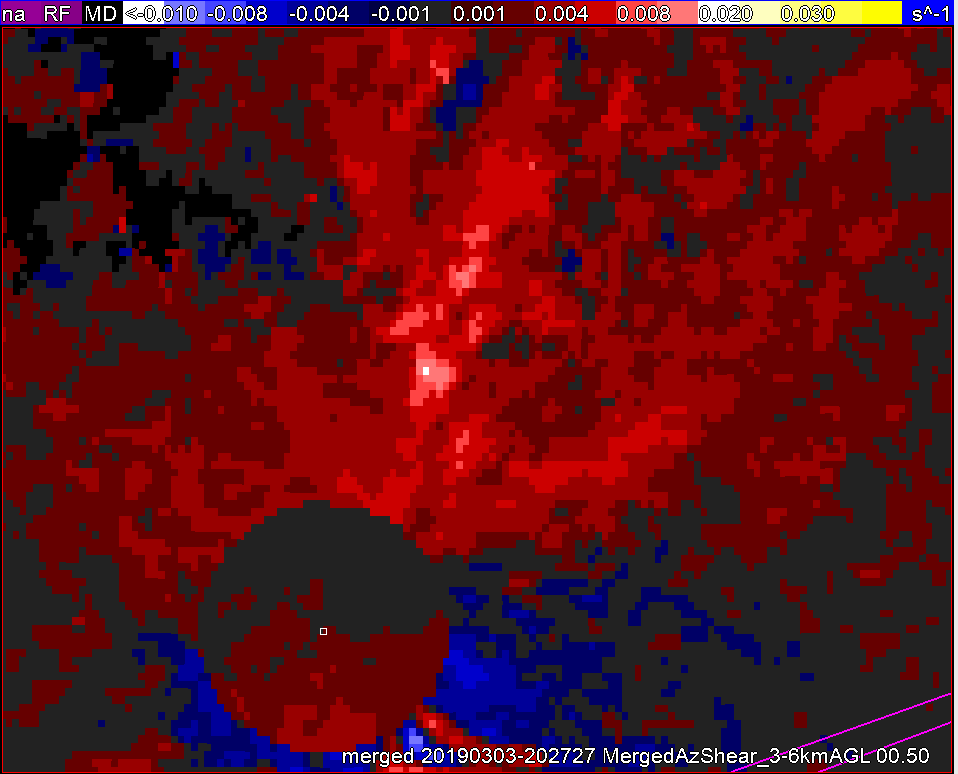
Another 10 minutes downstream and we see stronger gate to gate. LLRT product shows that ramp up as well as the other merged AzShear products.
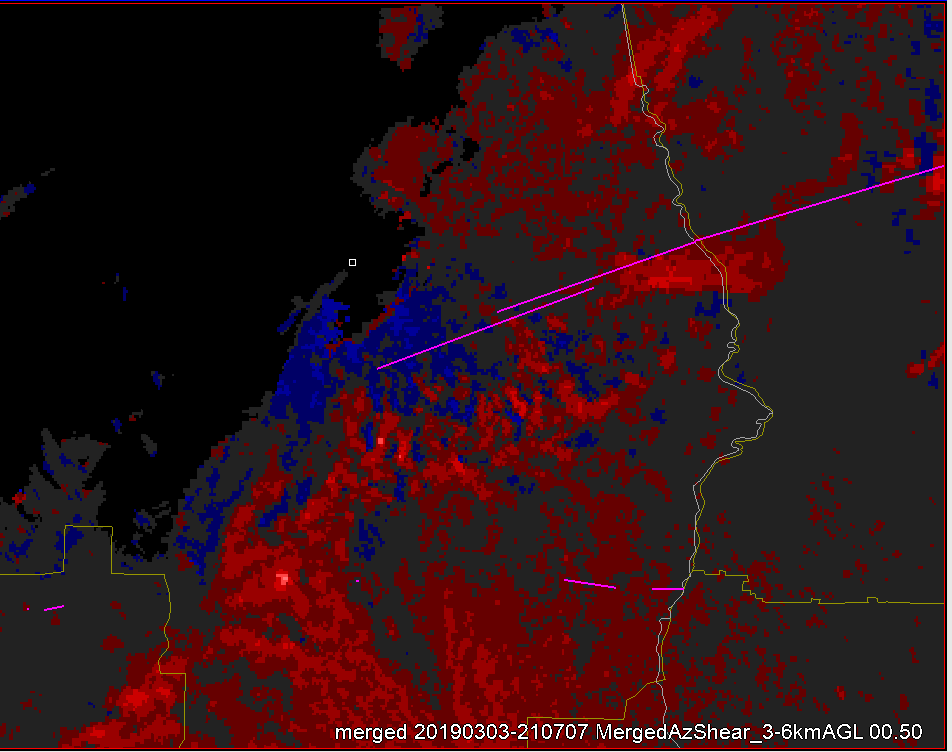
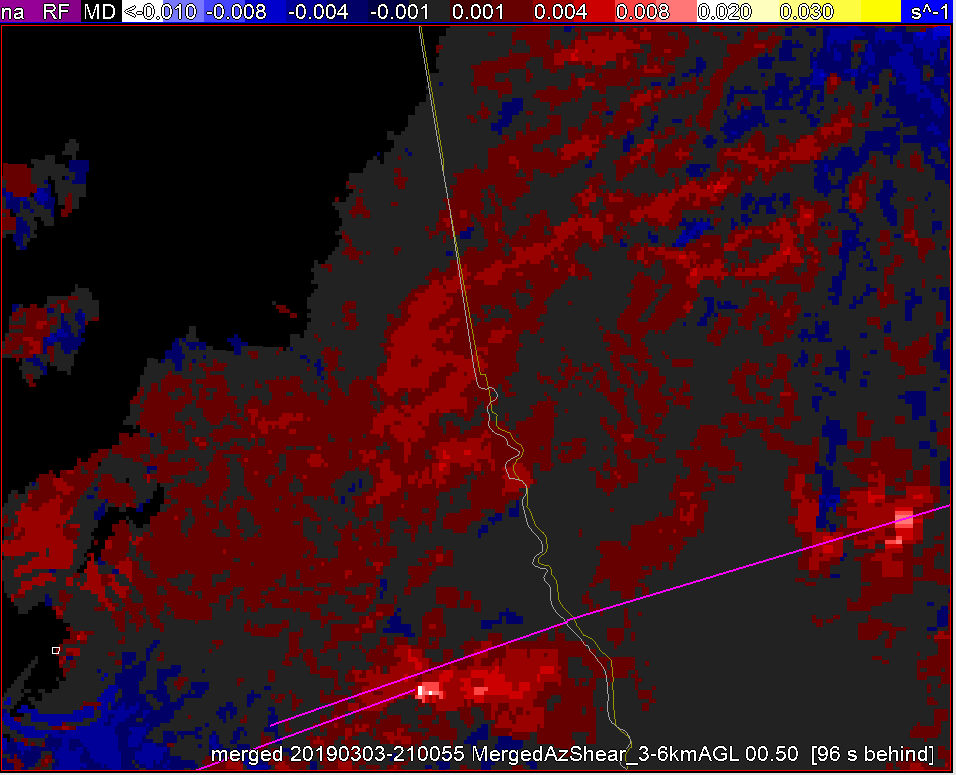
3-6km AzShear shows the cell that had caused an earlier short-lived tornado to the west starting to tighten up again. The SRM shows another convergence zone lining up perpendicular to the shear vector.
The 0-2km shear merged product may not be bad to use in this region between MXX and EOX.
A few minutes later that product shows a strengthening meso there, coupled with a broad couplet.
The next few minutes saw AzShear MXX 0.5 degree cycle up and down…pictured above is an up cycle. A look at the 3-6 km AzShear doesn’t show much happening aloft.
You still can see the tornadoes tracking to the south in that image though.
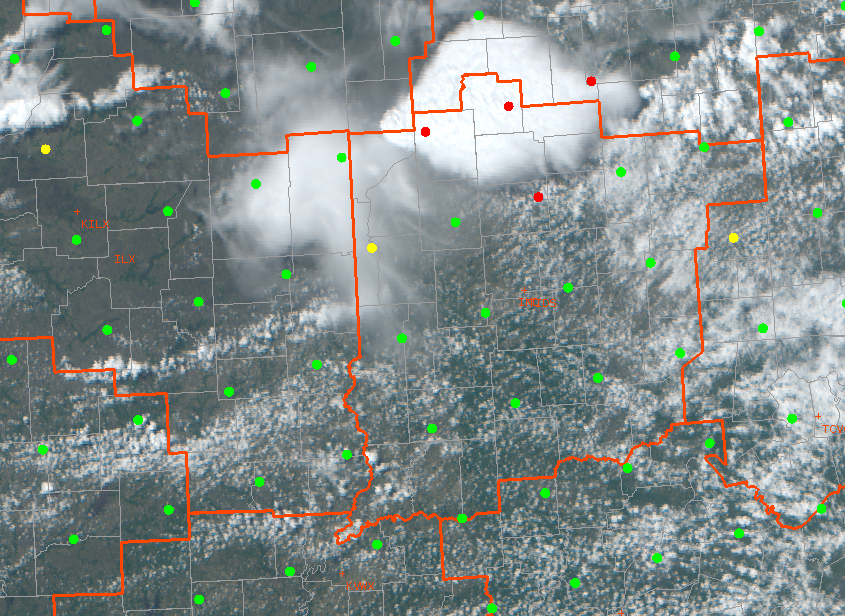
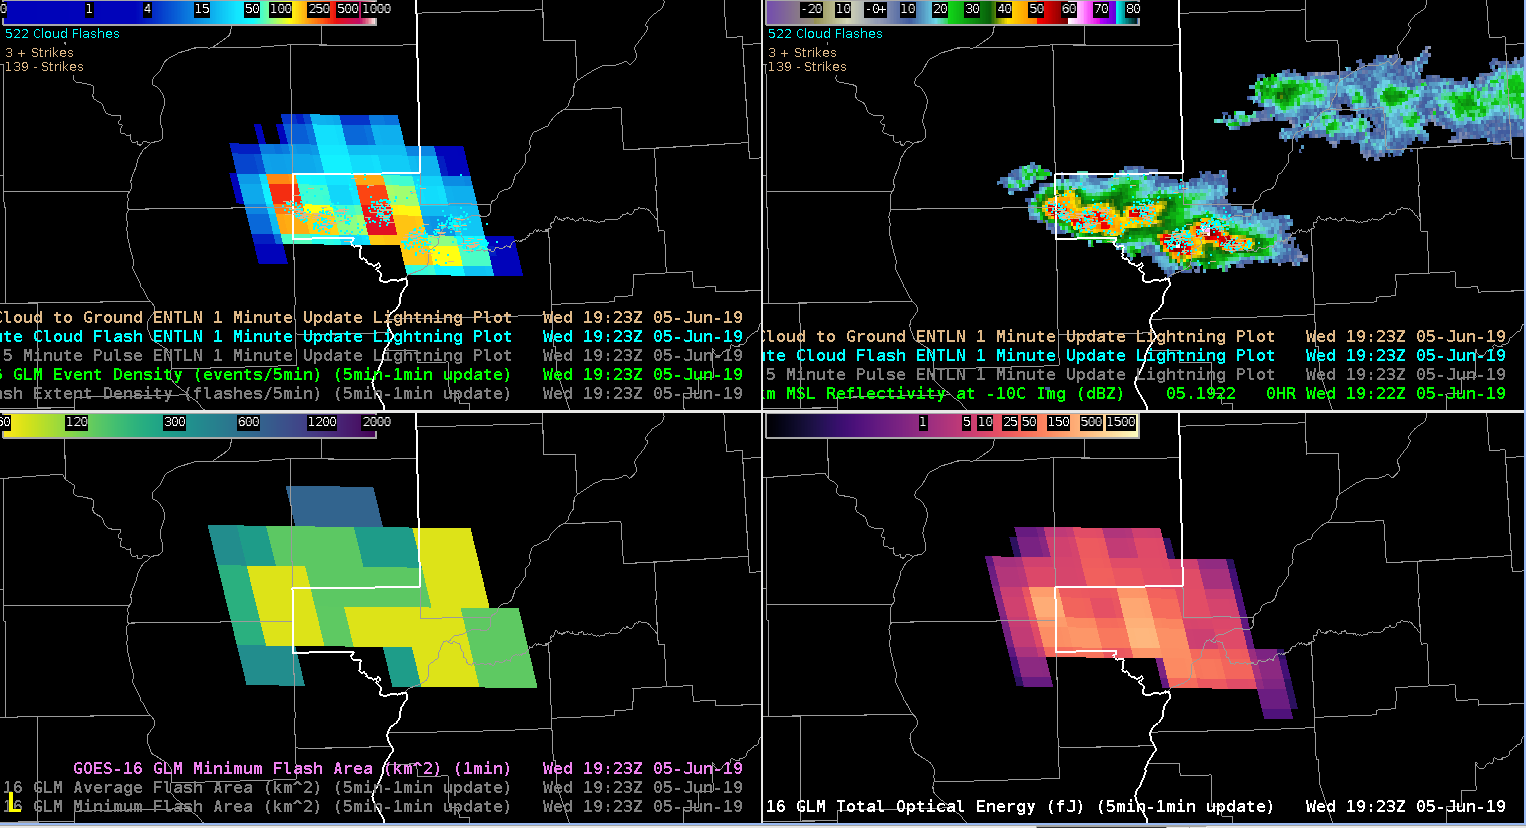
(Top Left): GLM Event Density w/ ENTLN Lightning Data; (Top Right): MRMS -10C with ENTLN overlayed; (Bottom Left): GLM Minimum Flash Area; (Bottom Right): GLM Total Optical Energy
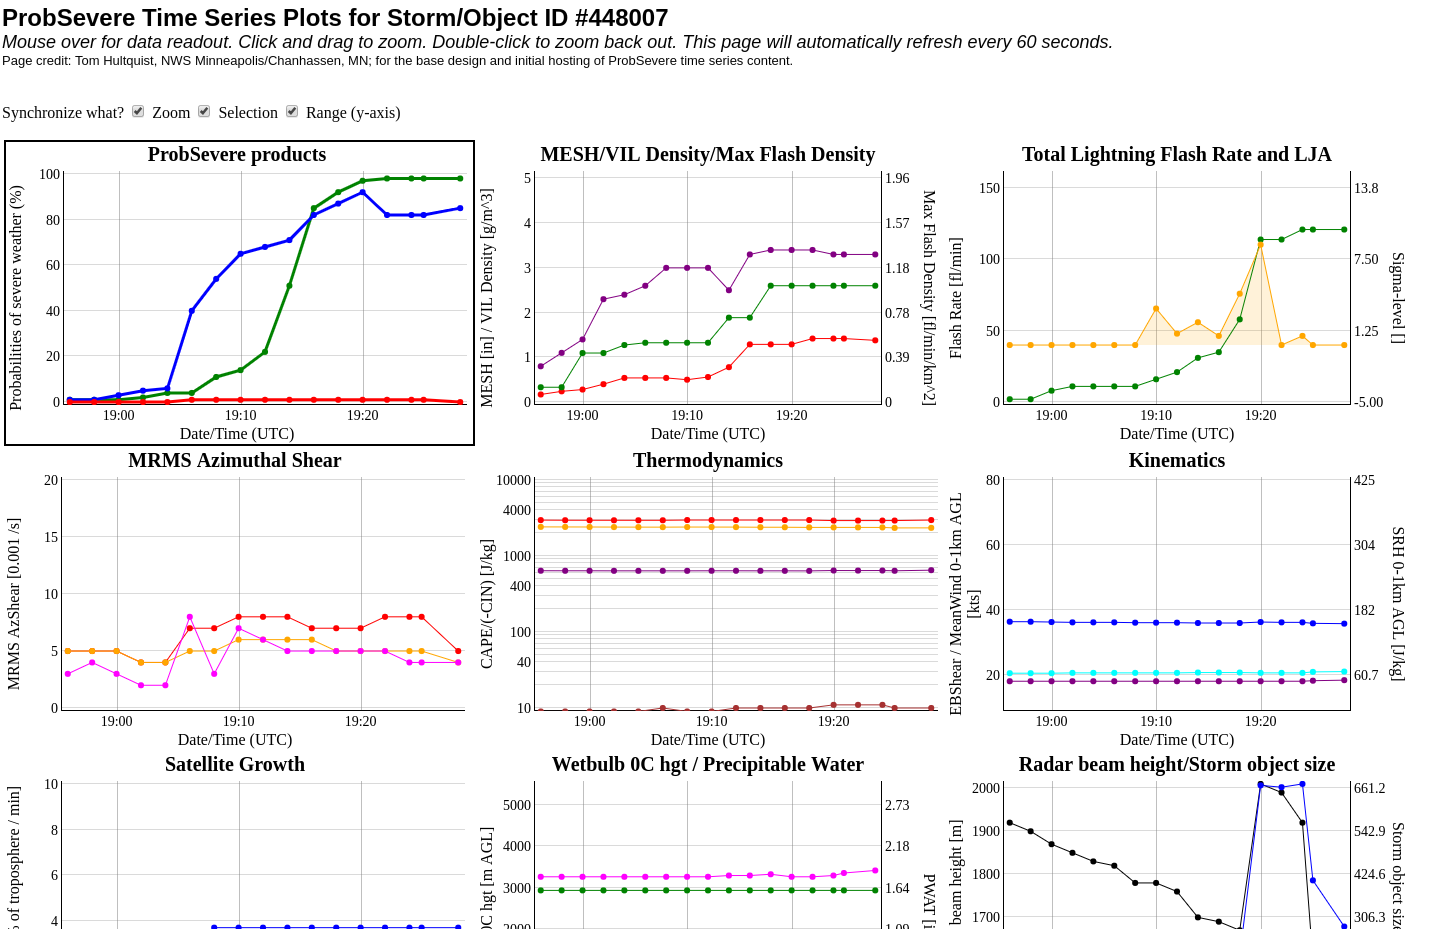
Had a unique opportunity to watch a line of strong to eventually severe storms ignite and strengthen rapidly along an old outflow boundary this afternoon using GLM data. It was interesting using the above 4 panel display to not only witness the ignition, but also the strengthening of each sequential cell along the line. By utilizing the GLM Minimum Flash Area (Bottom left) 1 minute imagery in a loop, we were able to sample the early-onset updraft core strengthening of each sequential cell along said line, and watch the event density jump up in accordance. It was also interesting to utilize the Prob-severe lightning jump data in time-series format to watch in a real-time basis. Suggested best practice would be to make these 4-panel layouts available for events like this.
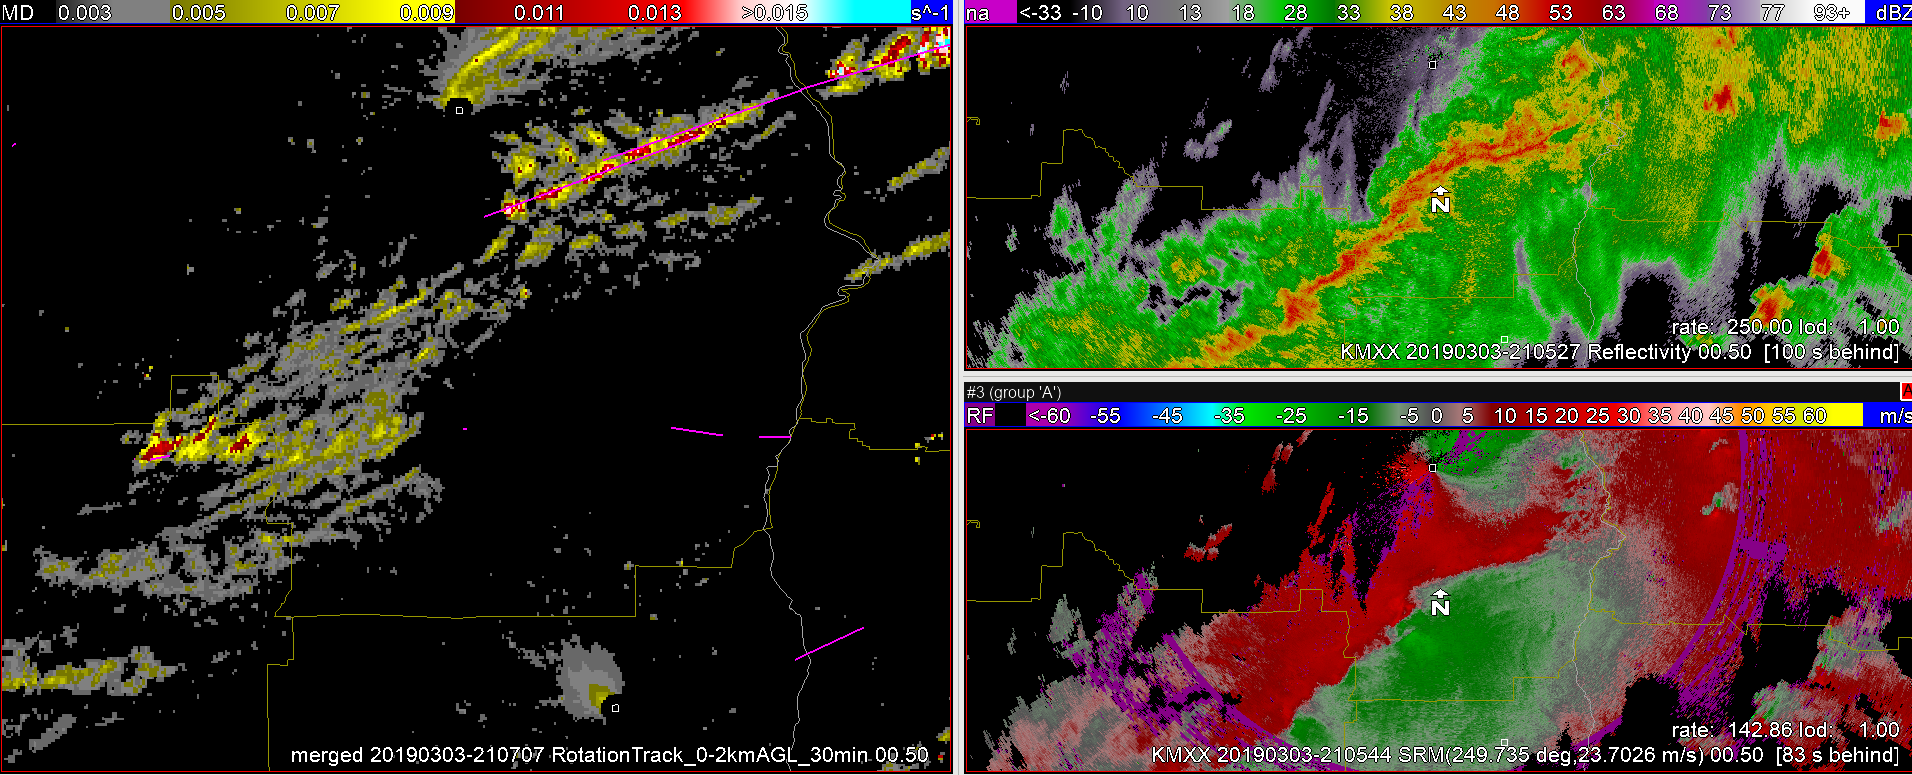
The northern line breaks still have some higher base tilt AzShear, but the couplets are not as strong.
Looking at the 3-6km AzShear, the southern of the two breaks has a higher value aloft, but the northern one is more shallow.
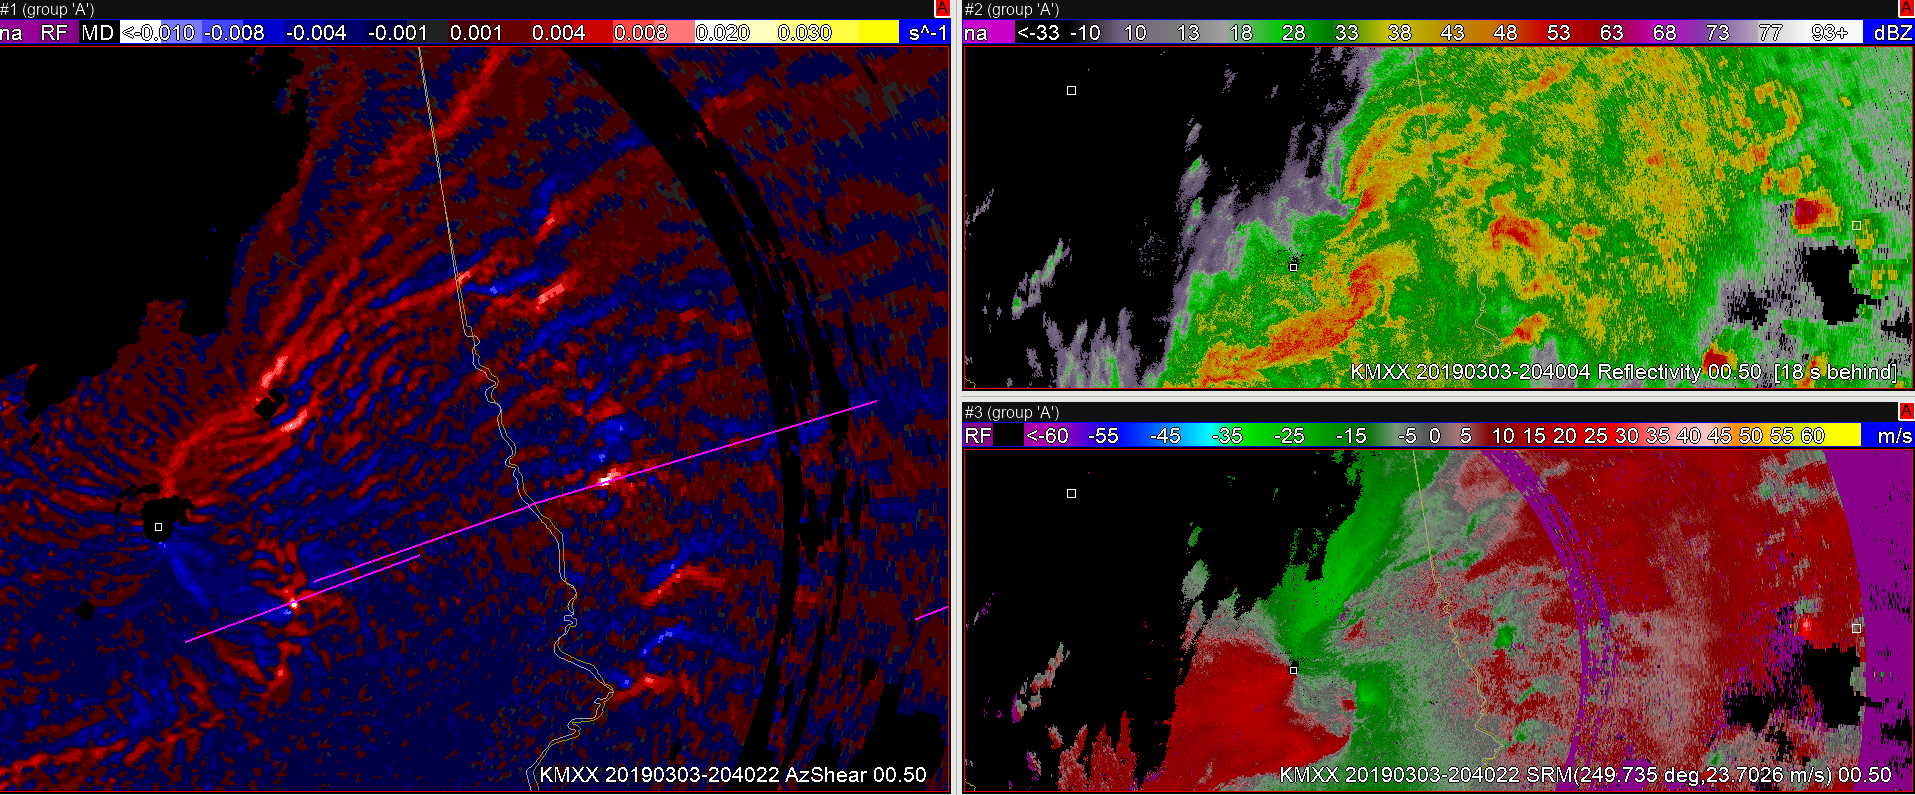
A few minutes later, the MXX 0.5 Tilt AzShear has a couple of maxima right in the reflectivity breaks mentioned earlier…and a little more in the way of couplets. If I had a SVR out on this part of the line, I’d be tempted to upgrade to TOR possible, given my history with weaker EF0-1 tornadoes along a line of storms.
Again a few minutes later, the AzShear product maxima have weakened as well as the couplets on SRM.
For analysis sake…I tend to like the Single Radar AzShear product over the merged products for low-level rotation…but did like the 3-6 km shear to see stronger cells rotating aloft. Figure the latter would be sampled well by multiple radars across the region, whereas the 0-2 km region is better for a single radar.
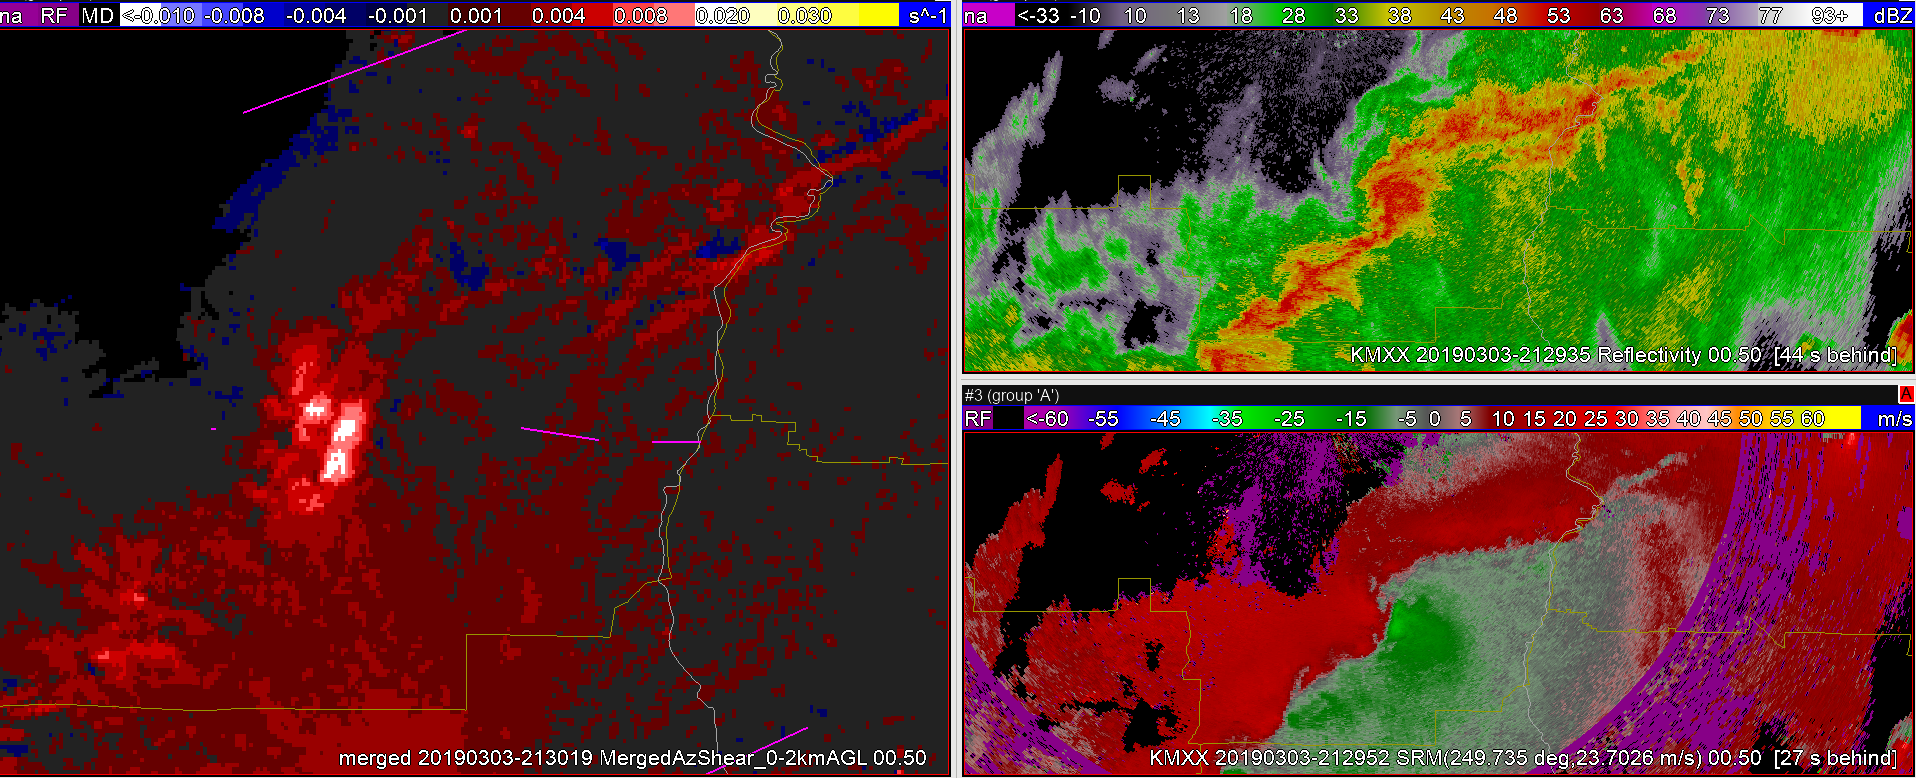
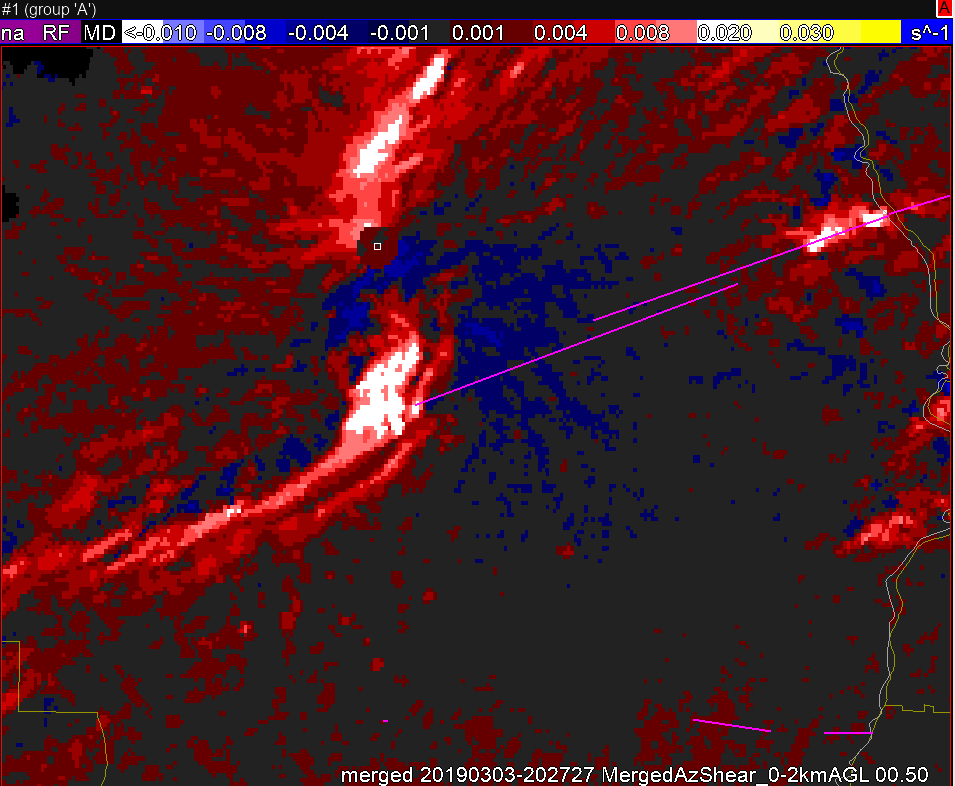
The MXX radar showed more of a ramp up ahead of the touchdown of tornado 2…evidenced in part from this MergedAzShear0_2km image. The white color started showing up about 5 minutes ahead of touchdown for this cell.
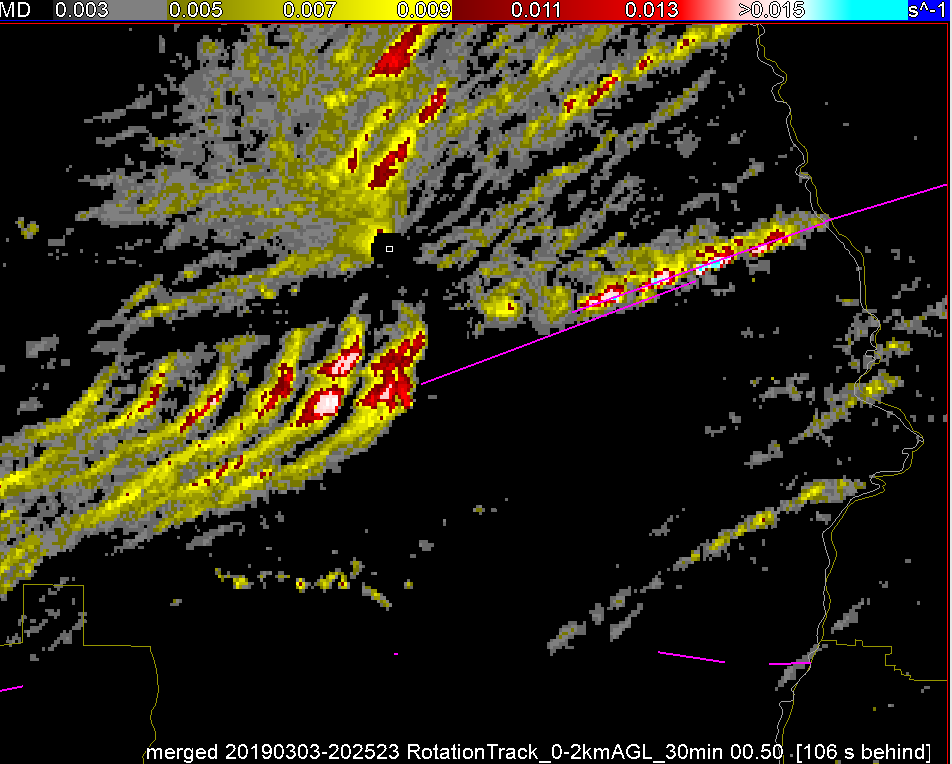
Meanwhile, Tornado 1 keeps tracking along nicely, maintaining a pretty strong intensity, indicated by the Rotation Track map.
Meanwhile, south of the two tornado tracks, a couple of smaller supercells have developed. They too show ZDR arcs, but AzShear is not as pronounced, either at the 0-2km or 3-6km ranges. In addition couplets on SRM/Velocity are much less noticeable.