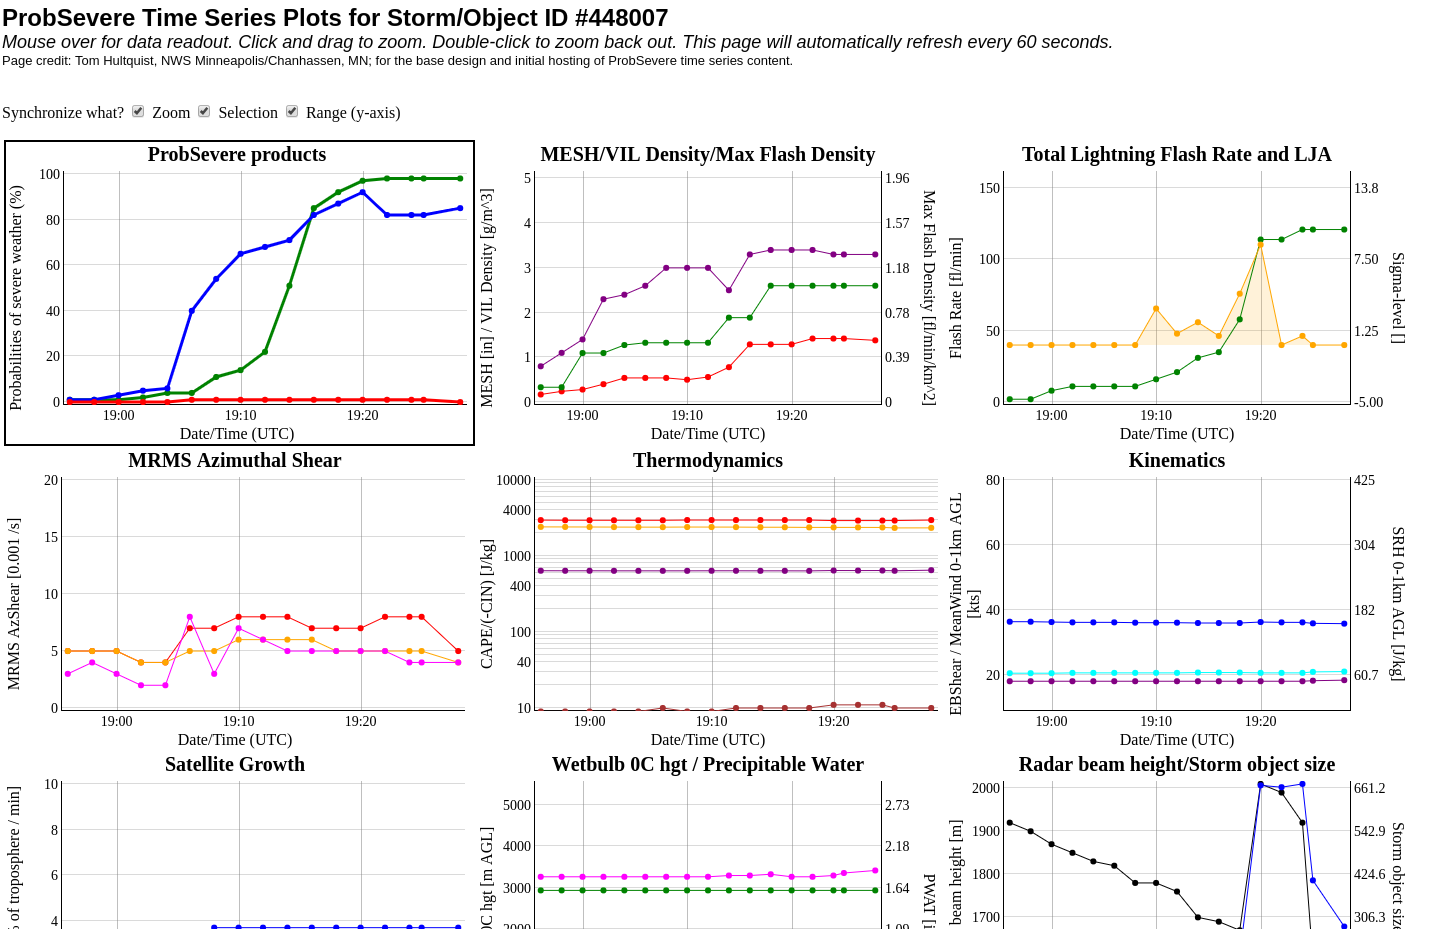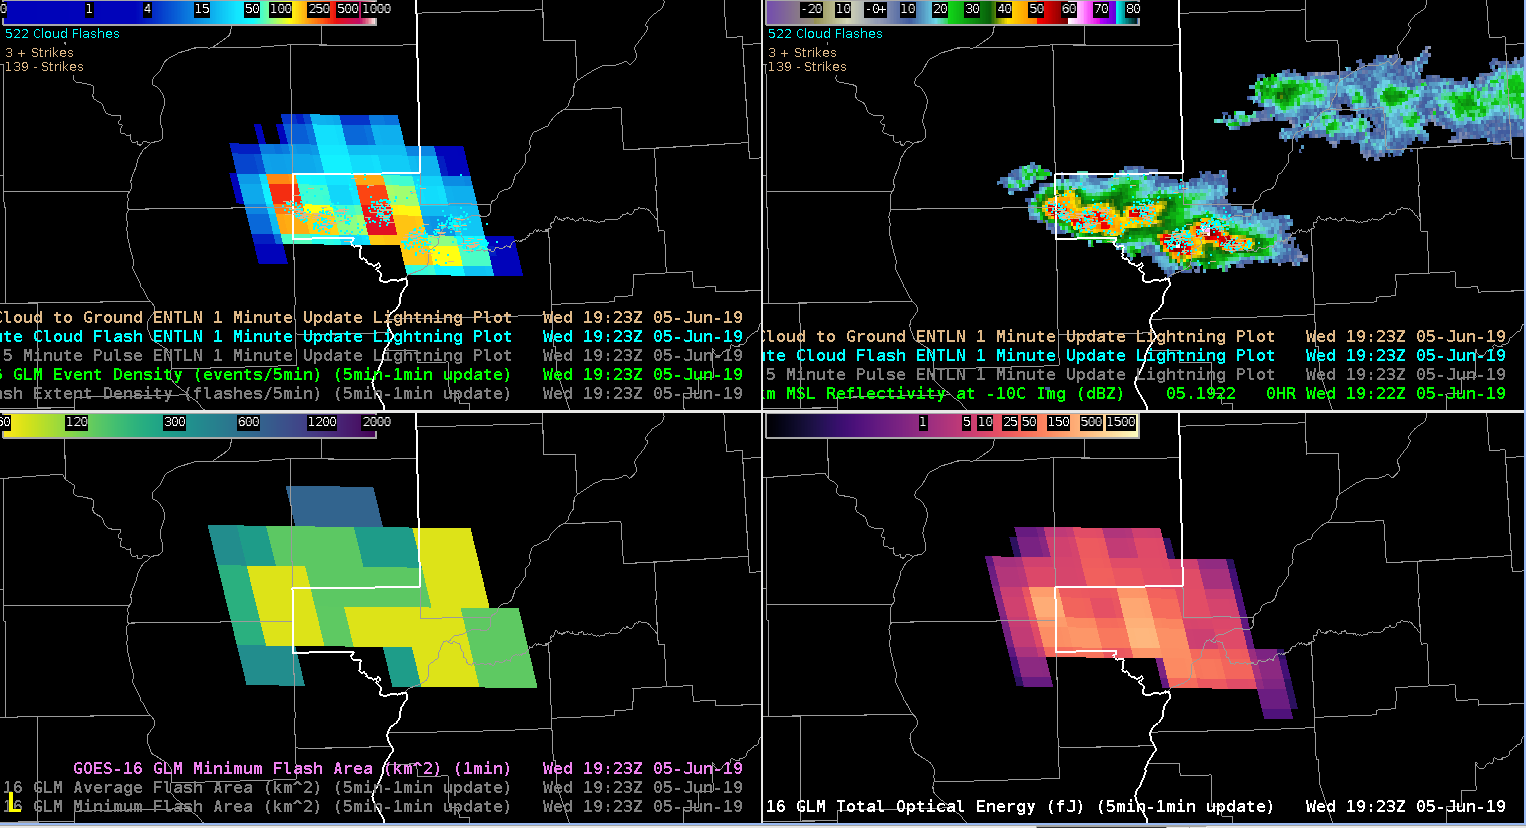
Had a unique opportunity to watch a line of strong to eventually severe storms ignite and strengthen rapidly along an old outflow boundary this afternoon using GLM data. It was interesting using the above 4 panel display to not only witness the ignition, but also the strengthening of each sequential cell along the line. By utilizing the GLM Minimum Flash Area (Bottom left) 1 minute imagery in a loop, we were able to sample the early-onset updraft core strengthening of each sequential cell along said line, and watch the event density jump up in accordance. It was also interesting to utilize the Prob-severe lightning jump data in time-series format to watch in a real-time basis. Suggested best practice would be to make these 4-panel layouts available for events like this.