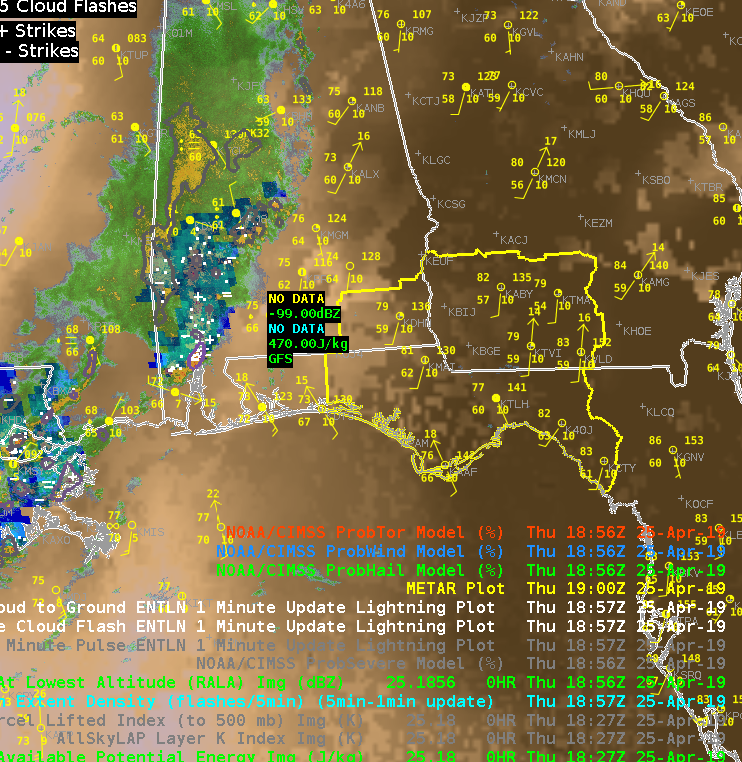
GLM does a good job at capturing large flashes that appear in the stratiform region behind lines of storms. In this case looking at the Total Optical Energy for 5 minutes with 1 minute updates you can see the large flash show up (the yellows and the whites). Reflectivity from KMOB and Visible satellite are layers under the TOE data.

This large flash has Minimum Flash Area values between 1100-1700 km^2 with the Average Flash Area anywhere between 2700-3600 km^2. This is a large flash that extends back into the stratiform region (the Anvil) of the cumulonimbus clouds. You can see the lighter precipitation on the RALA (Reflectivity at Lowest Altitude) product below. The darker blocky outlined area is the Average Flash Size with other variables in the 4 panel.

One important operator note is to be careful what you time match with the GLM lightning data. In this case another forecaster had time matched with the 1 minute meso-sector of satellite and because of errors in that data the large anvil flash was skipped in the one minute GLM data. If the GLM data is the focus of your analysis always remember to time match with it and then use other data (like satellite or radar) on those time scales.

-Alexander T.


 An 8 hour loop shows how the instability has built and gives more confidence that instability will continue to build ahead of the storms to our west.
  We did feel that LAPS CAPE seemed a bit underdone given the intensity of the downstream of the convection, so we took a look at the latest NUCAPS retrievals. We examined the point in the extreme SE of our CWA.
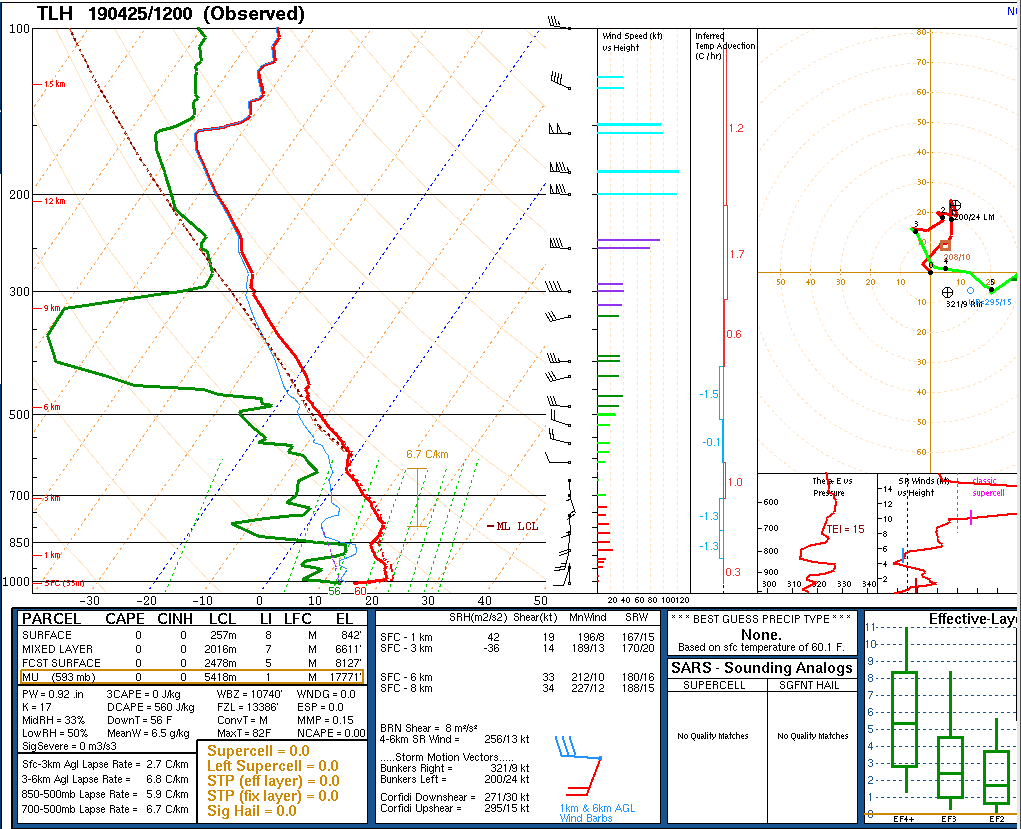
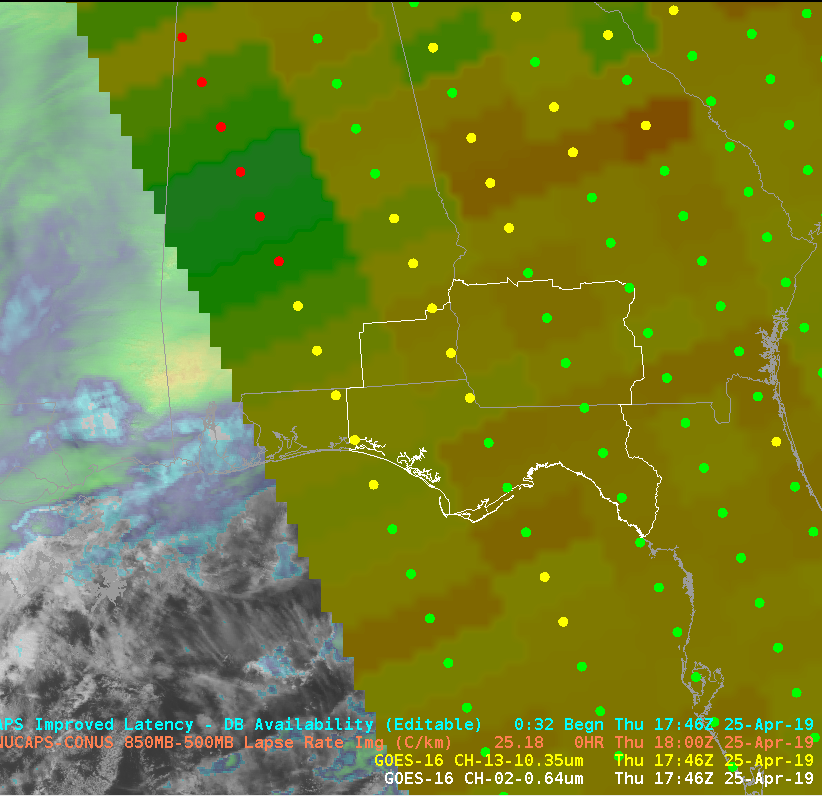 The boundary layer on the unadjusted sounding required some adjustment to match the nearest obs, but overall, seemed to capture the general profile well. I was initially skeptical about the warm nose just above 700mb, but a similar feature was evident on the 12z sounding from TAE. This feature may have an impact on storm intensity and potential hazards, and it would be particularly helpful to see how this feature changes over time.
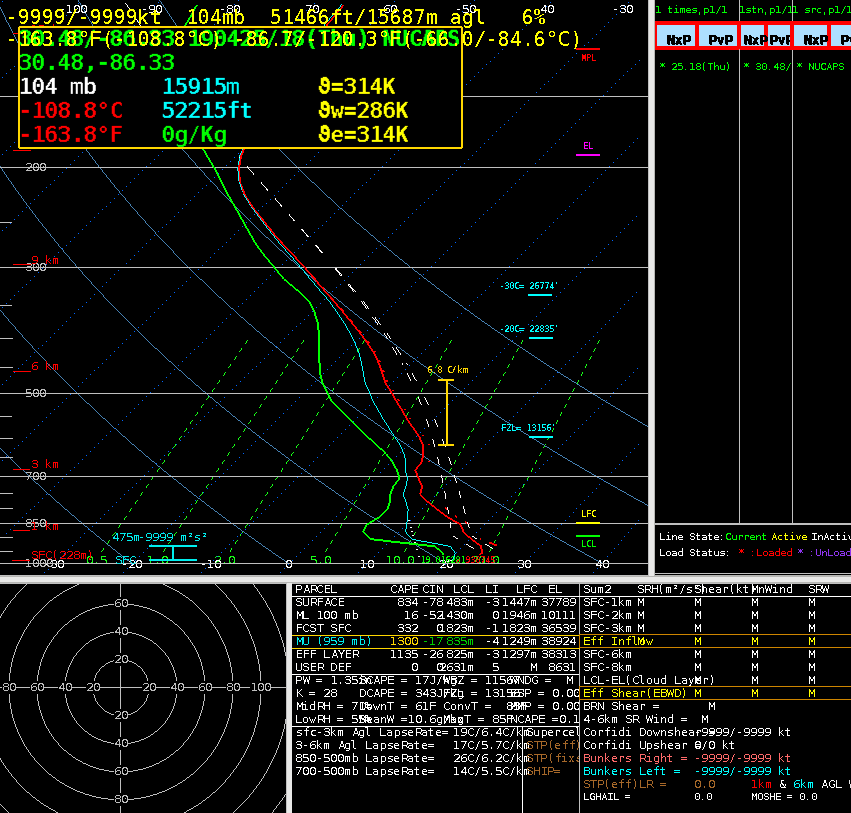
 Sandor Clegane