LMA ColorTable

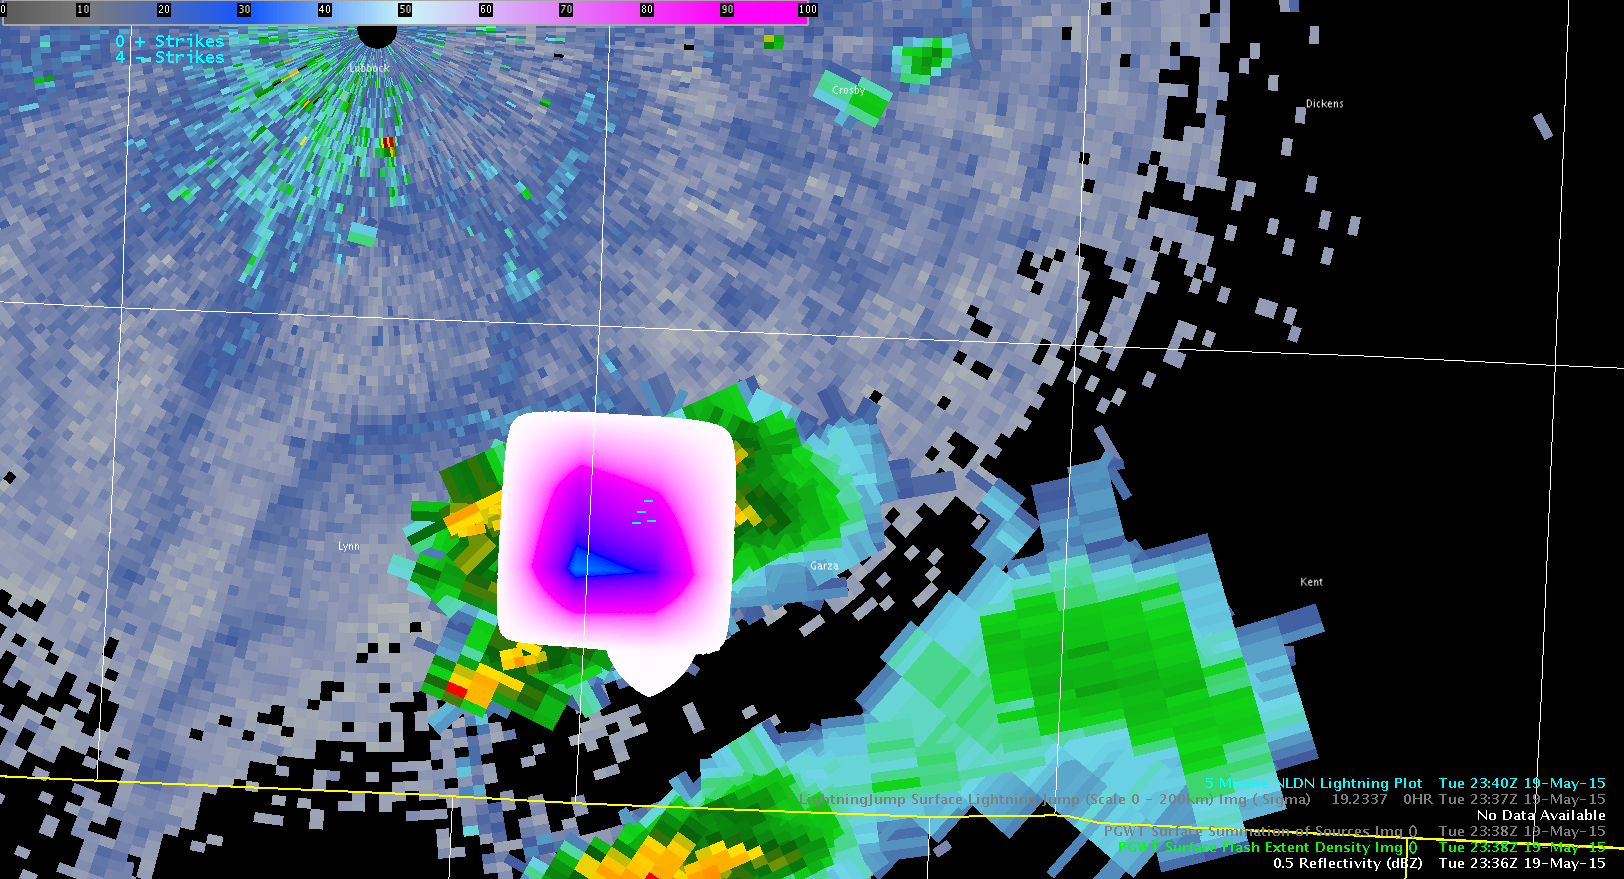
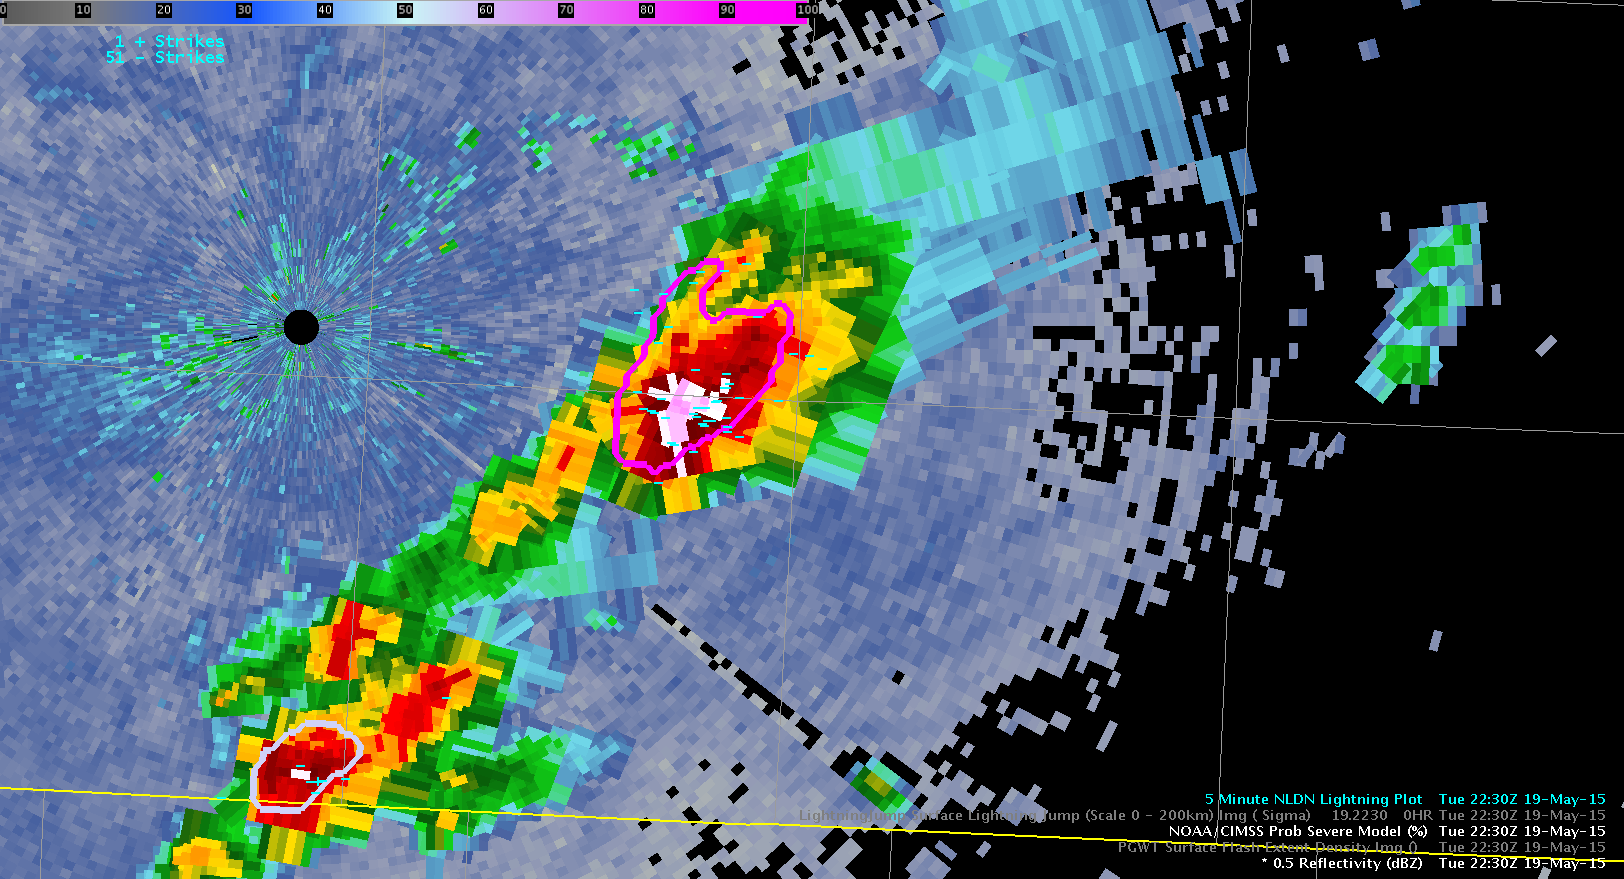
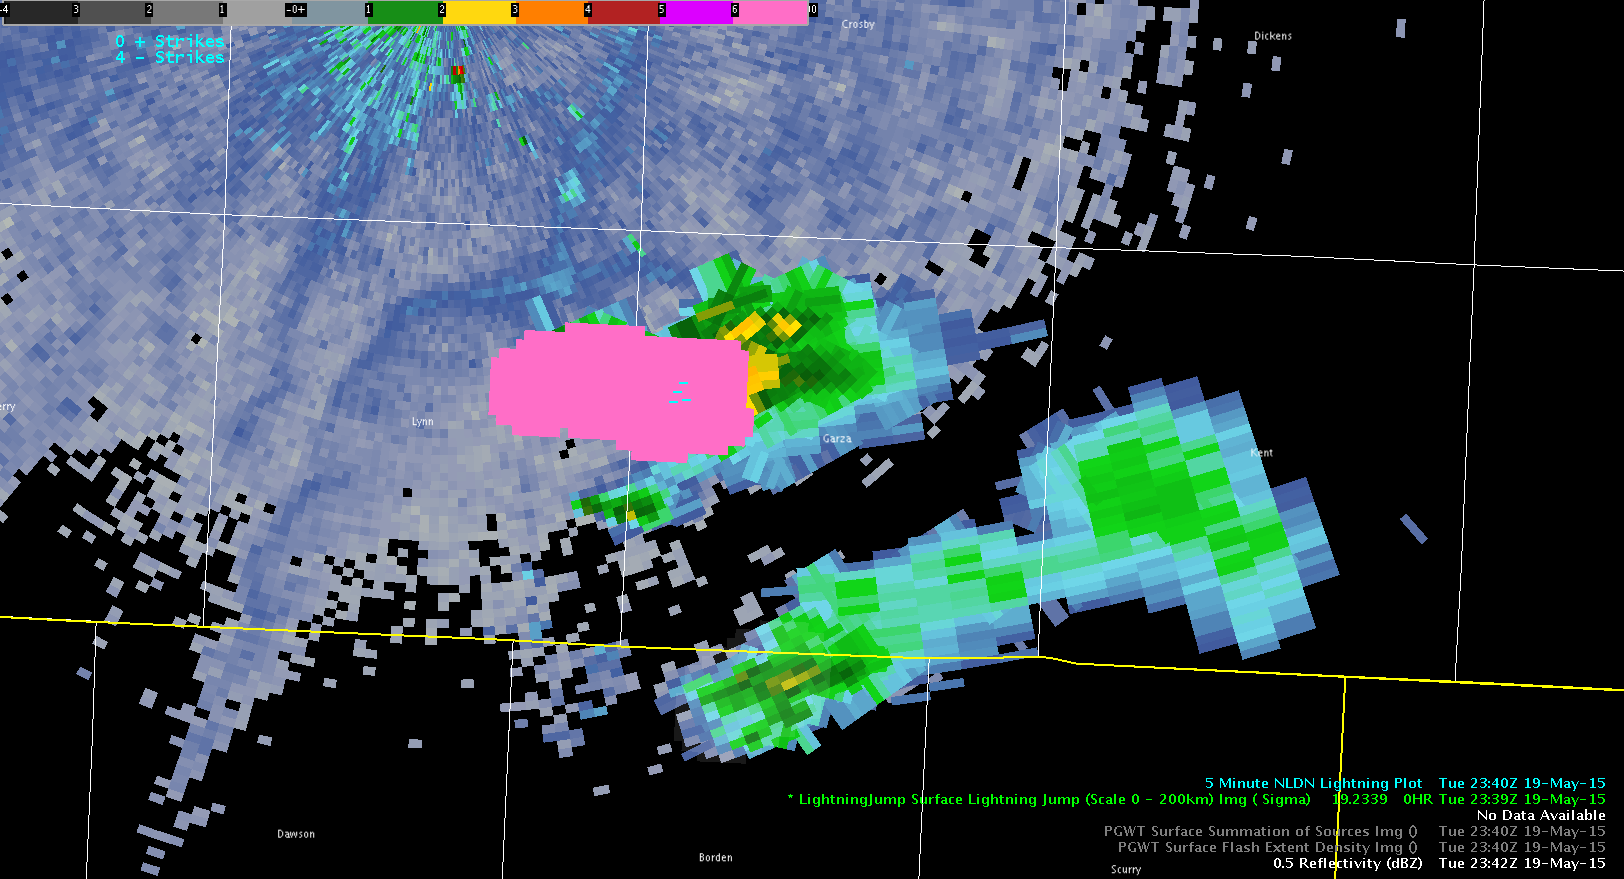
Out of the 3 available colortables for LMA data I prefer the “LMA_default” as shown below. It clearly highlights the greatest density. The other colortables have more gradation, highlighting lower values which don’t seem to be meaningful. The colortable with yellows/greens is non-intuitive – in other words, it not clear at a glance which colors represent higher values.

-snowstrm

LMA_ColorTable

Tags: None

ENI Flash Rates and Cell Track Show RM Supercell Change

A right-moving supercell with a tornadic history in srn OK experienced rapidly decreasing flash rates, followed by a sharp turn left. Flash rates dropped from 150, to 50% of their previous values, into the 70-80/min range. Having the Cell DTA rate tracking, the turn to the left, and out of the warning polygon, was clearly seen.

RightMoverChangesDirectionRocky


Phi1 Phi2

Tags: None

West Texas Soundings

First try at comparing modified soundings.

1. 12Z Midland RAOB modified to 30/18, yielding 4250 SBCAPE (3800 with ob at time of earlier NUCAPS)

519mafmod


2. Afternoon NUCAPS nearest LBB (designated CWA today) modified to 26/19, yielding 3900 SBCAPE.

LBB is appx 125 mi N of MAF, but in reasonably similar environment.  Despite other differences, feature at 700 mb appears in both.

519lubmodnucaps

3.  Next, NUCAPS afternoon sounding nearest MAF (in relatively cloudless area).  Not modified.0519mafnucaps

4.  And finally, for comparison, the observed 0Z sounding at KMAF.
SBCAPE at 4200.  The drying of the air at 600-800 mb since 12Z is reflected by intermediate NUCAPS soundings.

0519maf0z

-Holaday

Tags: None

GOES-R LAP Cape Retrievals Underestimated Today

For the afternoon, a more complex cloud regime was seen over northern Texas and into OK. GOES-R LAP algorithm struggled to correctly identify the CAPE gradients and values were roughly 30-50% of model and observational data comparisons. The data was not used to assess the instability.

PWRetr4Panel Screenshot-SPC Hourly Mesoscale Analysis - Mozilla Firefox

Tags: None

LUB boundaries

Overlay of LAP derived CAPE and SRSOR visible imagery at 23Z  shows the key boundaries in and near the LUB CWA.

One, N-S, slowly progressing east.  Another, stationary, oriented NW-SE, the air cooled by earlier convection with a northeasterly surface flow.

0519lubcapevis


-Holaday

Tags: None

Young County Severe Tstm – ENI cell tracking issues cont

2347 graham 8.0 degree

Severe thunderstorm warning issued for the cell above at 2350z…with close to 60 dbz at 40 kft. Warning mentioning 3 inch hail threat was issued based on predecessor cells in this region with similar characteristics.

Once again…because the ENI cell tracking was detecting this as 2 separate cells with each less than 40 strikes/min in close vicinity…no dangerous thunderstorm alert was issued. I would have missed the 1.25 inches hail report at Graham at 2357z. It was not until 00z that a singular cell reported greater than 40 flasher/min to send out a dangerous thunderstorms alert.  If these cell tracking had counted this as one storm…a dangerous thunderstorms alert would have been initiated at 2348z…which would have increased confidence in my warning at the same time.2348z ENI

The upward trend in lightning in the ENI lightning trace did increase confidence in severe though.

000z lightning trace

Also of note. The MRMS MESH in the CIMS prob severe did signal hail of 1 1/2 inches…which was pretty close to the reported hail size. The CIMS prob severe came in after that fact due to technical issues though.

Pickles

Tags: None

Lightning Jump Sigma 6 leads to…

A cell developing over the southern portion of LUB CWA showed a Lignting Jump value of 6 sigma. Upon further investigation it went from almost no lightning (2nd image below) to  a flash density of 35. The storm proceeded to quickly pulse down (with a  decrease in lightning). Thus…the sigma 6 in this case was not indicative of severe. The storm followed the same trend as most of the isolated convection in LUB today.

One suggestion with the Lightning Jump Algorithm/pGLM data is to be able to display a time series as is done with the ENI Lightning Data. Another idea to better gage trends in Flash Extent Density and Summary products is to show previous values when sampling with the mouse pointer (or a change in value from previous reading).


-snowstrm

PGLMDensity

Tags: None

ENI Flash Rate Values and Track Help In Tornado Warning

A tornado warning was issued on a strong storm which was intensifying with a slow ramp up in lightning flash rate from around 100 to ~200. The storm appeared to be bending its track to the east more (right mover) and this was confirmed with the use of the history DTA rate track of >50/min. This assisted me in drawing my warning polygon downstream (bent it more east [like Beckham]). The loop provides a summary of my thoughts and the tornado warning referenced is the second tornado warning issued at 2255Z.

Continue to find alerts are not useful and are more of a distraction – prefer the raw data displays. Feel the loop below is a very useful display for ETN data in the warning process. The cell tracking did struggle with expansion and contraction as the northern storm provided a larger polygon (merger). But, I was still able to gain useful trend data even with the bouncing cell polygon due to the merging.

RedRiver_CellFlashRates_DTARocky

Tags: None

SVR in AMA CWA at 2230UTC

Issued an SVR for a storm which has observed (estimated) 1″ hail and 60-65mph winds over an hour prior to this in Randall County. The storm maintained intensity as it continued eastward.  ProbSevere held steady at over 90% with MESH over 2″.

-snowstrm

ProbSevere

Tags: None