LMA detection before ENTLN?

Switching to Colorado, there was a storm that the LMA picked up on while there were no ENTLN data and a scan later only a few…

This is from 2303Z where the LMA was picking up on something.

2303Flash

Then at 2308, the ENTLN data is finally picking up on “something.” It is really hard to see in this degraded image but there is one negative CG strike and then 3 “pulses.”

2308lightning


I usually see “some” in cloud lightning before I see any LMA detection so this was interesting to see especially with such a weak cell.


Lauren13

Tags: None

More CI Detection

Here is another set of images showing some shower development (there is no lightning).

2130Z CI product

2130CI

2137Z Radar- not much to see, maybe “a” shower.

2137radar

2145Z CI product- the highest probabilities have moved east

2145CI

2147Z Radar.

2147radar

2200 CI has increased in some areas. The yellow is over 60% while the green is 50%

2200Sat

2156Z radar is showing some shower developing

2156Radar

2215Z CI…still showing moderately high probabilities

2215sat

2216 radar shows more showers

2216radar


What is interesting about this example is that even when showers started showing up, even some that are near or above 35dbz, the CI is still picking up CI’s on it. This is likely because the CI product actually stops at a certain glaciation rate which is roughly equal to 35 dbz. So CI doesn’t “know” about the radar and the dbz levels. It just shows that even though CI may still be showing probabilities, there could still be something on radar.


Lauren13

Tags: None

Prob Severe vs. Tstorm Alerts Near Tampa

A few rounds of storms have moved through Tampa Bay this afternoon and evening. I have been monitoring another round of development on a 4 panel showing Prob Severe, reflectivity, and Earth Networks alert data with lightning track. While Earth Networks has had issues with over-alerting, this product was the first to alert to a developing strong storm. The boxes from Earth Networks are overlapping and confusing as it appears lightning data is being pulled from the same storm, but parsed into separate tracks. These alerts were posted at least 45 minutes before Prob Severe indicated 77% probability of going severe in the next 60 minutes.  Reflectivity did a better job that prob severe hinting, at least, at the chance for thunderstorm growth.

UFFSU

eni prob reflectivity

Tags: None

Dangerous T’Storm Alert

Storms continue to move through the Tampa Bay area.  Storms continue to display a high degree of electrical charge. Alerts from the Earth Networks lightning guidance remains on. As these storms move slowly to the west, one notices a tremendous amount of alerts. The photos below show dangerous and significant thunderstorm alerts in the bottom right page. You can see that there are a number of alert boxes present at 2100z.  The times associated with these boxes all expire after 2115z.  Yet, these boxes come and go so rapidly that they are really useless, disappearing when lightning ramps down it appears. It just lacks reliability with its current display.

UFFSU

2100z ENW dangerous tstorm box 1

2115z  ENW dangerous tstorm box 2

Tags: None

NUCAPS Sample

Tested NUCAPS sounding for southeast Idaho.  The point used is circled.  The visible image was close to the sample time, but there may have been some cloud contamination.  Adjusted the surface observations upward based on the nearest MesoWest surface observation.  It was difficult because a lot of the lower points needed to be adjusted to keep it realistic.  The instability seems a little high, but it could be localized.  Will see how the thunderstorms in the area develop over the next few hours.

Screenshot-CAVE:PIH - D2D -3

Update: This thunderstorm moved over the sampled area about two hours later.  It peaked at about 55-60 dBZ Composite Refl and had a NOAA/CIMSS Prob Severe Model reading of 24% at that time.  The 5-minute ENTLN Lightning 3 km grid peaked at 11 with this storm.  There was no ground truth to verify what happened there.  But will note the complex mountain terrain in that area and how difficult thunderstorm modeling and forecasting is in Western Region (with local effects, etc.).  This was a decent test.

Screenshot-CAVE:PIH - D2D -4Screenshot-CAVE:PIH - D2D -5

-Champion

Tags: None

Damage Reported in Cape Coral (Sig #3 using ProbSevere)

ProbSevere prompted a third significant weather advisory. In this example, the probability increased from 13% to 74% in 10 minutes:

Florida_Sig3-1 Florida_Sig3-2 Florida_Sig3-3 Florida_Sig3-4 Florida_Sig3-5

The base data confirmed strong winds and small hail would be possible with this storm.

Cape Coral Police reported several trees and power lines down in Cape Coral and South Cape Coral areas. They estimated the damage occurred between 3:40 PM and 3:55 PM.

This is another example where the trends in ProbSevere can be extremely useful to warning forecasters to find storms that need further integration (“all-tilts without looking at all-tilts”).

Polarimetric Researcher

Tags: None

Cell No Longer Being Tracked in Time Series

The way the current time series is plotted makes it difficult to determine when the cell is no longer being tracked (i.e., the flash rate falls below a certain threshold). One way to see if it is no longer being tracked is to look at the Pt/time and compare it to the product time in the legend. If the product time in the legend is ahead of the Pt/time, then the cell is no longer being tracked and no more data will be added to the time series plot. Perhaps there could be a way to show that the cell is no longer being tracked so inexperienced forecasters could quickly determine this.

CellTrackOver

Ertel

Tags: None

NUCAPS Soundings ahead of and behind CF

The NUCAPS soundings available in AWIPS-II are generated from the CrIS and ATMS instruments aboard the Suomi NPP polar-orbiting satellite. A swath of soundings are available over generally the same locations at roughly the same times each day. On Tuesday, the swath over the east coast with a timestamp of 1815Z was available in AWIPS-II around 1930Z. This is great timing, as it falls between the 12Z and 00Z RAOB launches, providing an update on the thermodynamic environment.

Today, one group was operating in the Sterling CWA where the threat for severe weather was quite low, but a cold front was quickly making its way through the region. The 1815Z NUCAPS pass was timely as participants were able to view atmospheric profiles on both sides of the front (Fig 1).

20150512_NUCAPS_points-DC_edit
Fig 1: NUCAPS sounding points with surface obs and visible satellite imagery overlayed. Centered over Sterling CWA.

Selecting a sounding ahead of the front, the surface conditions (temperature and DP) needed to be adjusted to match actual surface conditions (Fig. 2). Additionally, the bottom few points of the sounding were smoothed out to make a more realistic profile LL profile. Upon making these changes, instability was still present ahead of the front given decent MUCAPE and SBCAPE. However, MLCAPE was virtually nonexistent, and a possible inversion was apparent between 700 and 850 mb, perhaps the reason for a lack of robust convective activity.

20150512_NUCAPS_points-DC_east_1_crop
Fig 2: Modified NUCAPS sounding ahead of CF.

Selecting a profile behind the front and making the necessary changes to the lowest parts, one can certainly tell that the front had passed through the area (Fig 3). With significantly cooler and drier air aloft (in addition to at the surface) the atmosphere is now completely stable.

20150512_NUCAPS_points-DC_east_2_crop
Fig 3: Modified NUCAPS sounding behind CF

This was a good example of how a forecaster can use the timely NUCAPS soundings to identify the existence and locations of boundaries when they might not be so obvious from other guidance.

– Bill Line, SPC/HWT Satellite Liaison

Tags: None

CI Detection of a Thunderstorm

Updated at 430pm.

So the first thing we thought when we started to write this was the CI was having an issue “tracking” the cells because I couldn’t tell which cell actually developed out of all the cells the CI was indicating. This is part of the problem because some cells can get above 35dbz pretty quickly and between 15 min satellite scans.


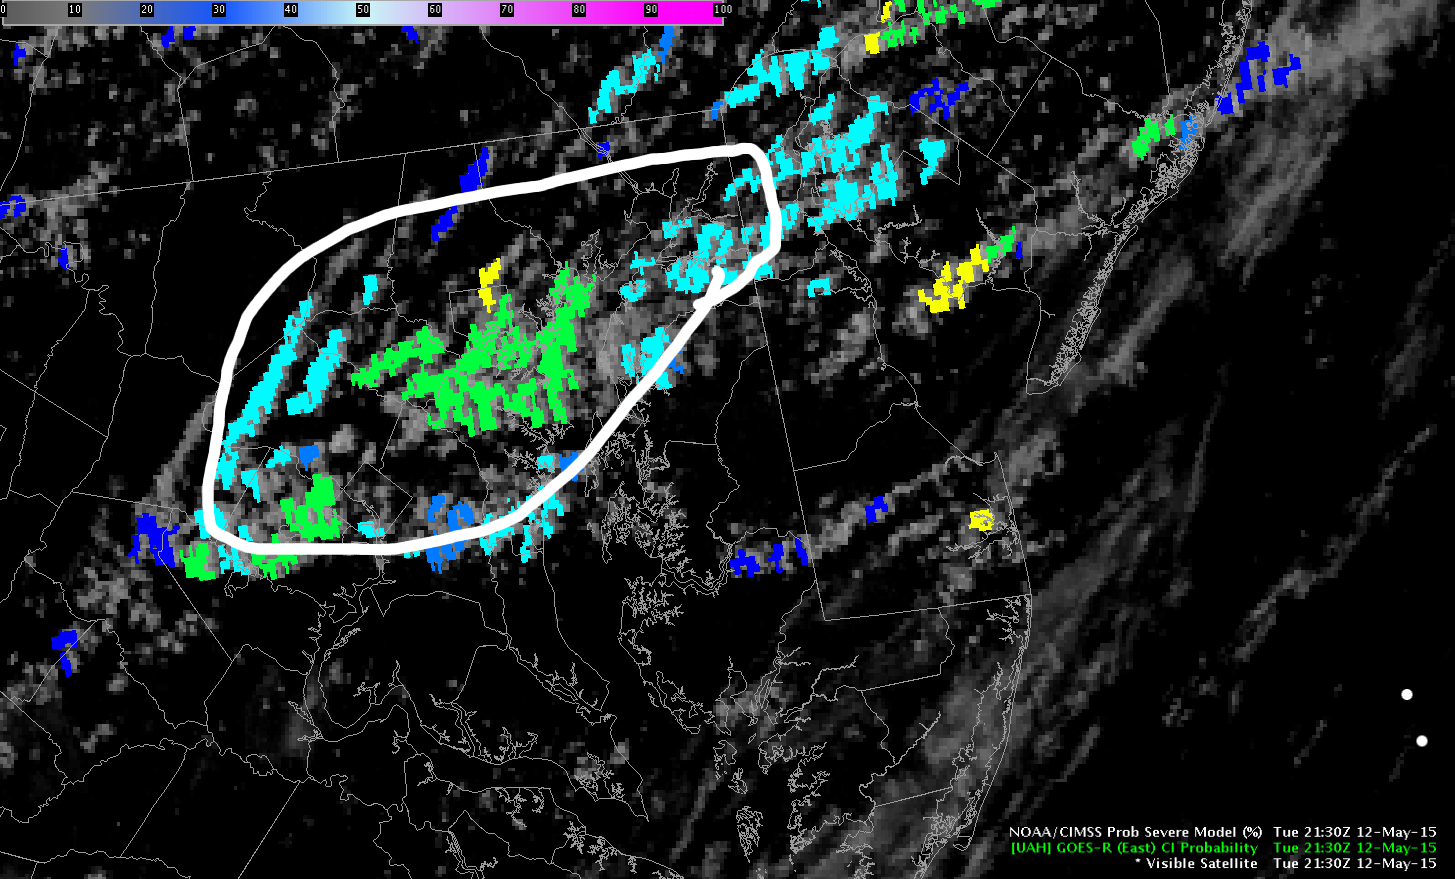
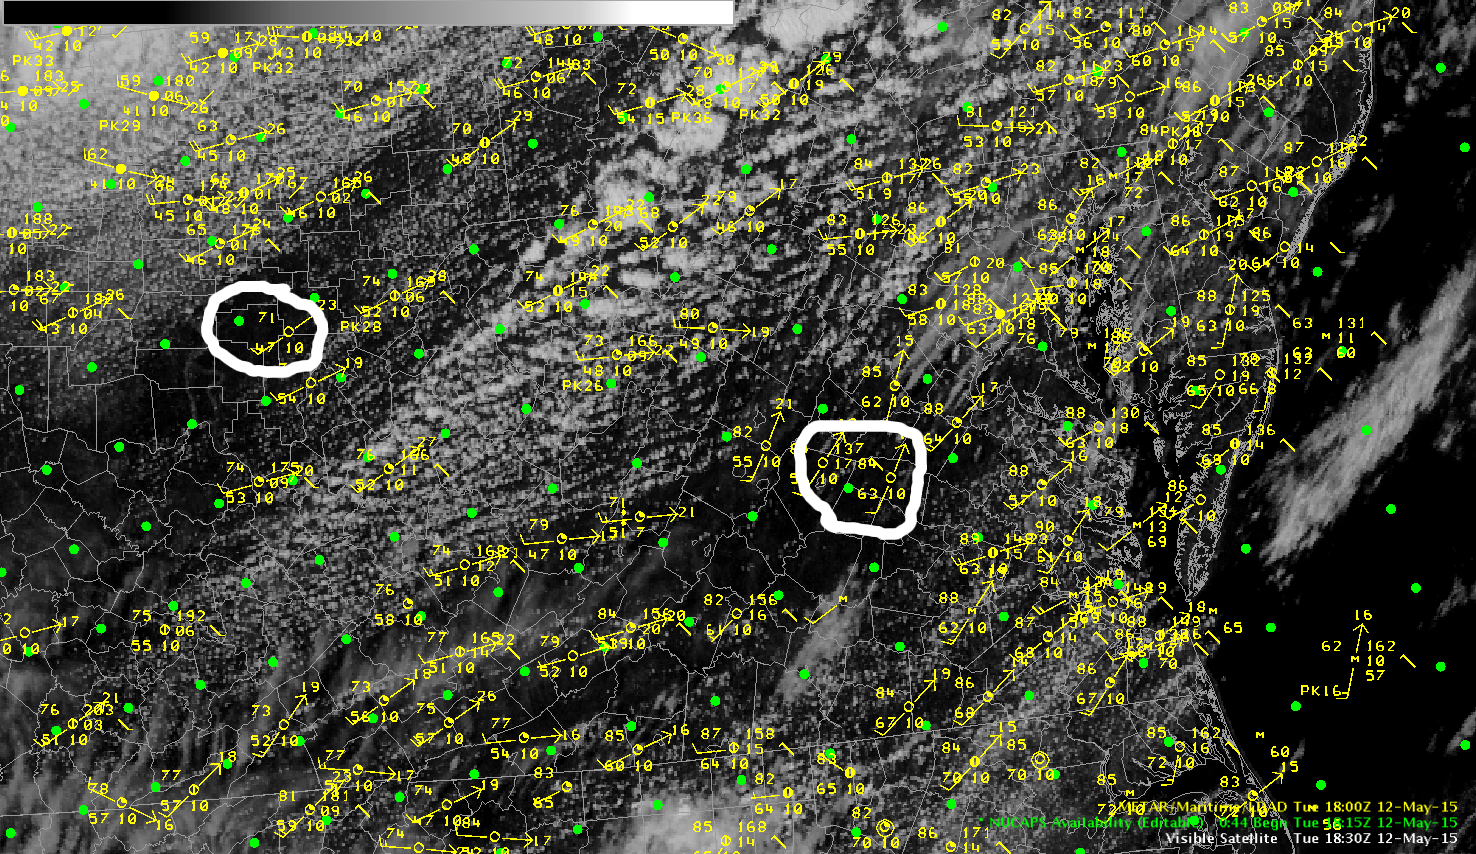
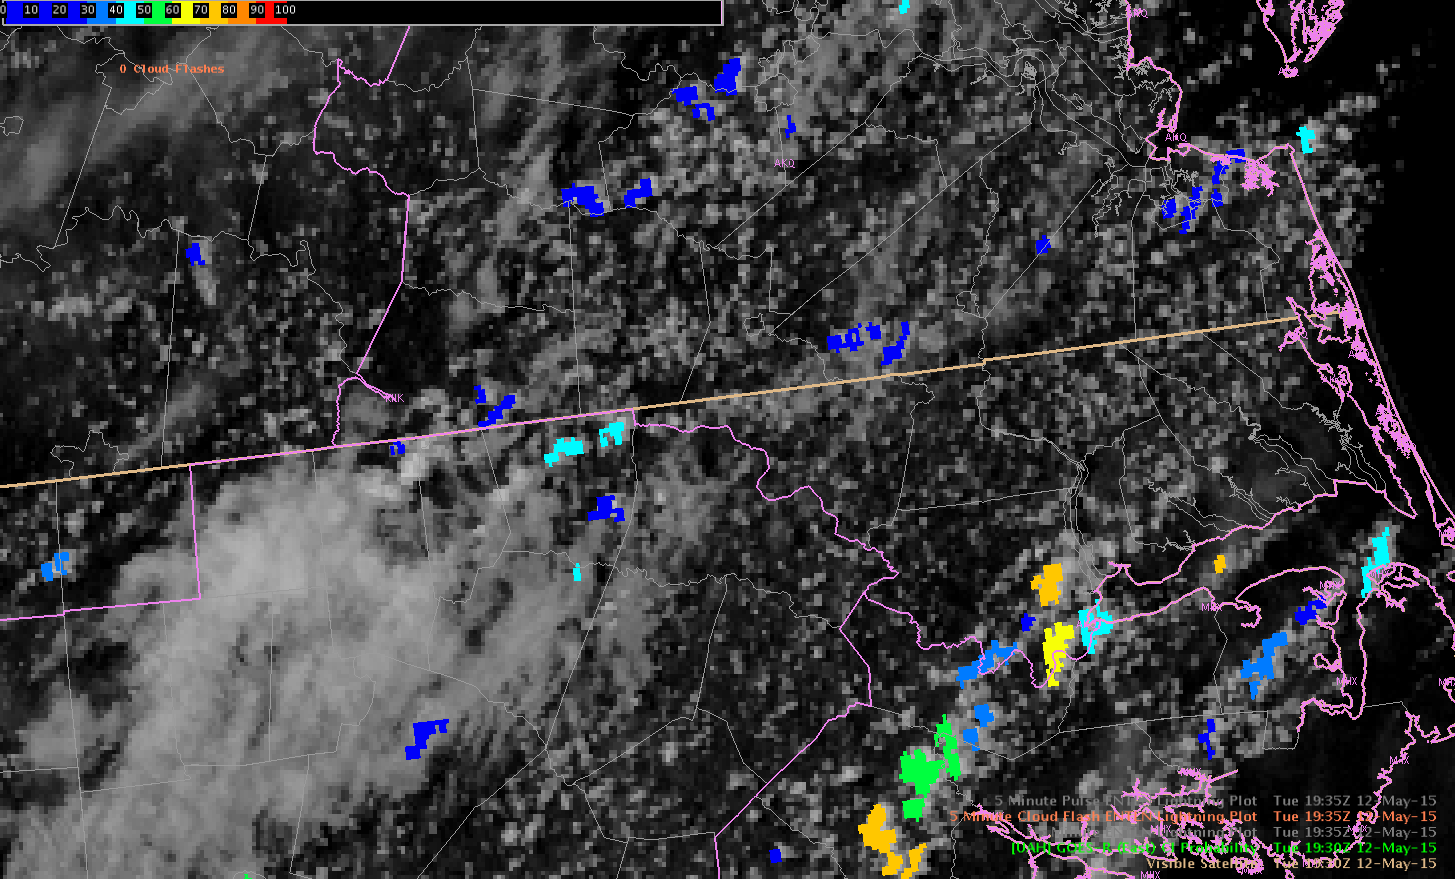
Here at 1930Z, look at the area of light blue CI on the VA/NC border.

1930CI

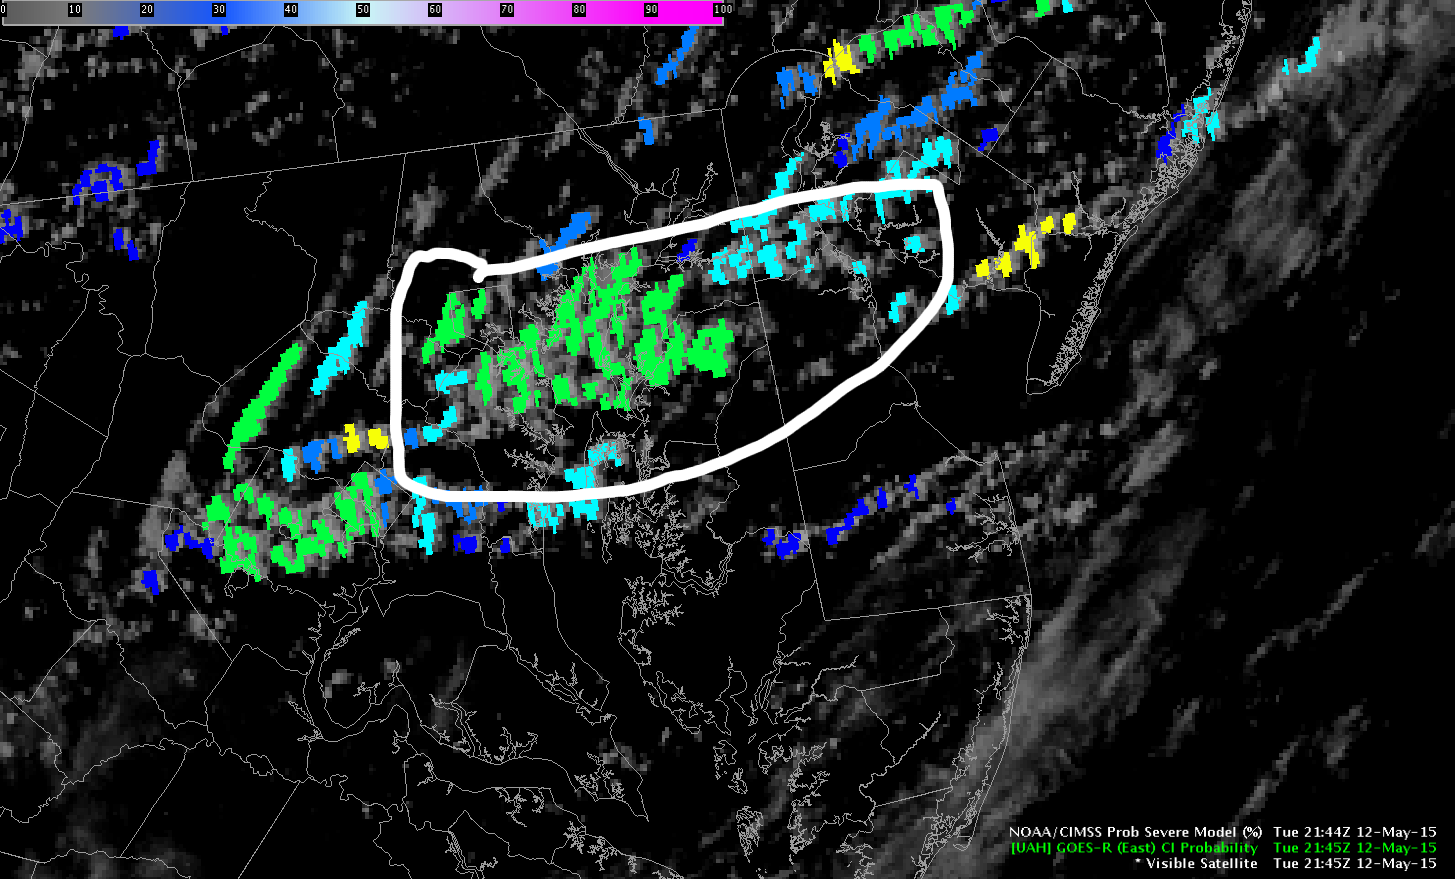
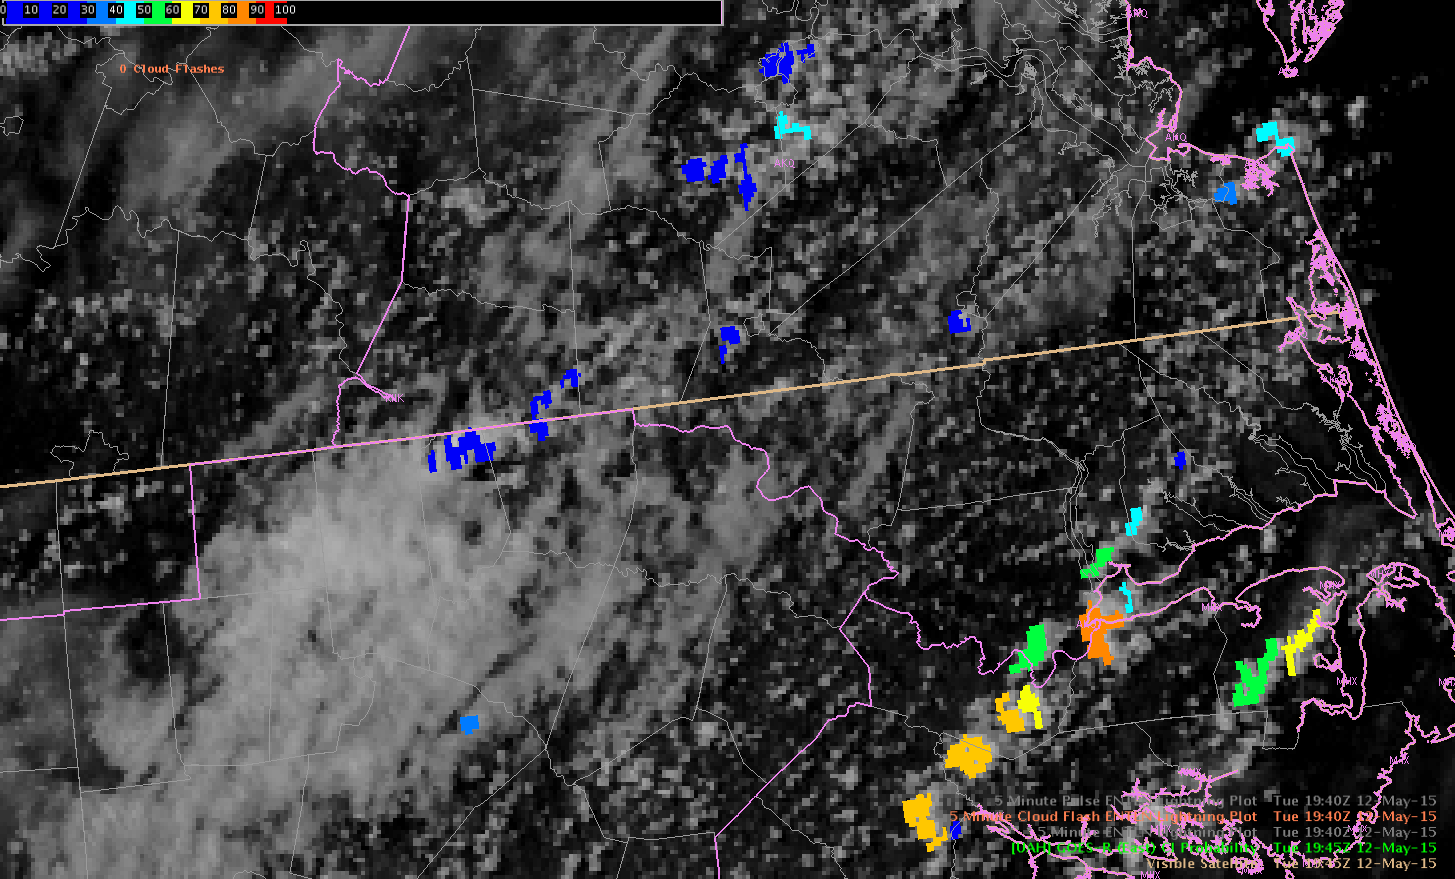
Next, at 1945z… it is hard to see because I didn’t circle anything but the dark blue is actually farther north, different cells, than where the previous light blue was indicating.

1945CI

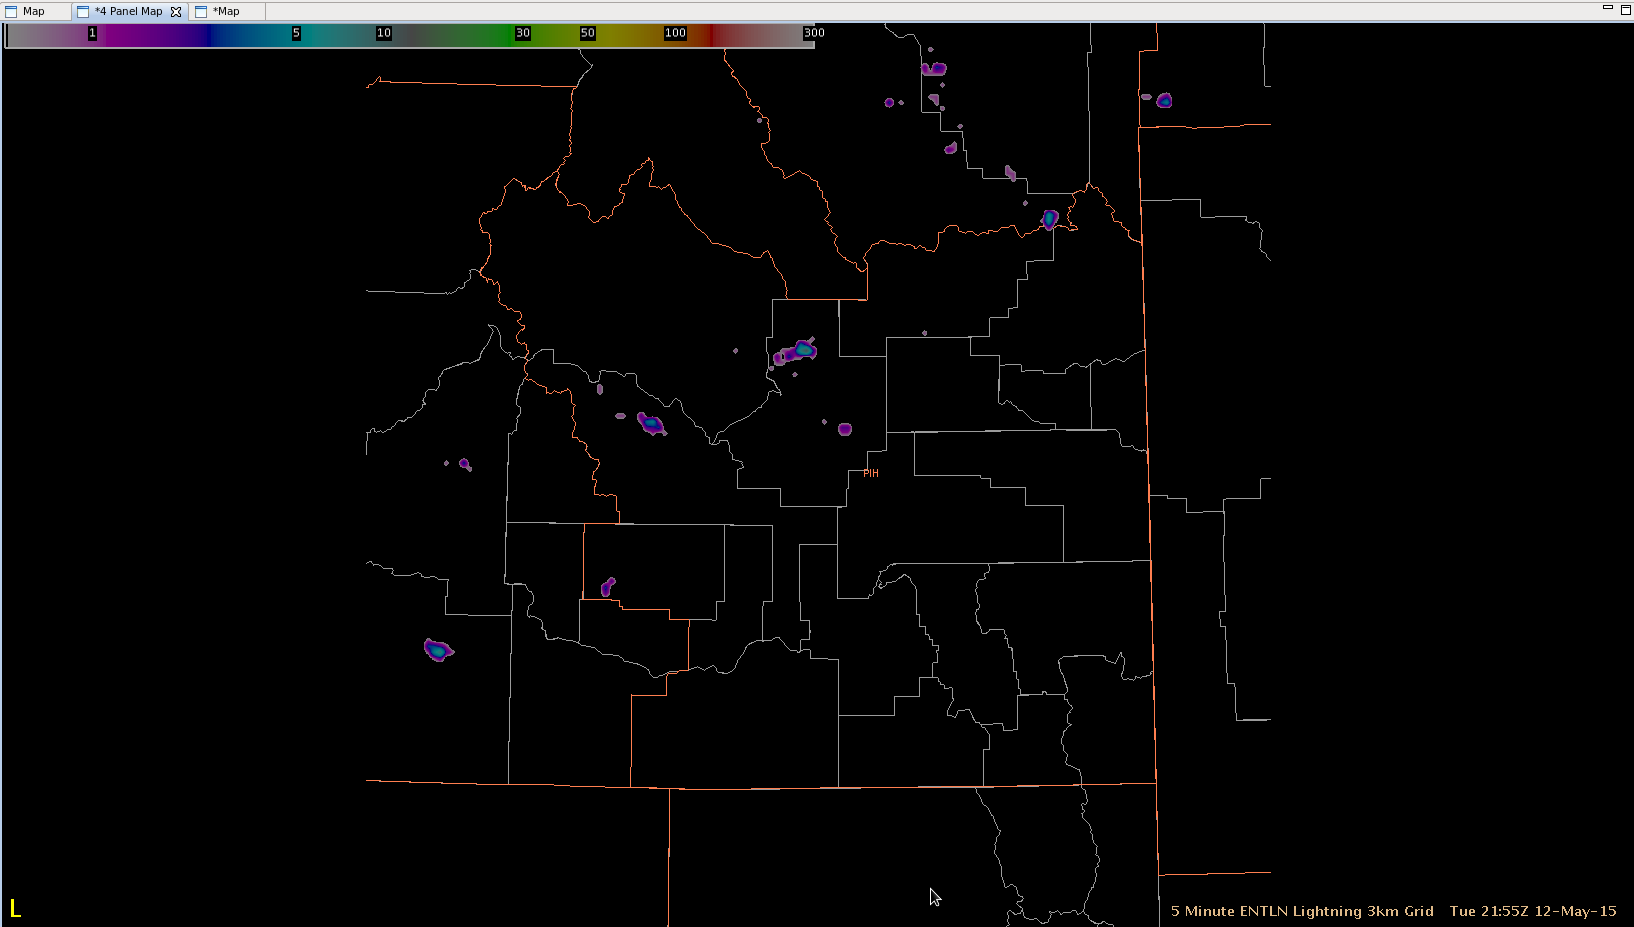
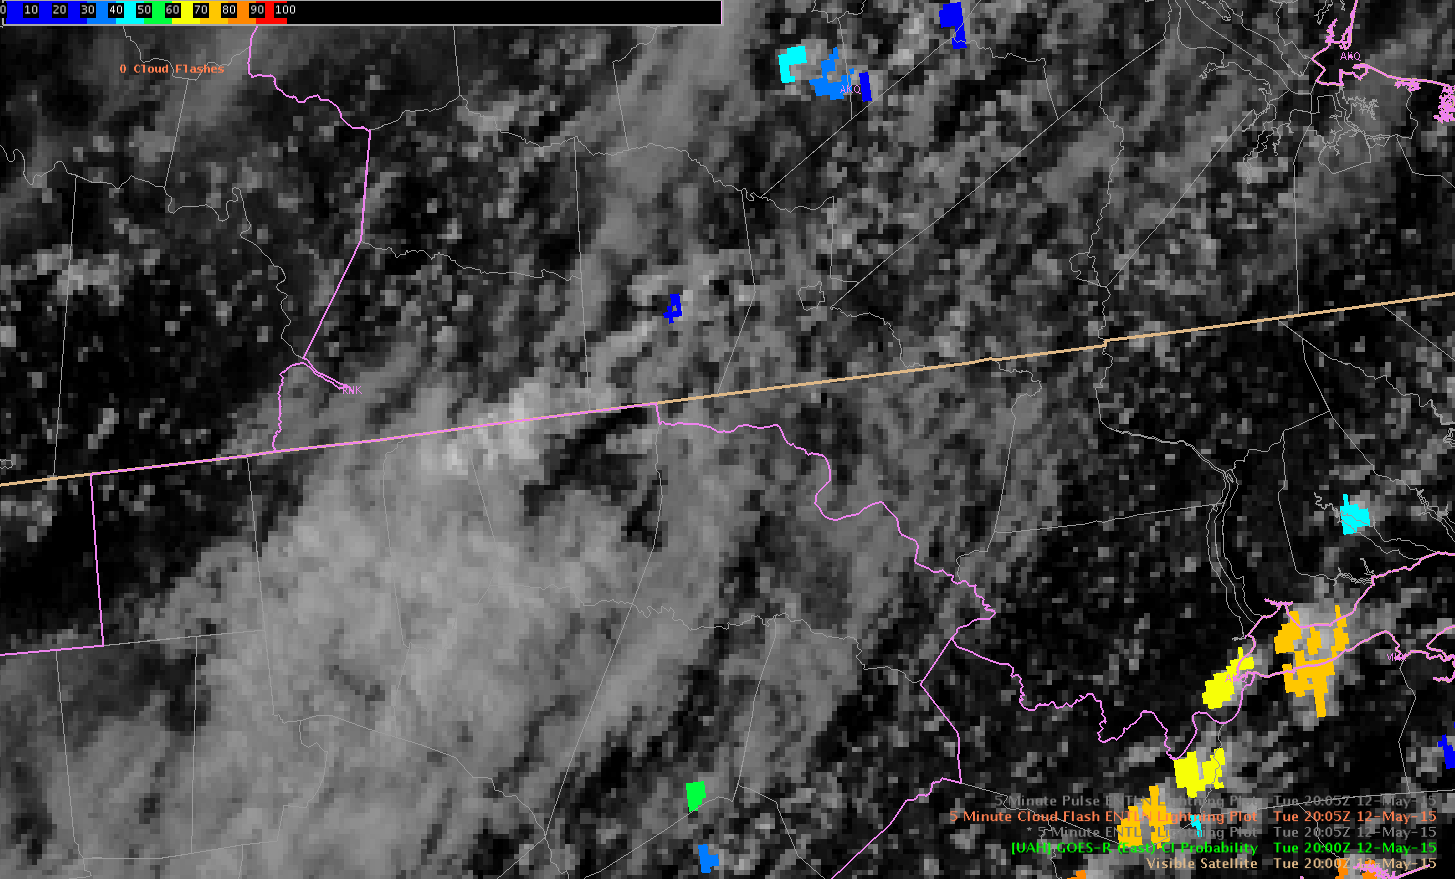
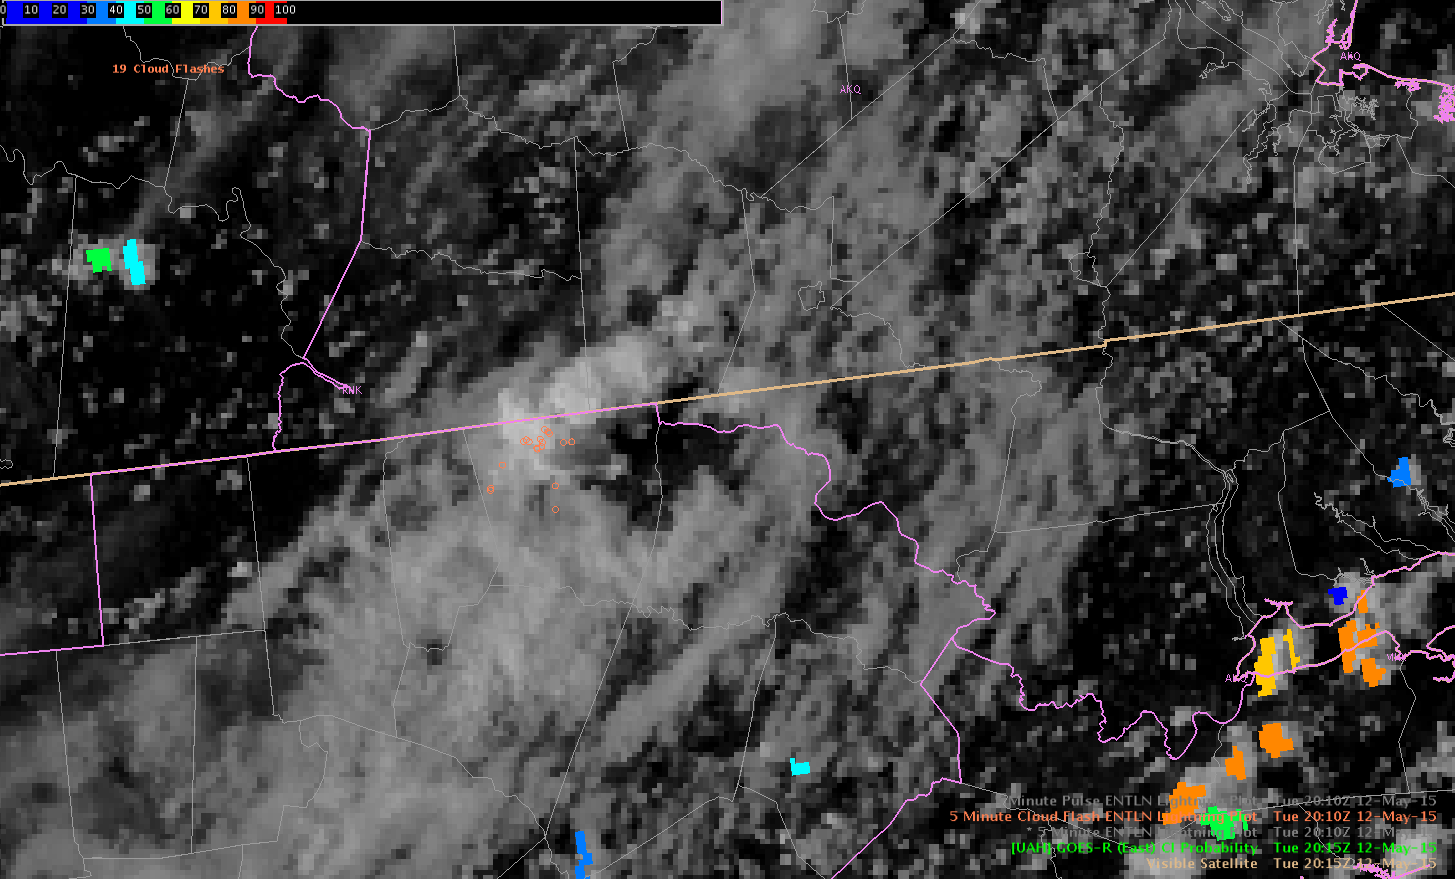
Next, at 20z, all CI probs are gone, indicating the storm likely got to 35dbz or didn’t form. And actually at 20z, a single lightning flash came up on ENI data.

20zCI

Now, at 2015z, there is much more intercloud lightning flashes.

2015CI

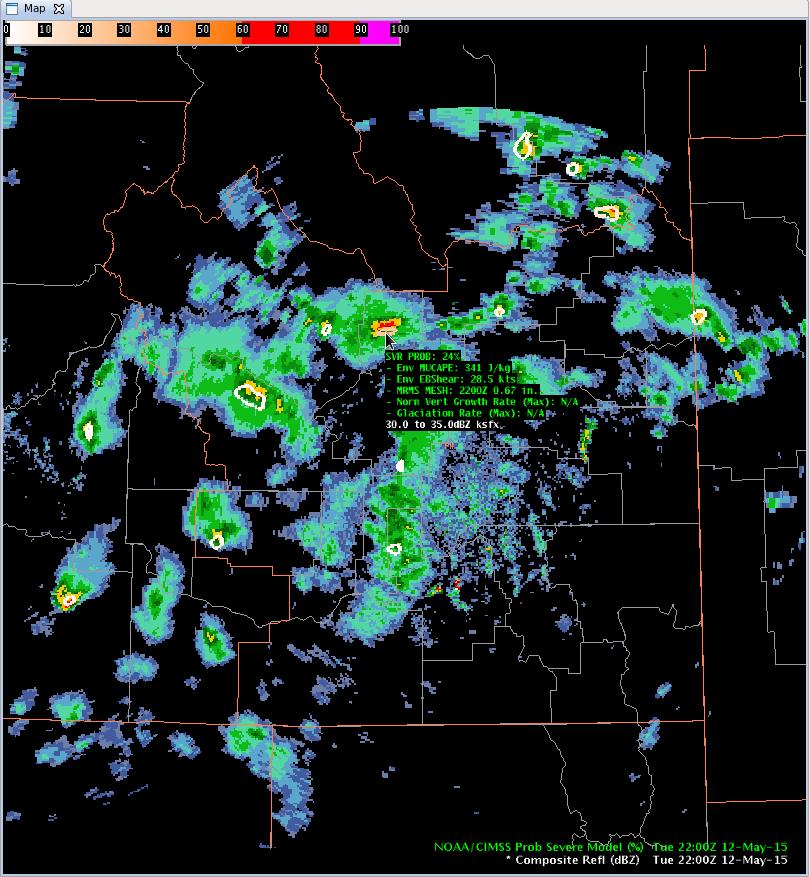
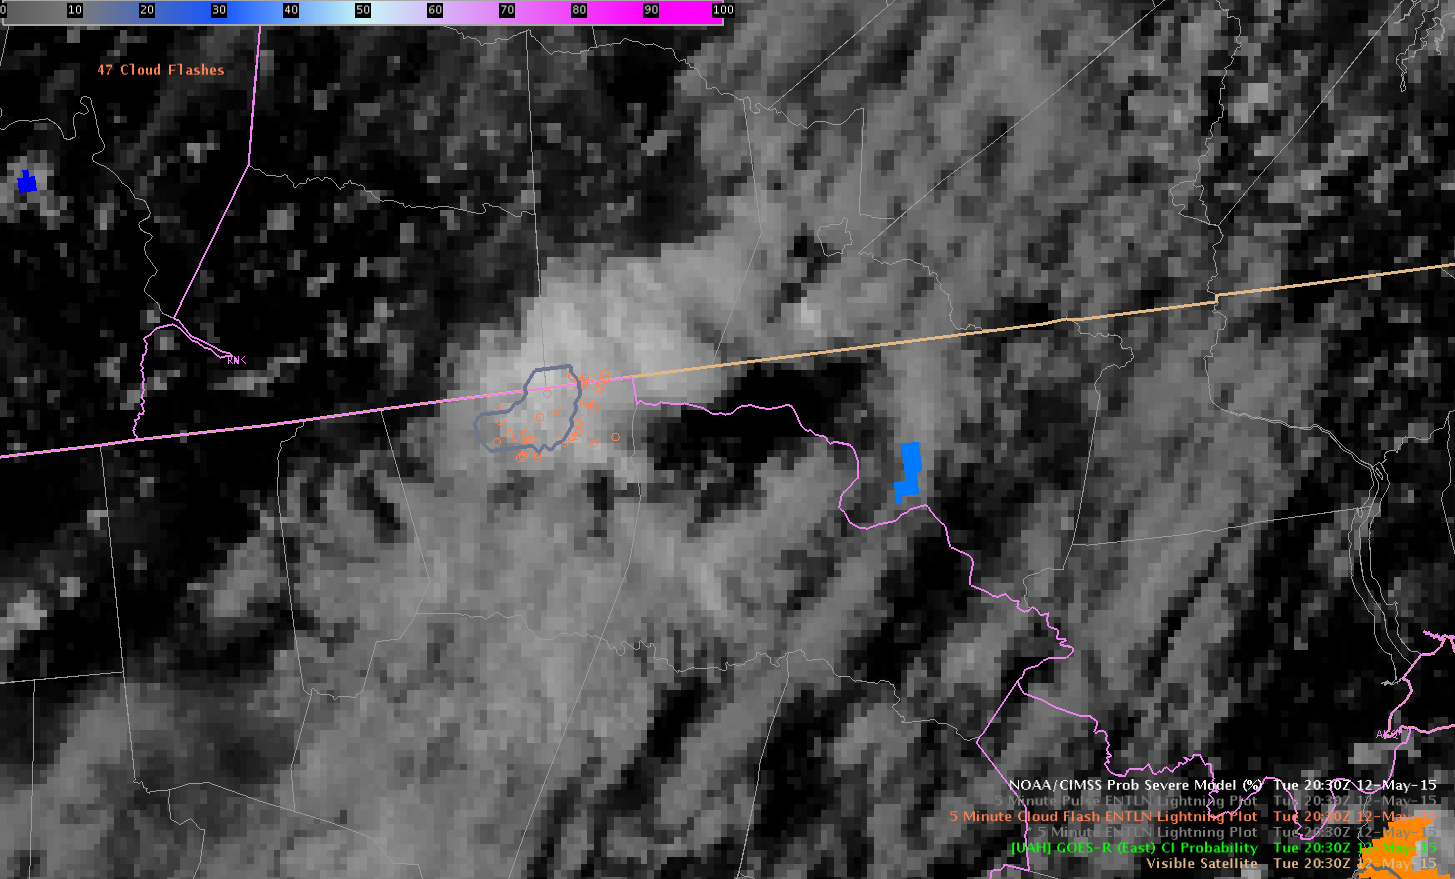
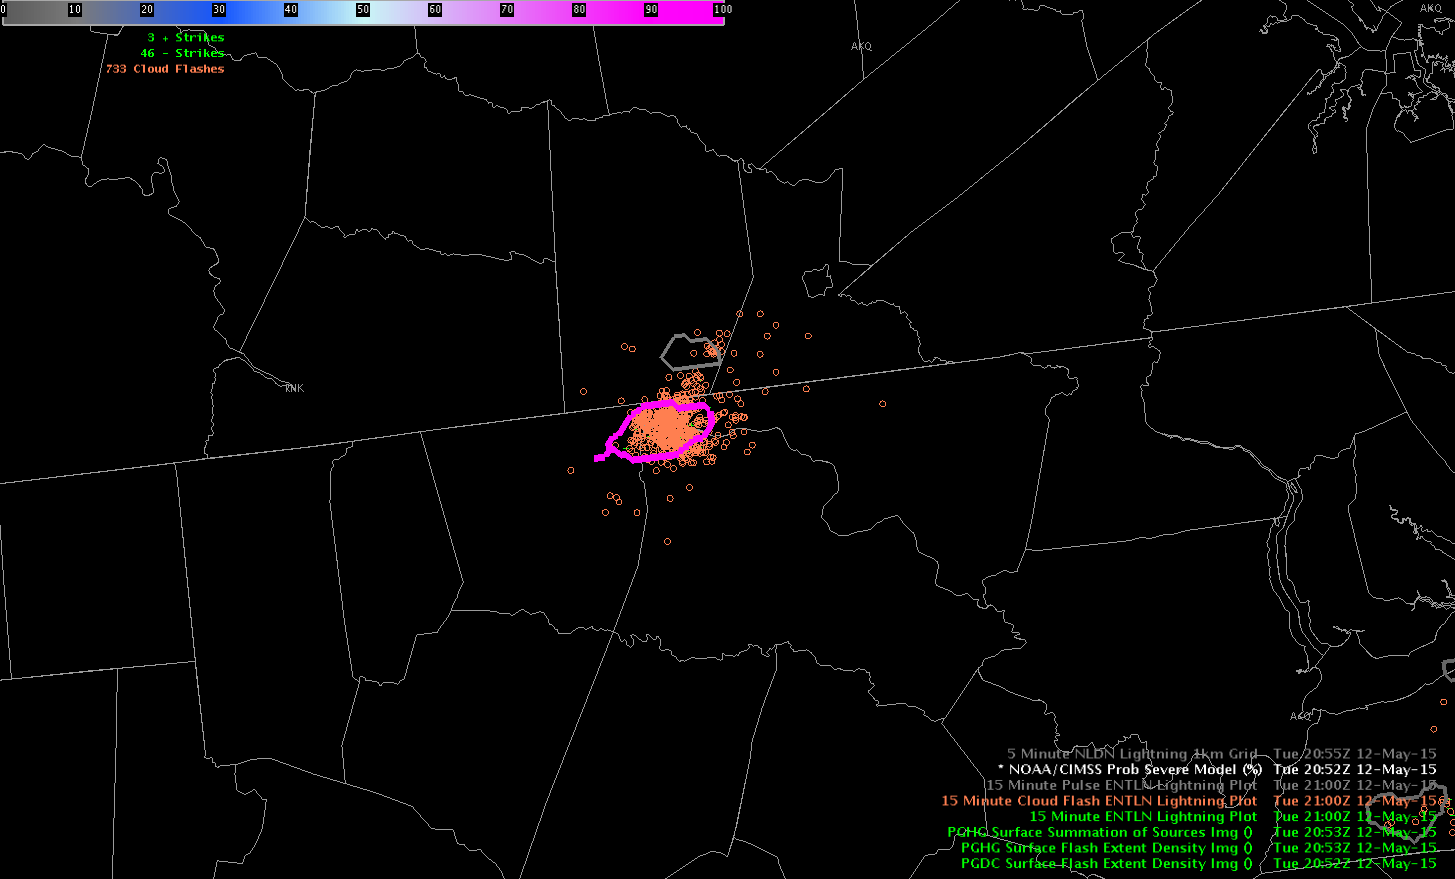
Lastly, at 2030z, the ProbSvr is at 13% and there are more lightning flashes with this storm.

2030z


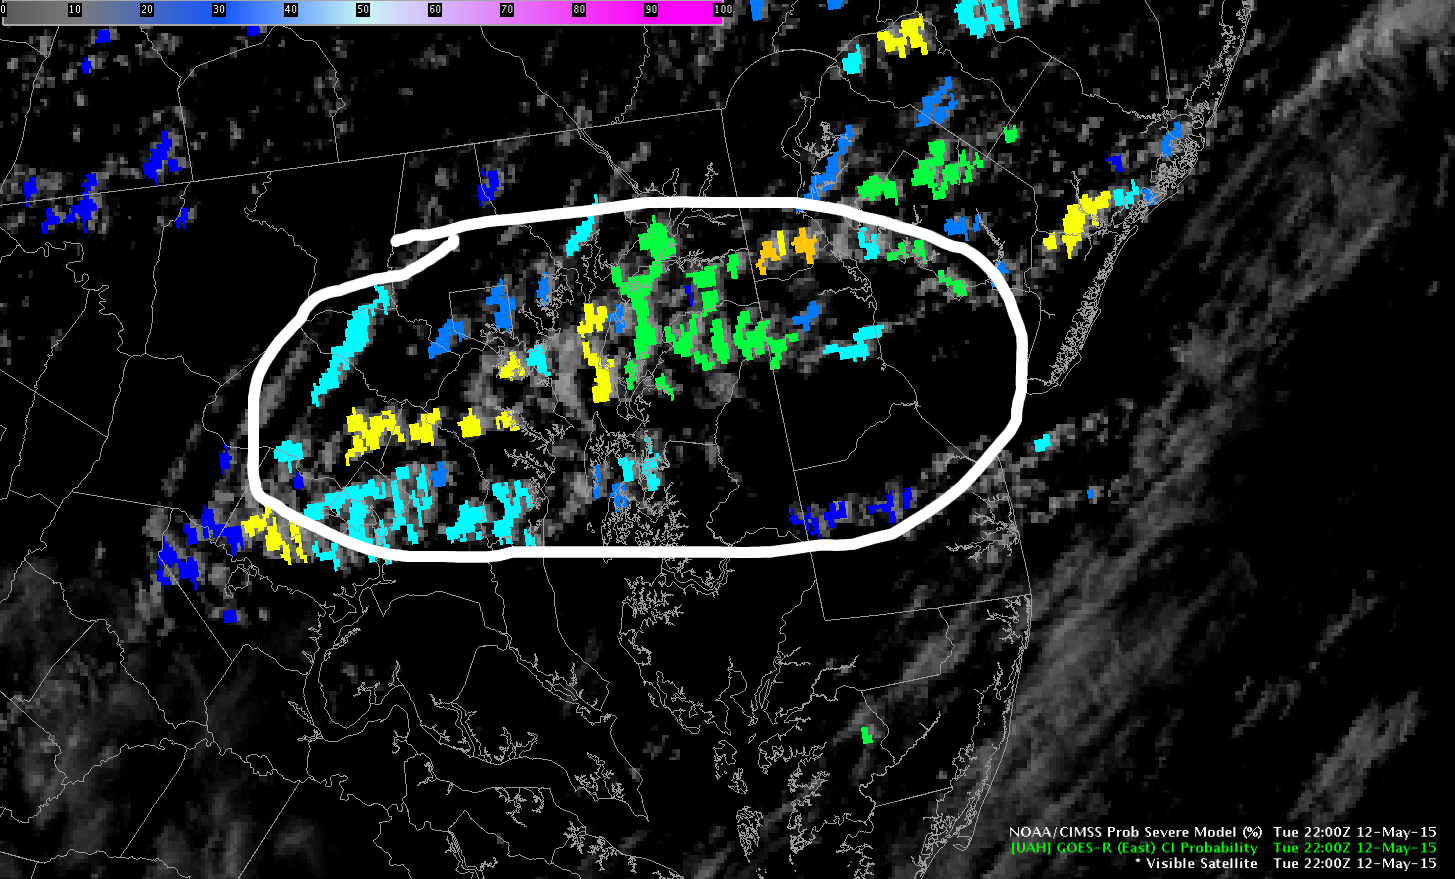
The takeaway? First, it was quite confusing trying to go back and “track” which cloud the CI was tracking. Second, once I figured it out, the CI was less than 20% and for only 30 minutes until the storm developed. There is CI over 50-60% all over the Mid Atlantic right now and none of them are initiating. I found it quite interesting how quickly this one formed and it probably formed between the 15 min satellite scans making it hard to track.

Update::

I continued to follow this storm.

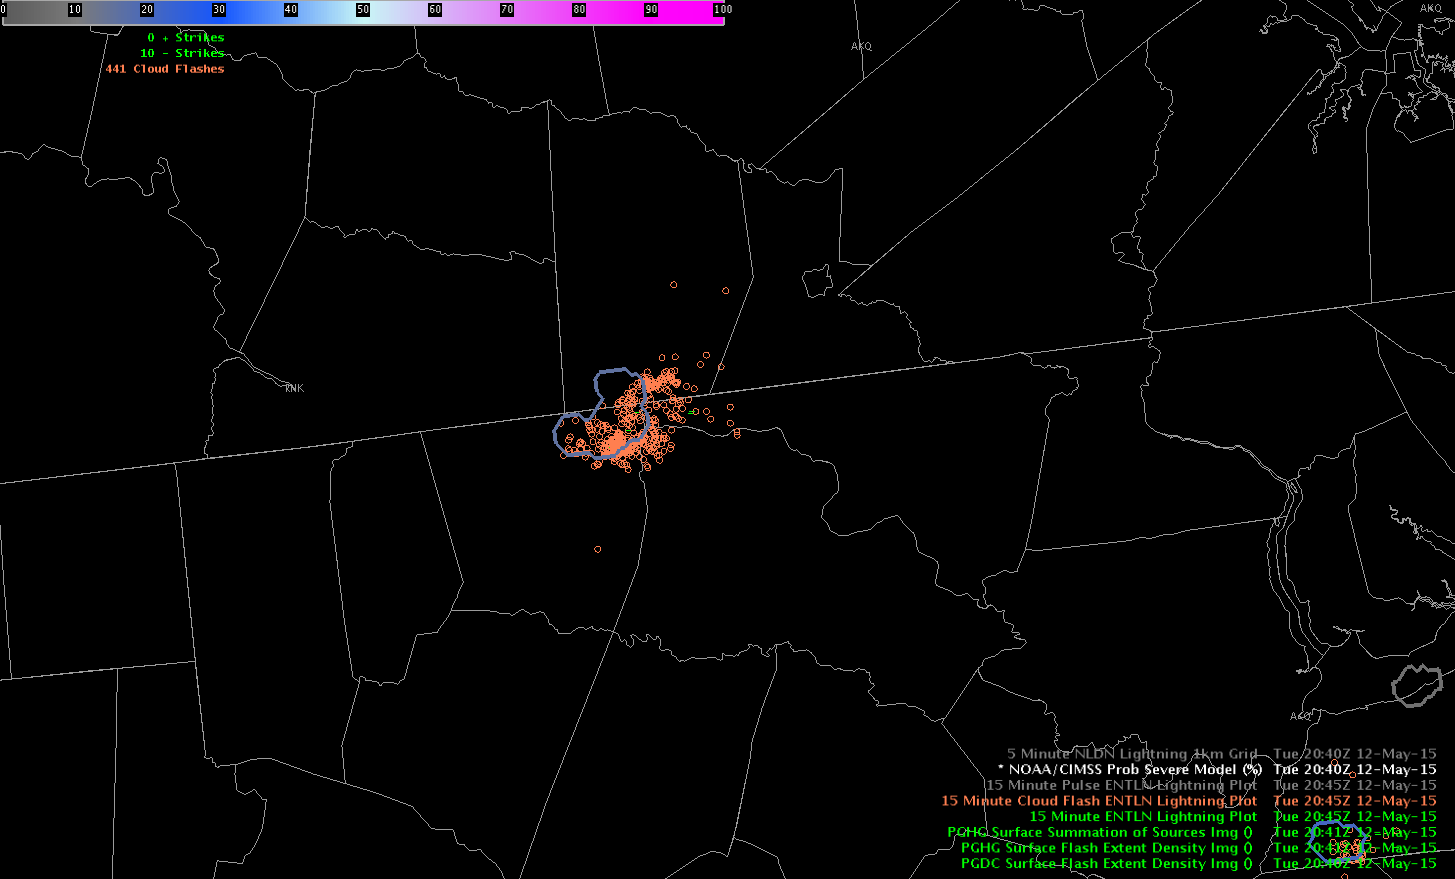
At 2040Z, the ProbSvr increased.

2040ProbSvr

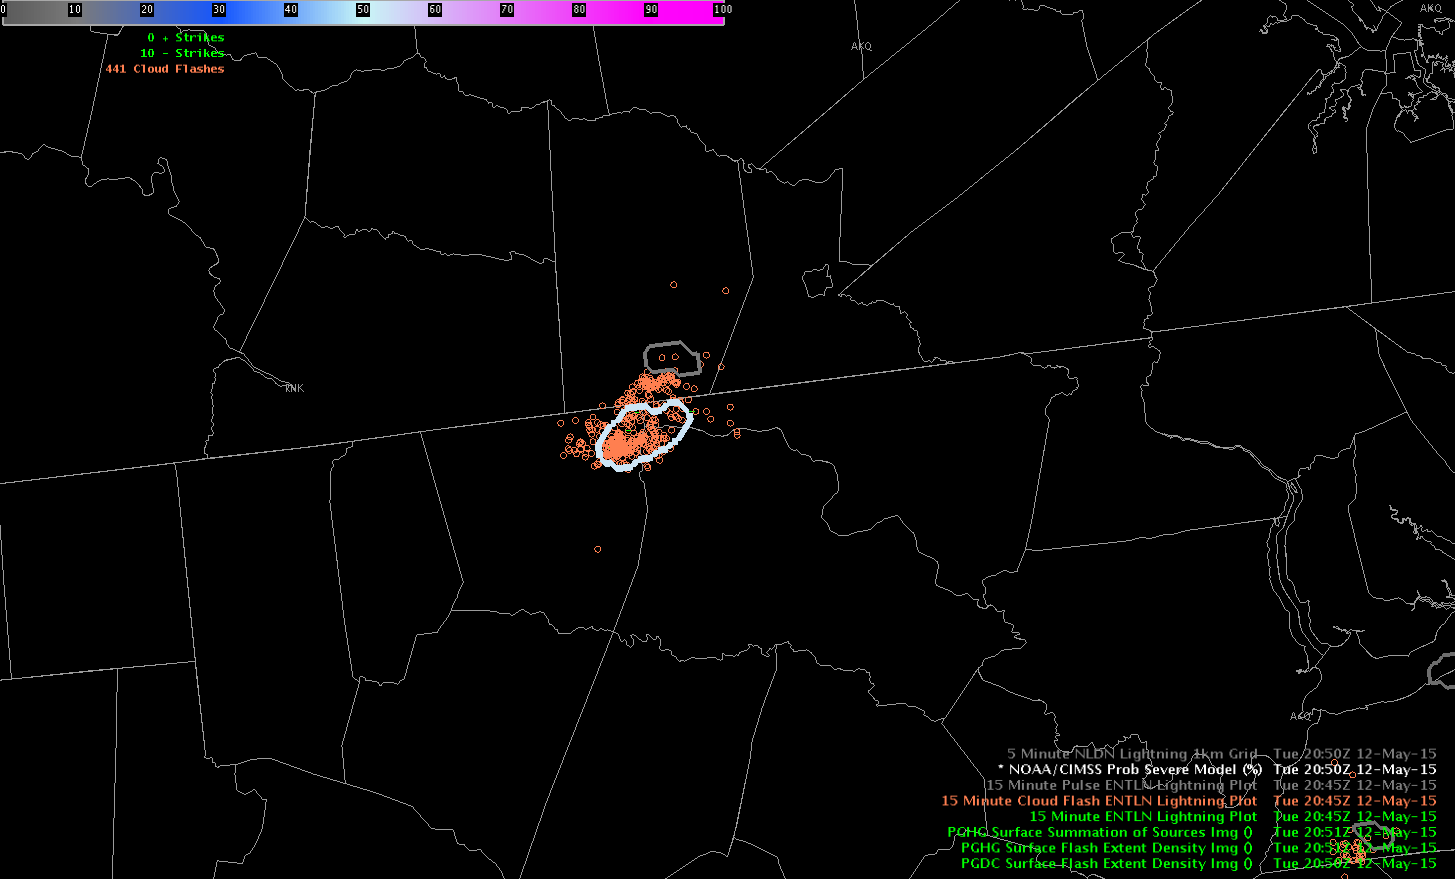
At 2050z, it increased again.

2050ProbSvr

At 2052z, ProbSvr increased significantly. NWS issued a warning at 2054 (not that I am supposed to know that).

2052ProbSvr_Warning2054

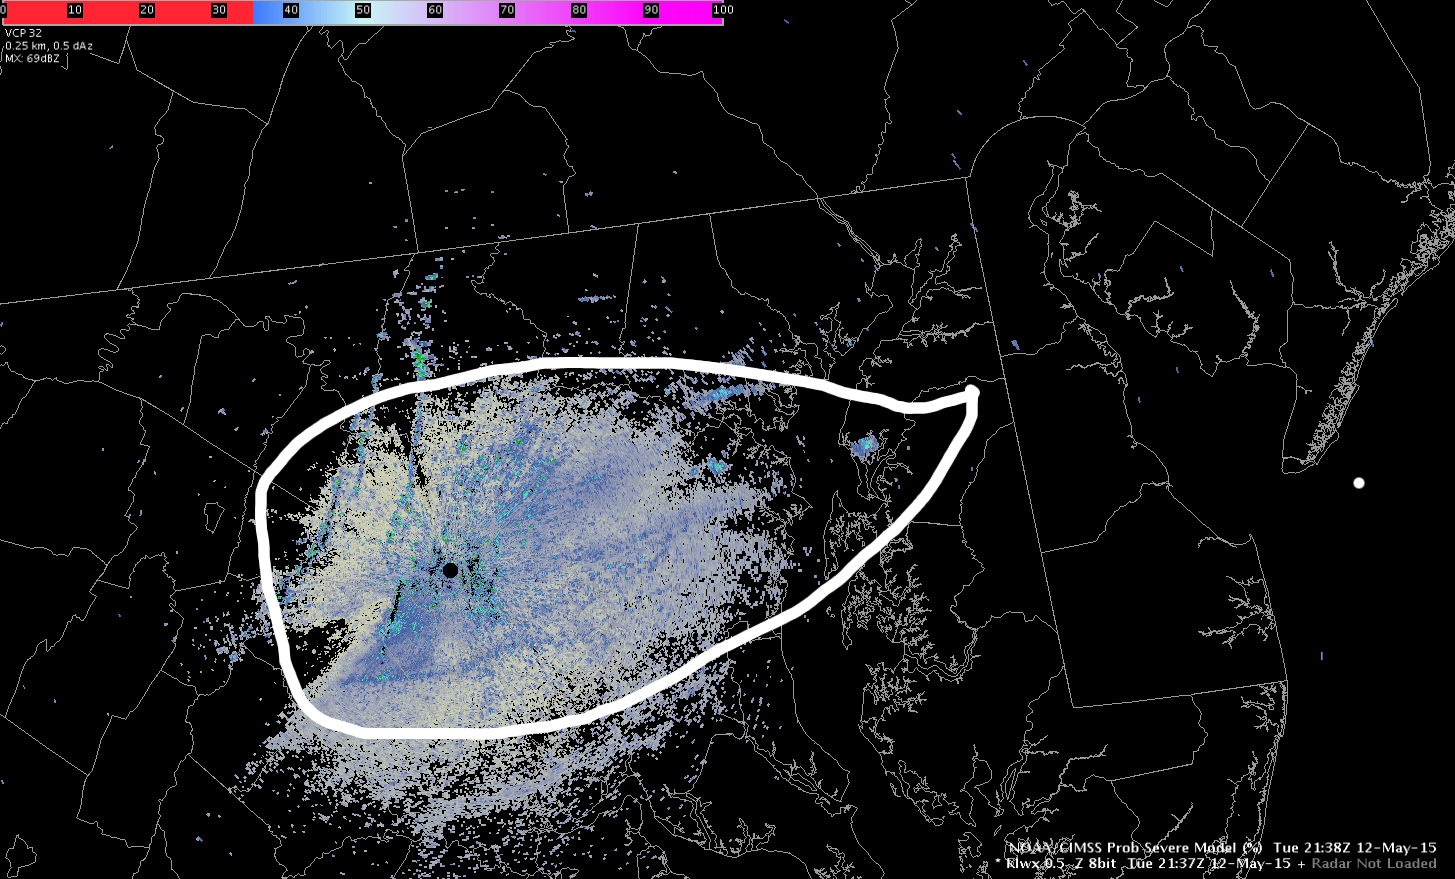
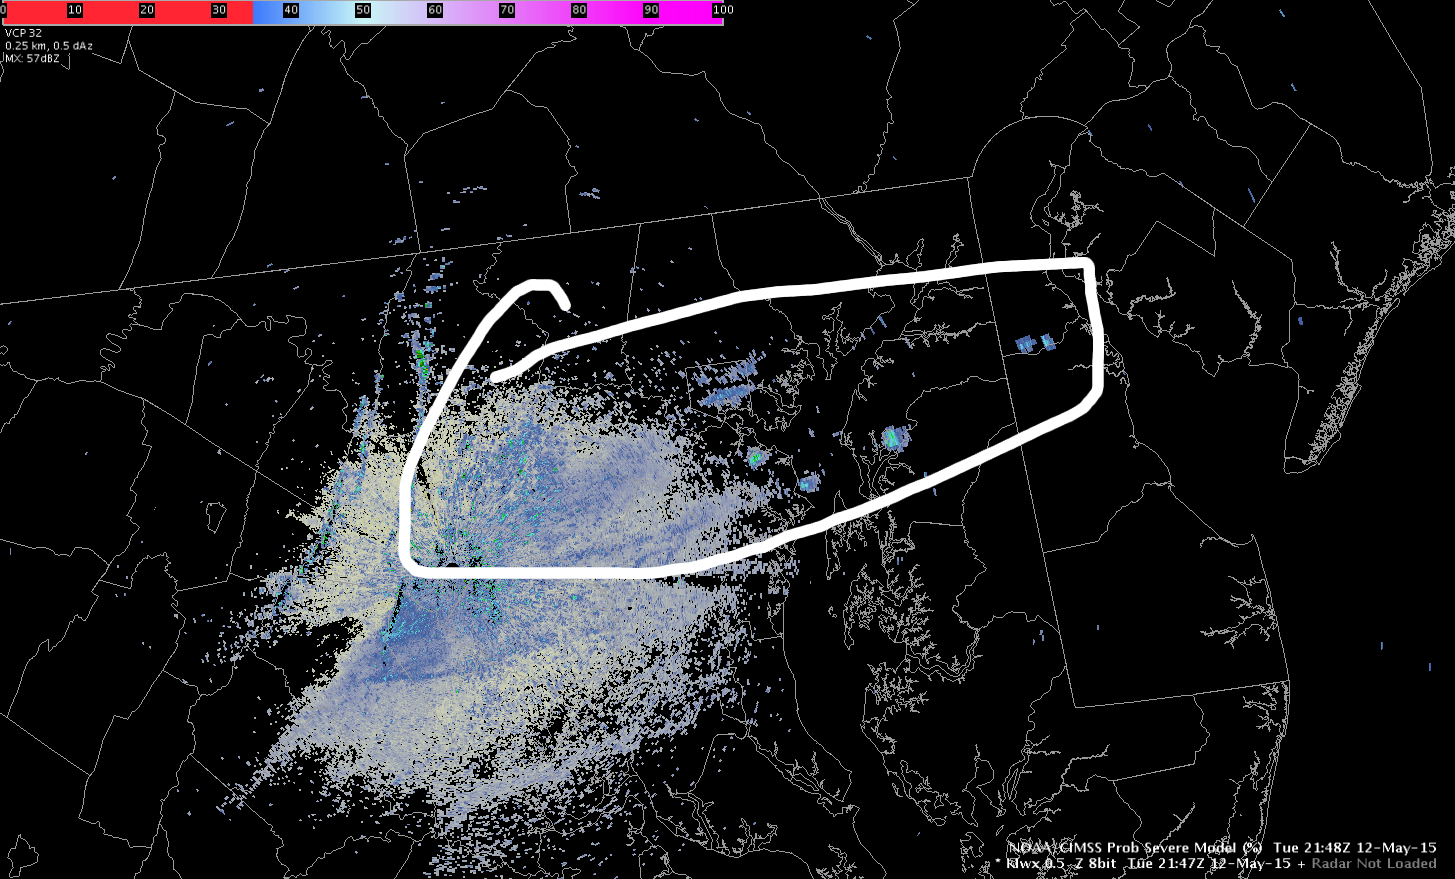
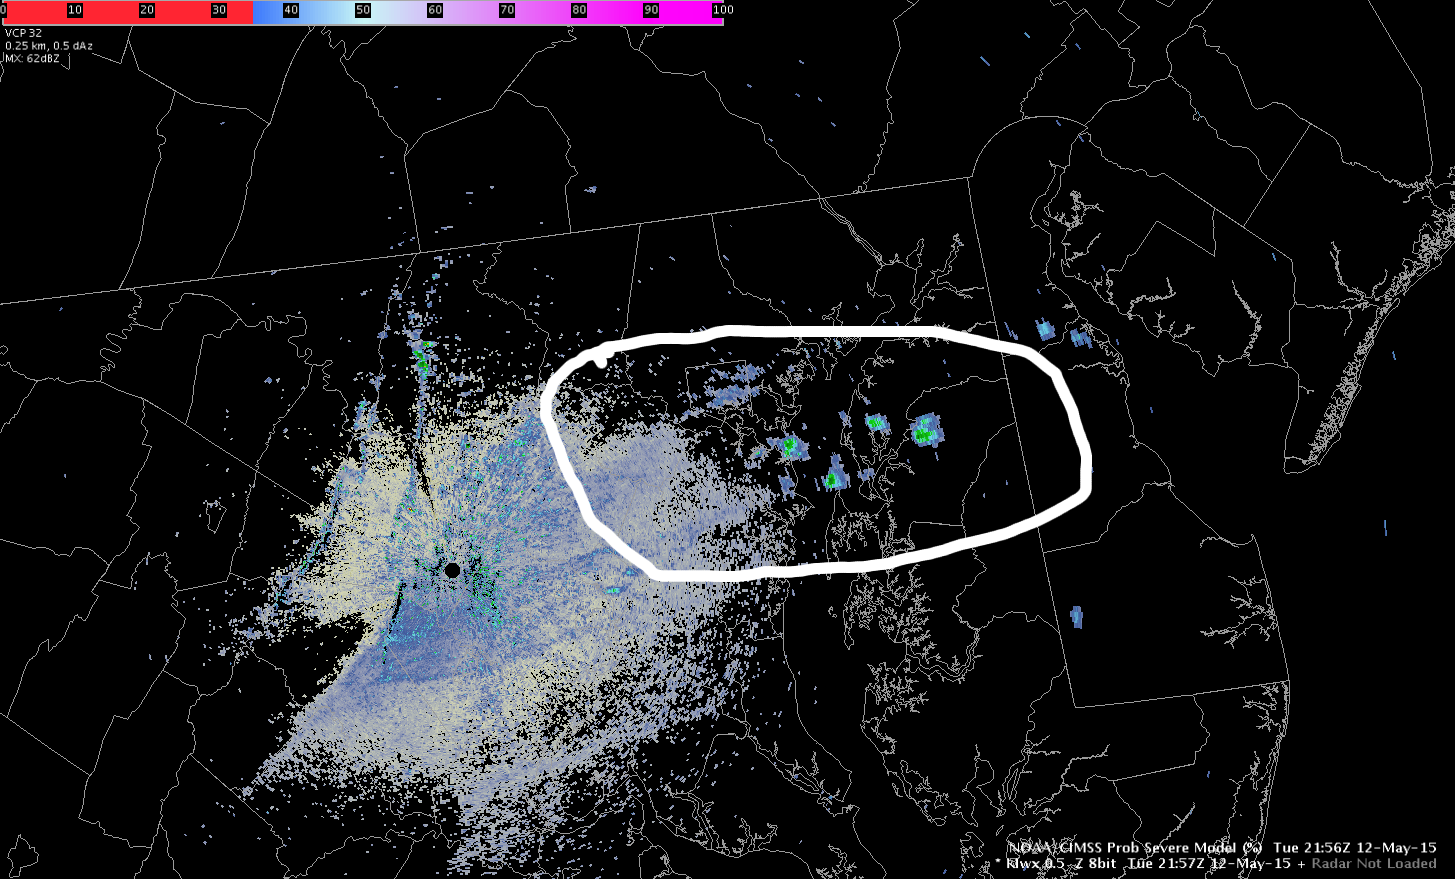
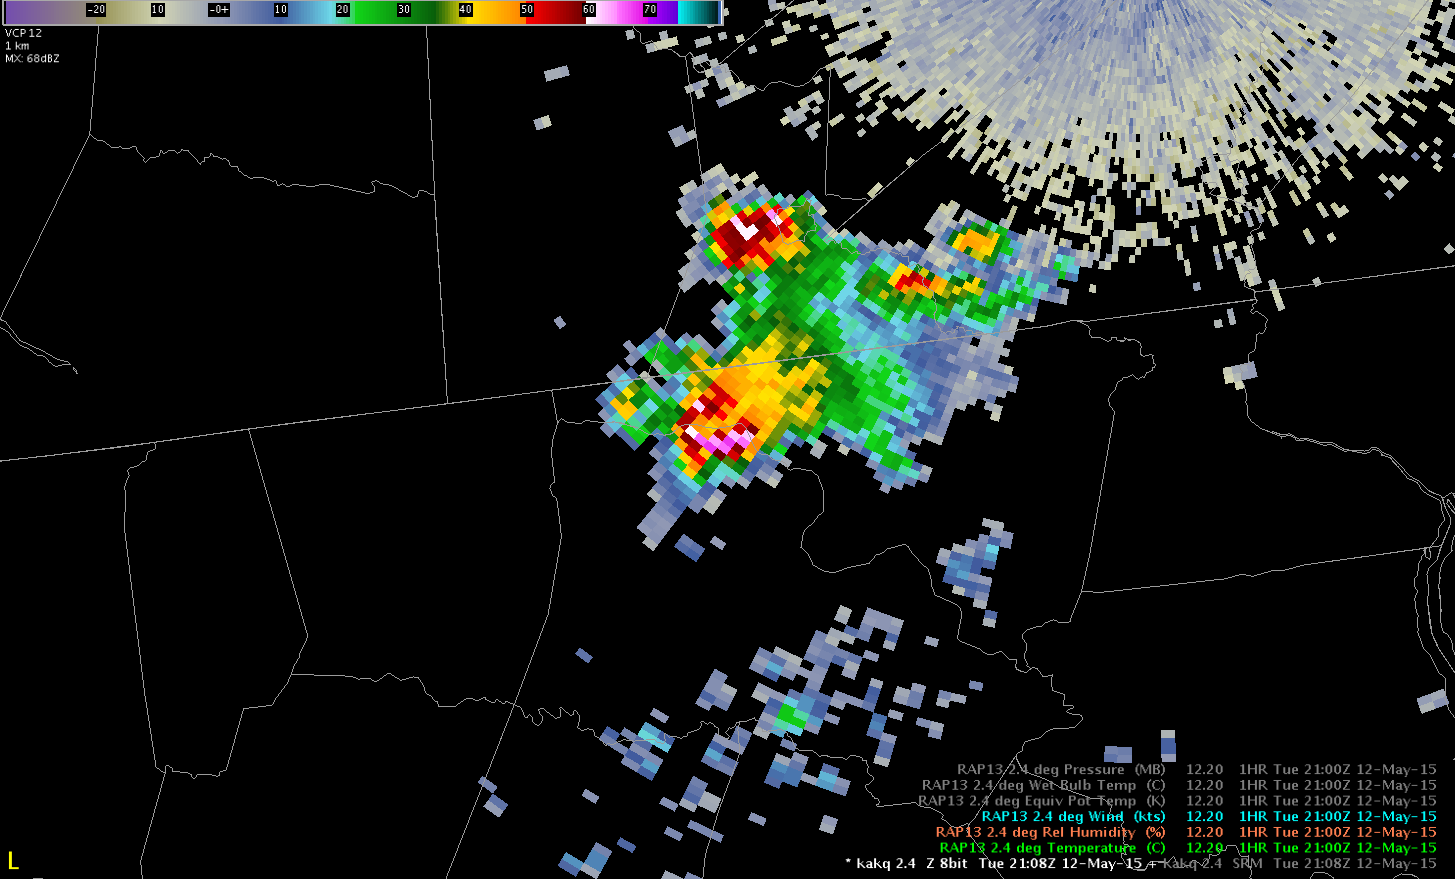
I didn’t have Raleigh’s or Wakefield’s radar up on my awips but I did get it at 2108 and there is already a hail spike.

2108hailspike


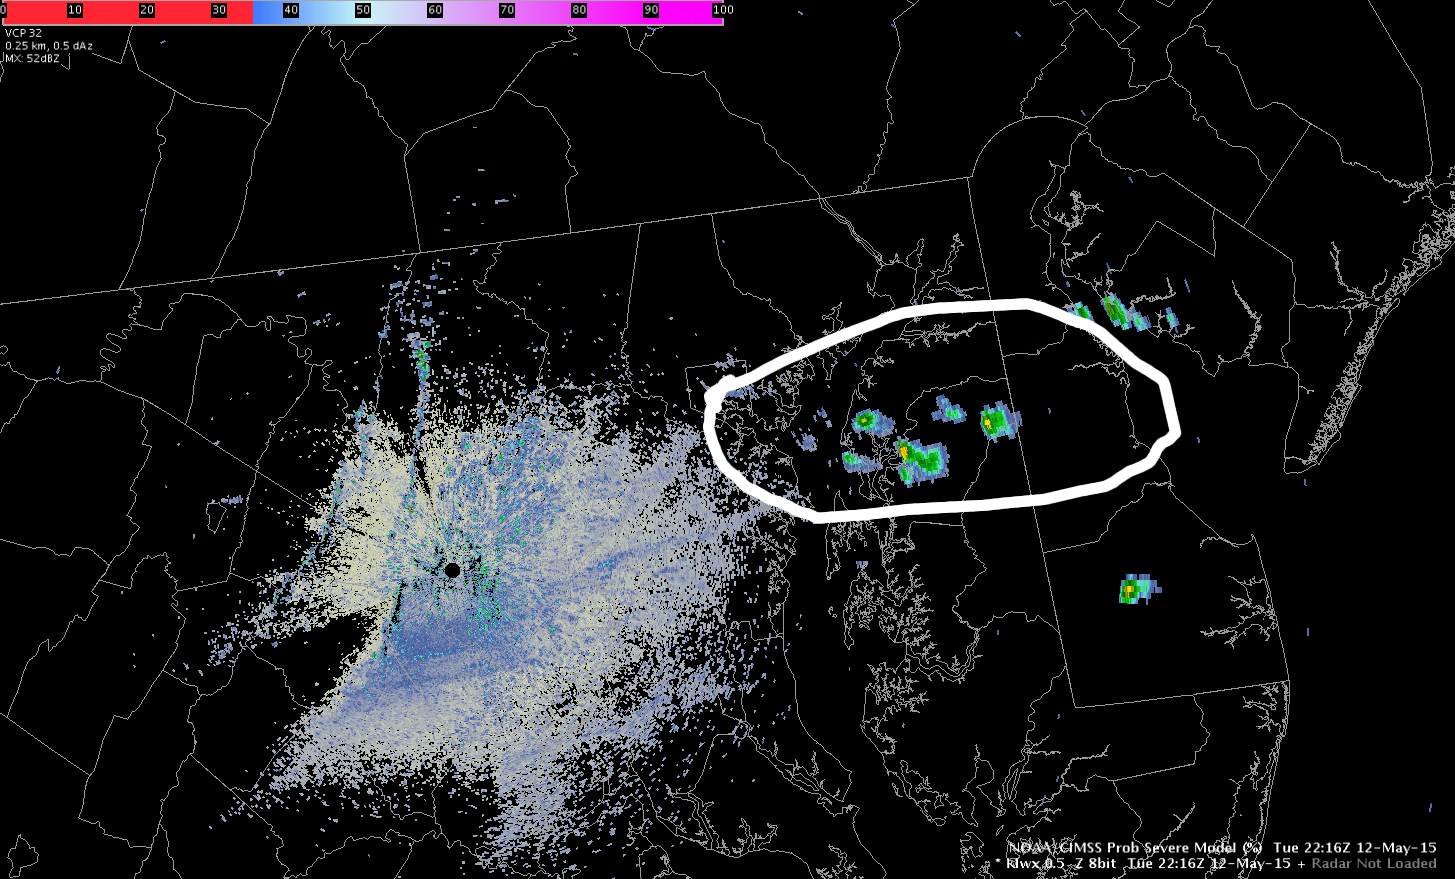
At 2112z, the NWS received its first 1 inch hail report!


Lauren13

Tags: None