Severe event in VA/WV, as seen on Rapid Scan GOES-14

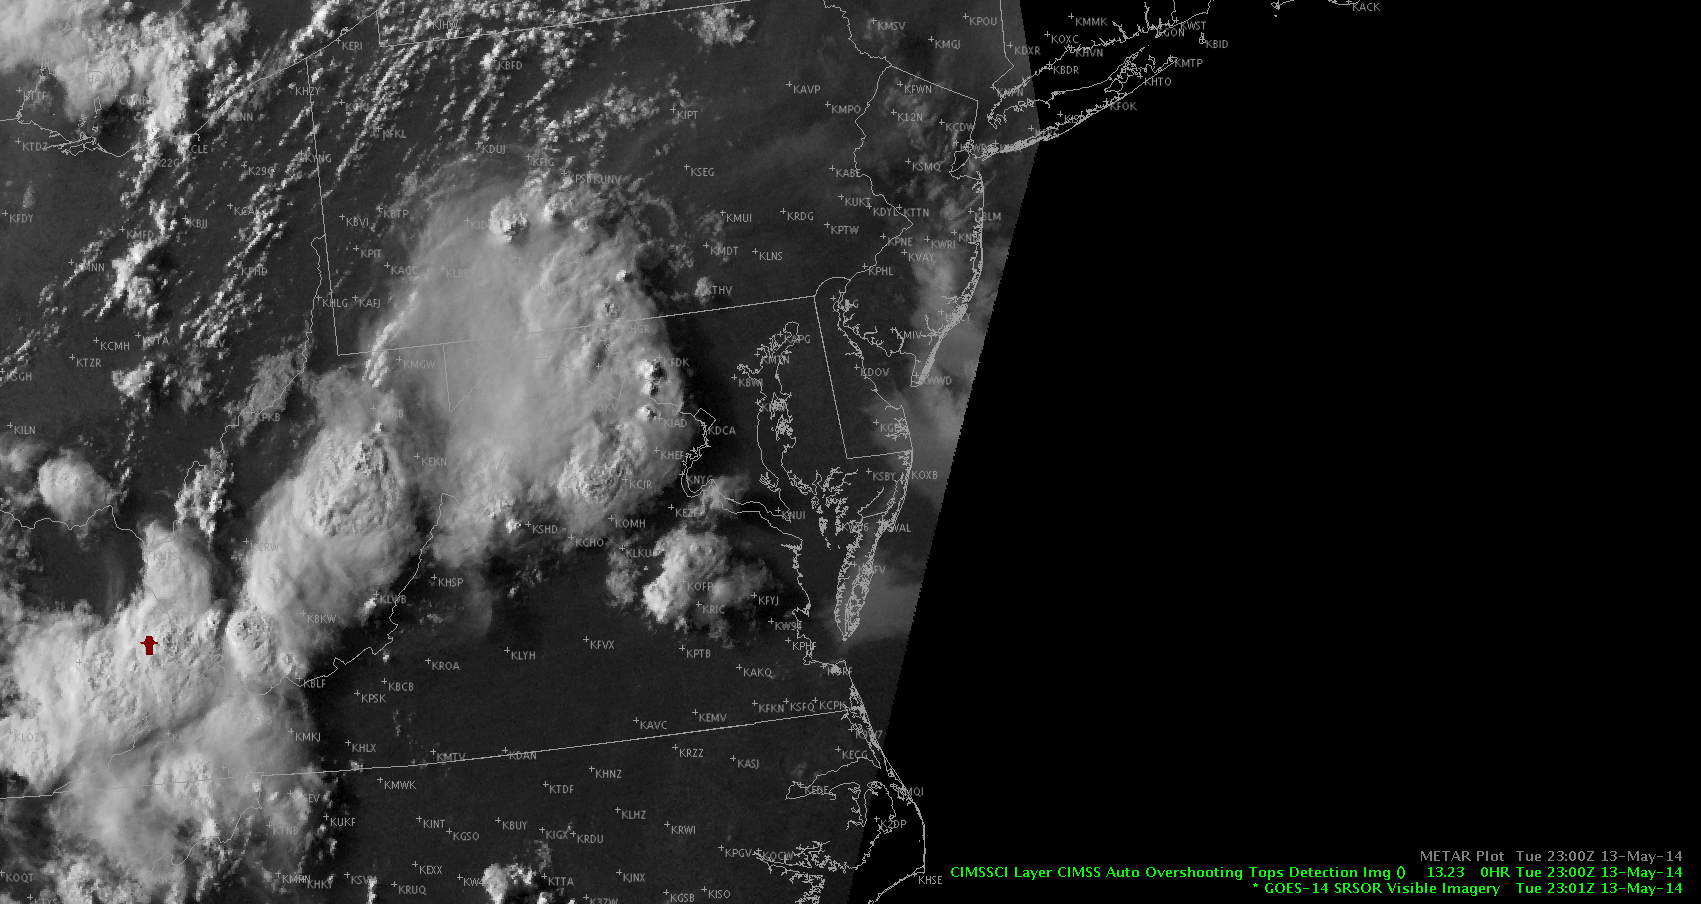
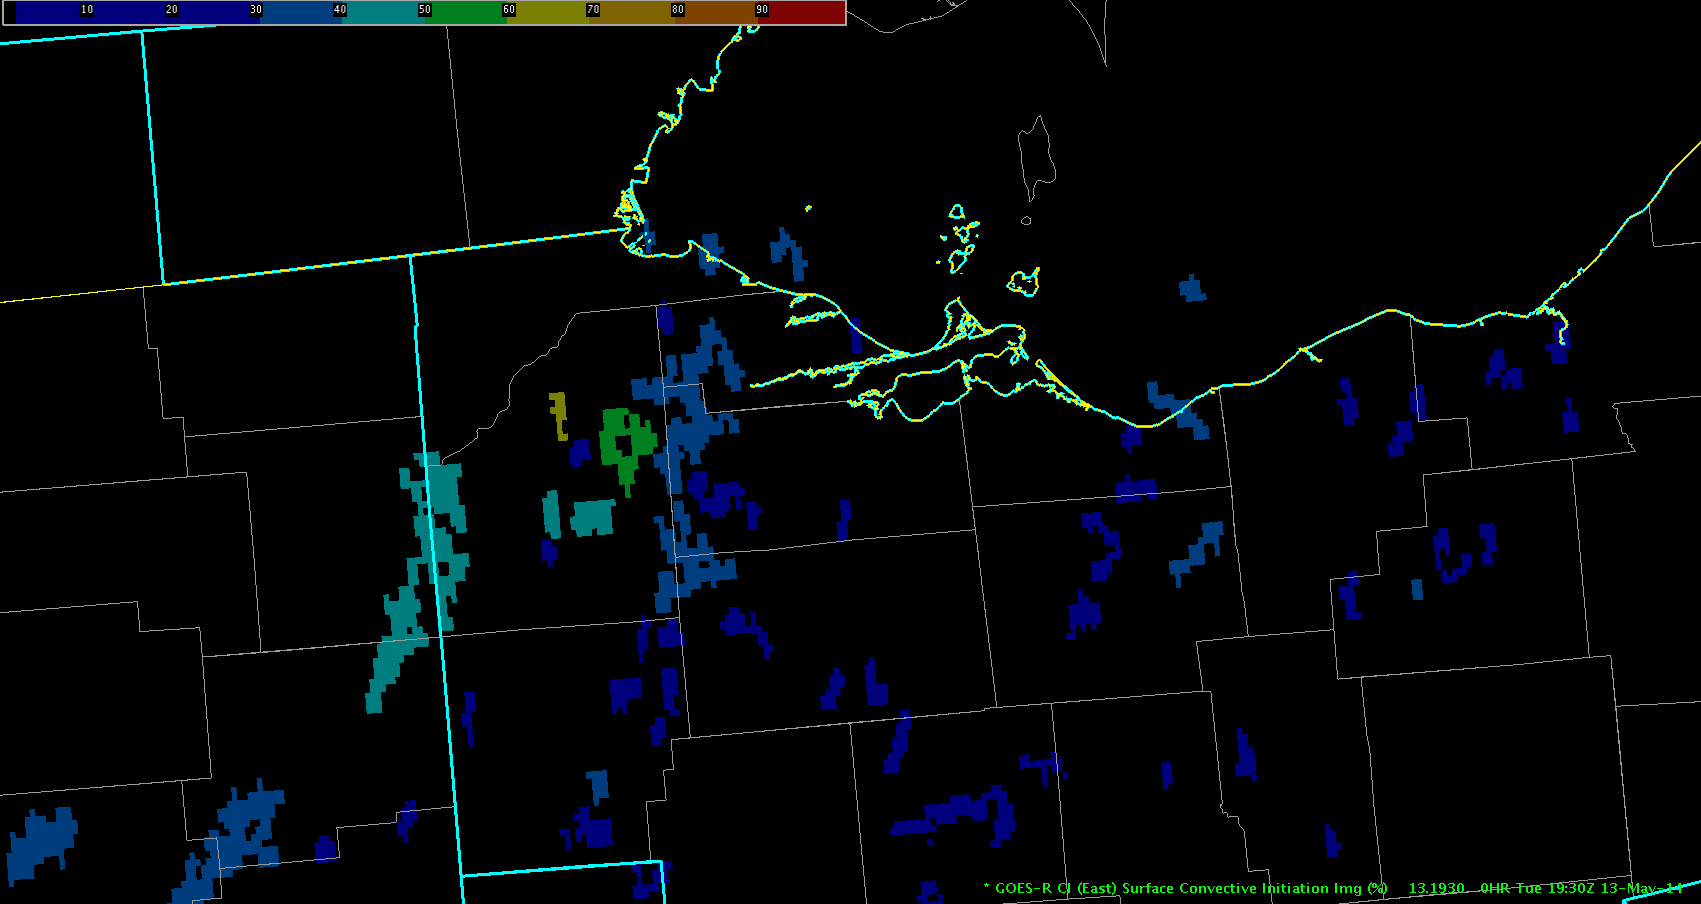
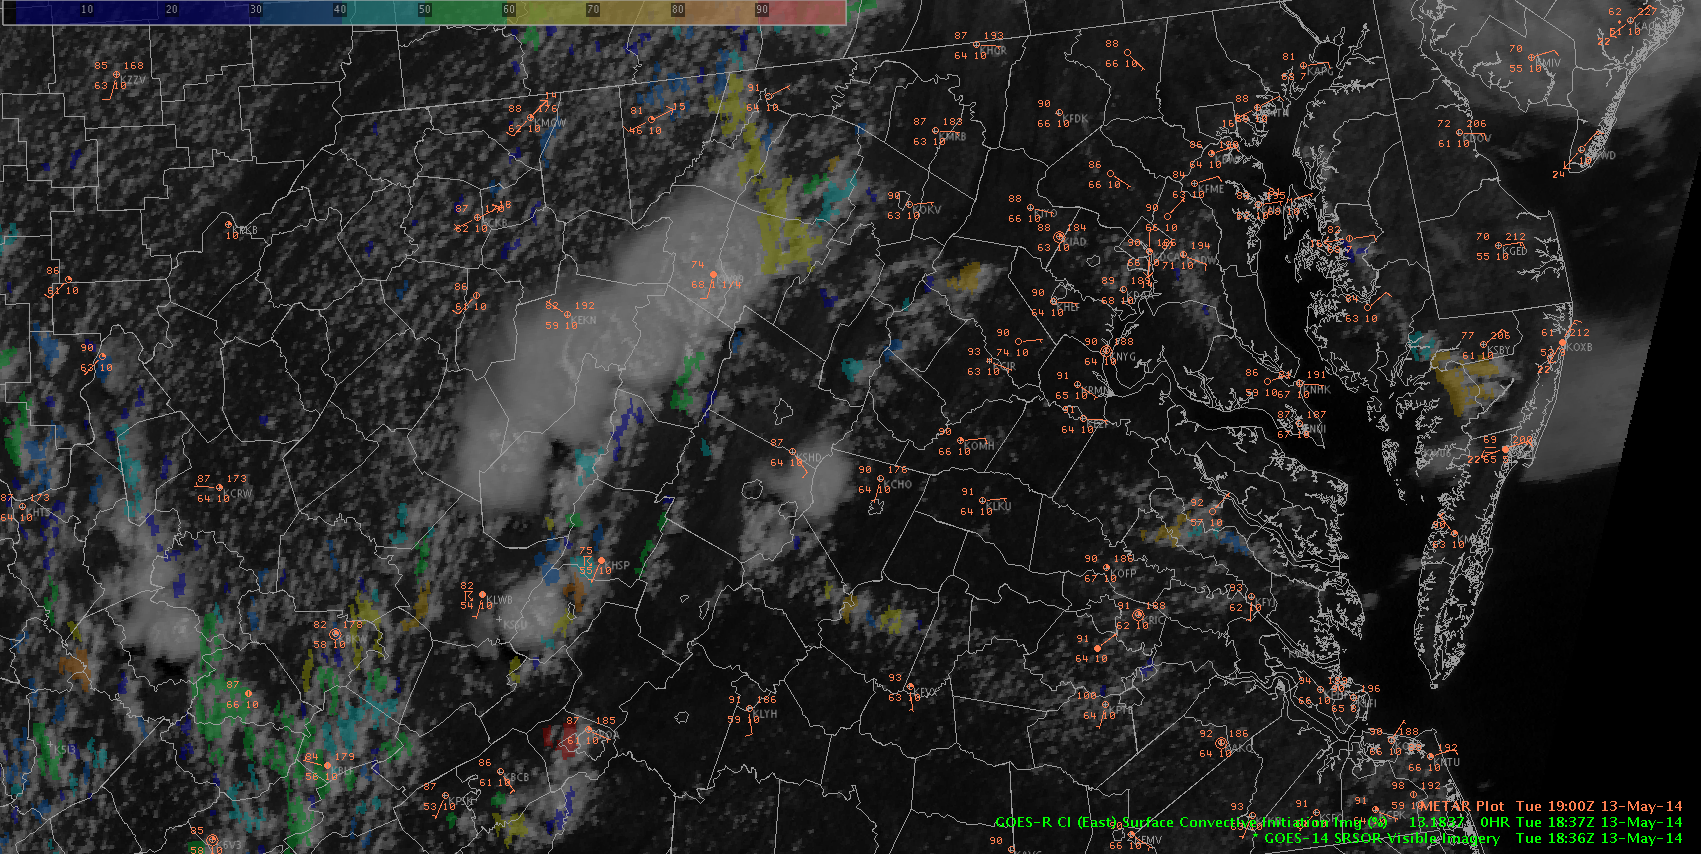
Mike Smith and I tracked a convective cell cluster that was developing in the Allegheny Mountains of Virginia and West Virginia on Tuesday afternoon. We used the rapid scan GOES imagery to get a good look at developing overshooting tops and we were also looking for boundaries that could produce strong downbursts. At 1830Z, or 2:30pm local time, the surface observation data shows a buoyant environment to the east of the developing storm cells. The wind barbs also show a southeast flow in this area, and the obs to the west of the clouds were showing westerly and southwesterly winds. We were not able to look at radar data today in AWIPS as a verification tool, so we pulled up radar from the NWS’s site and looked at severe warnings as they were issued. This first image is from 1830Z, when the developing Cu aren’t looking too dramatic just yet. However, the GOES-R convective initiation product is showing a 90% probability for the middle Shenandoah Valley, indicated in red.

obs_ci_rapidvis1830Z

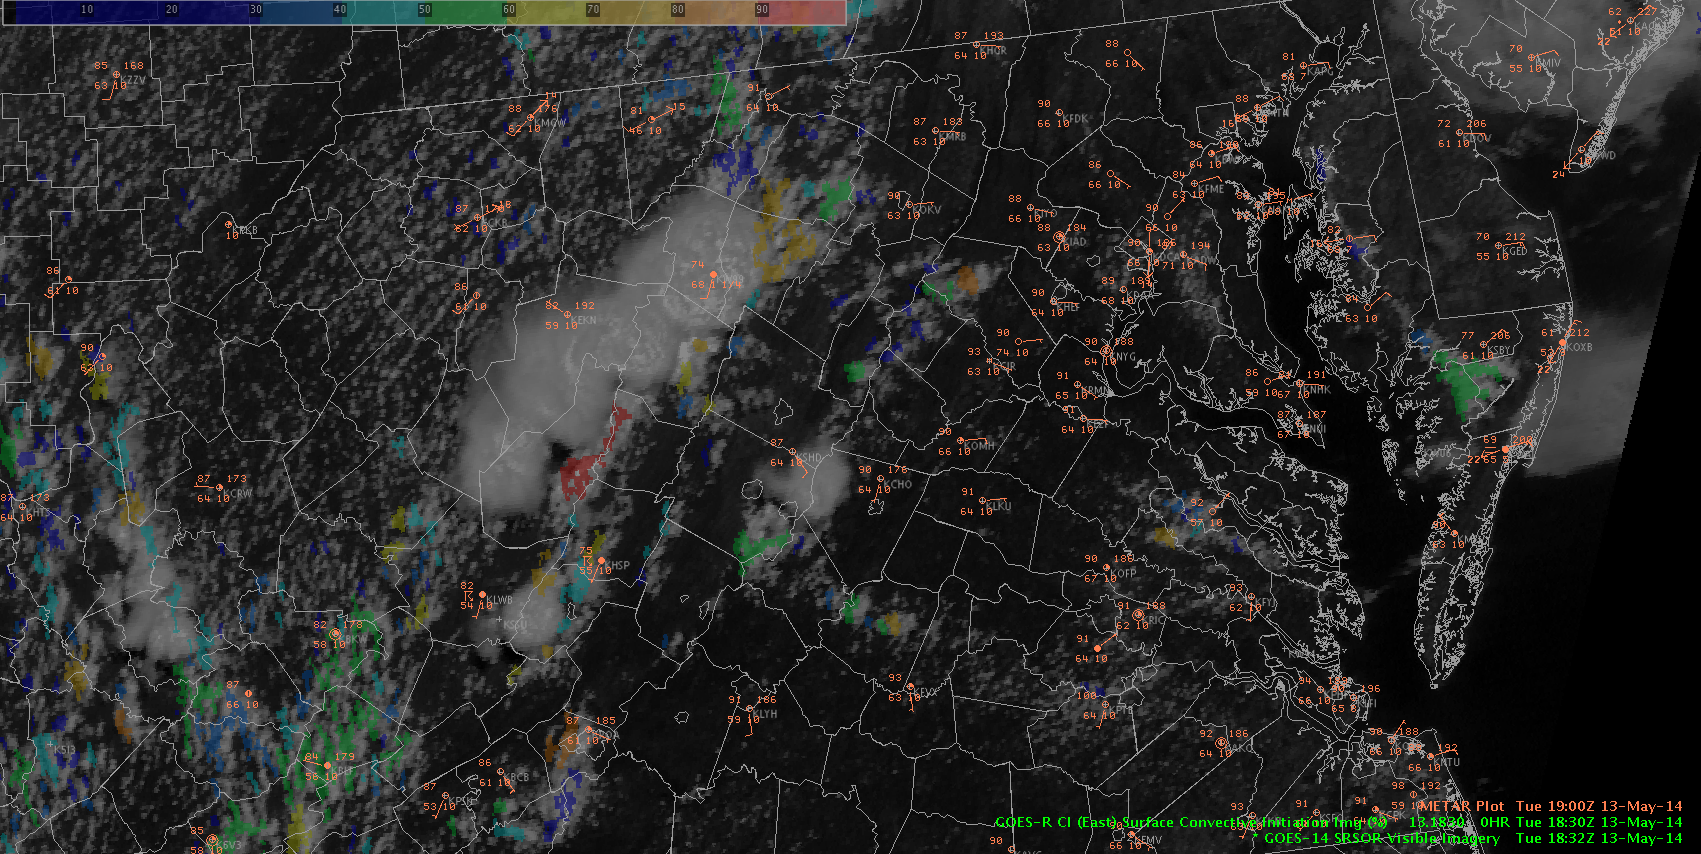
We decide to keep an eye on this area as the GOES-R CI was showing a strong signal for further development. In particular, Mike was looking for an outflow boundary to develop on the east side of this convective cell, which would produce a short-lived severe wind gust event. I was also following the northern edge of the clouds, in the area of the WV and MD panhandles. There was a large area of 60%-70% probability just to the northeast of the cloud. The cloud seemed to be growing in this direction, and I felt that having such a large area that the GOES-R CI was signaling on sort of increased the chance that something might happen in that area. I know that’s not the way the model is supposed to work, but larger spatial coverage just triggers higher confidence in my mind. So, I kept an eye on that area, as well.

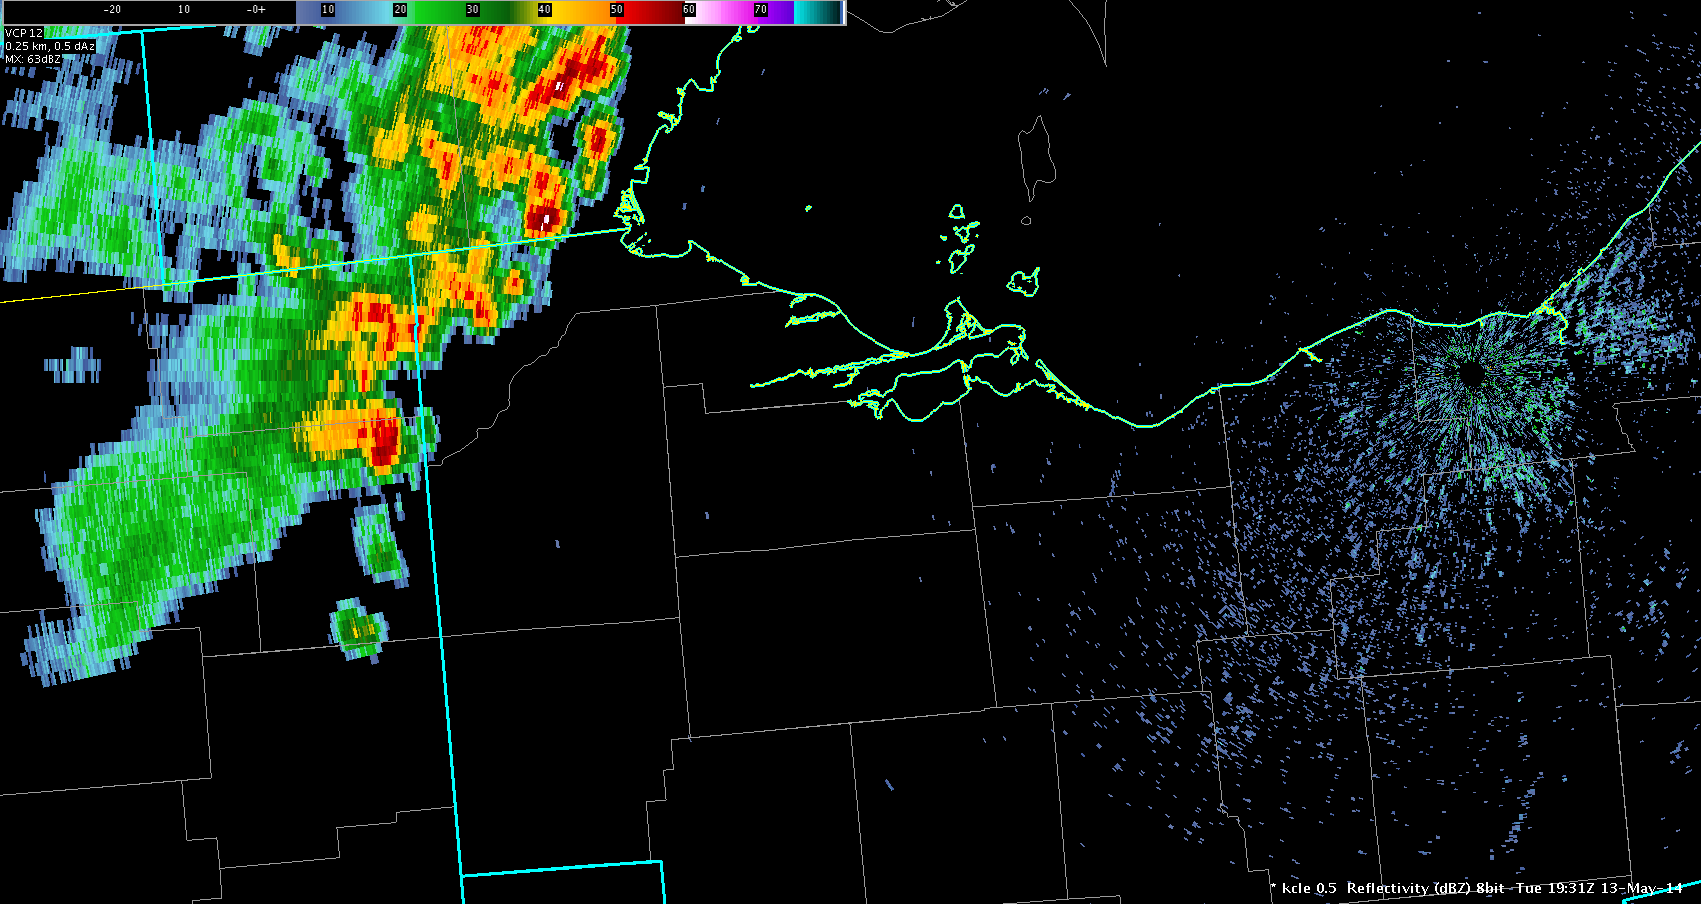
Just 6 minutes later, at 1836Z, the CI product crashed down to an 8% reading for the cloud cluster in the Shenandoah Valley.

obs_ci_rapidvis1836Z


I wondered if this was an erroneous reading, or if the mountainous terrain might be challenging for the GOES-R CI algorithm. I know that the erratic percentage values are of particular interest in this experiment, so when I noticed that sudden change, it caught my attention. In the meantime, the yellow shading on the northern flank of the clouds has actually expanded in scope.

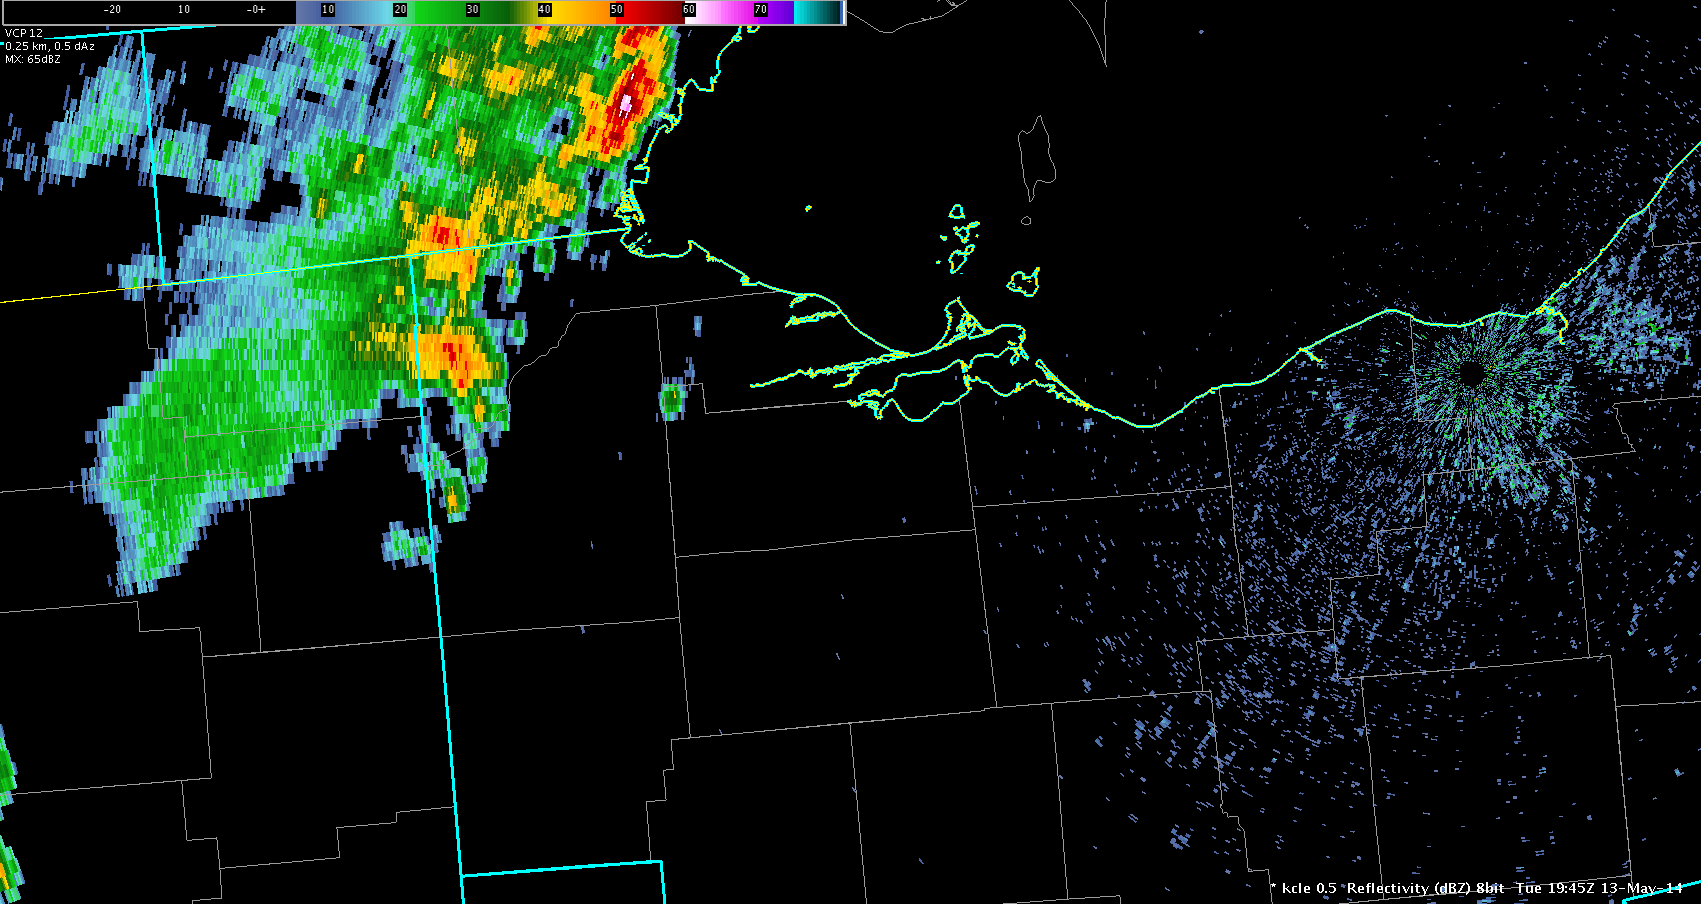
Skipping ahead about 45 minutes, the CI value has jumped back up in the cell in the Shenandoah Valley.

obc_ci_rapidvis1919Z


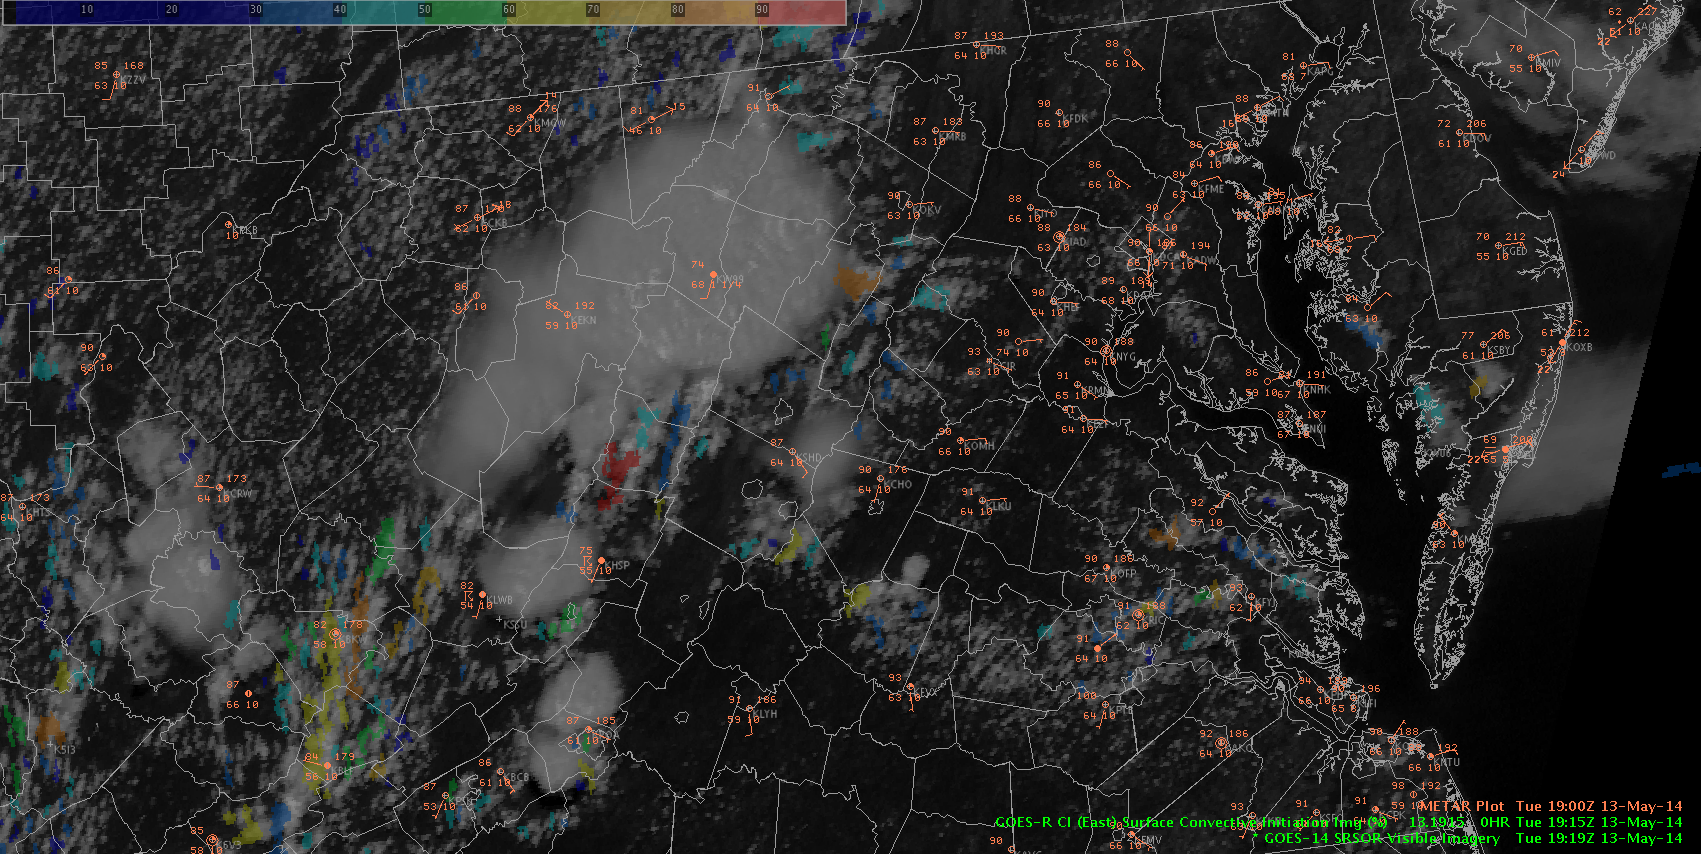
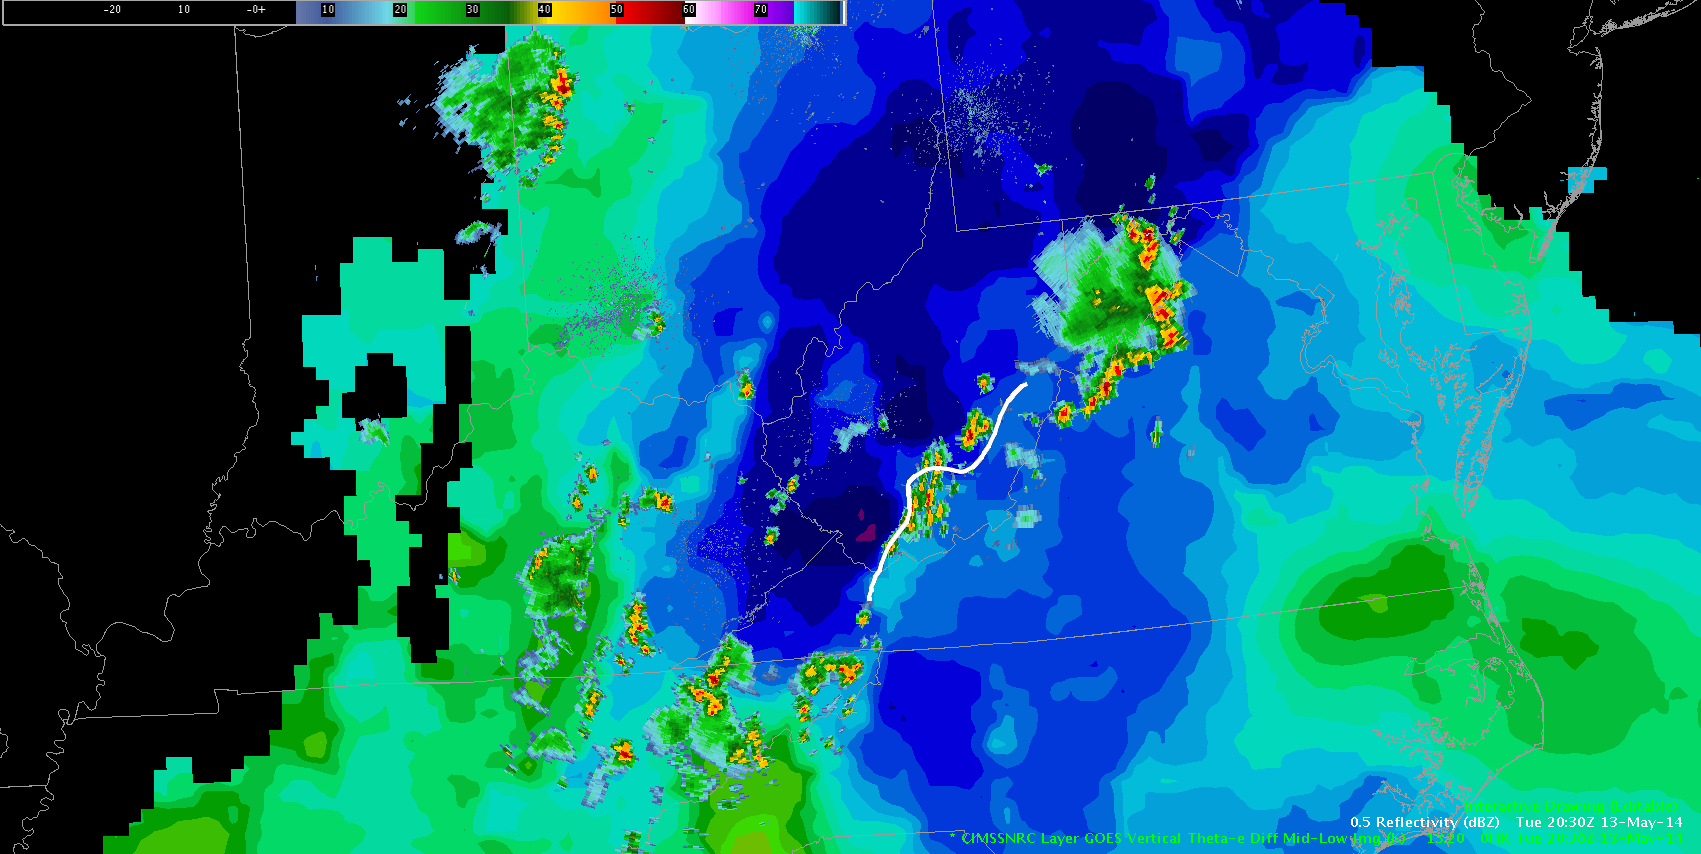
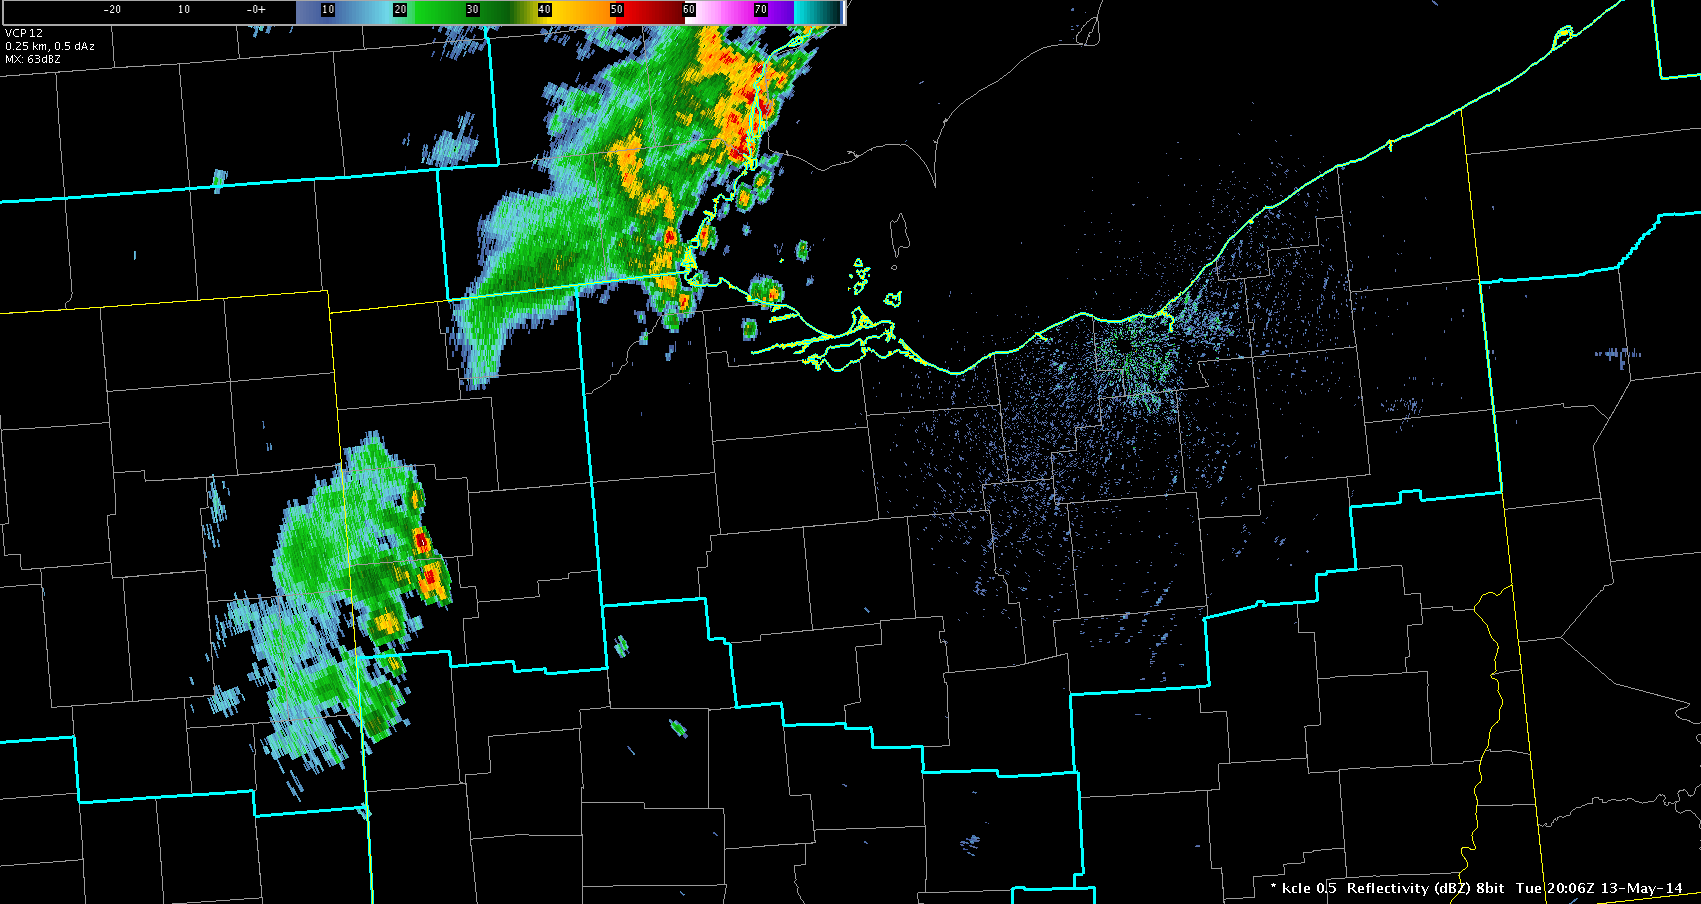
Just about 20 minutes later, a Flash Flood Warning was issued right over this area of erratic CI values. Later, it was confirmed via storm report that a creek overflowed its banks in the area. In the meantime, notice that the CI product has disappeared in the other area of interest in the WV/MD panhandles. At the same time, a SVR was issued for counties in West Virginia that are under that convective cloud shield. Later, a report of quarter-sized hail came in from the warned area, in Washington County, MD.

Obviously, the convective initiation product was not useful for the SVR development in WV because there was already convection happening in the warned area, hours before the storm became severe. It would have been interesting to see the ProbSevere product in this situation, to see if it picked up on any of the severe parameters, including MESH. Hindsight is 20/20!


Tags: None

ProbSevere Overdone in WV – 2308Z

2308Z ProbSevere Product.  Was at 78% at this scan.
2308Z ProbSevere Product. Was at 78% at this scan.

Convection through the day in West Virginia has been strong, perhaps marginally severe at times but no reports have yet been received.  However, I noticed the probsevere tool began to struggle once this convection congealed into a linear segment.  The highest probs appear to be driven by a falsely high MESH value, which was at 1.41 inches at this time.  There was no satellite data going into the probsevere tool at this time.  Looking at reflectivity data, the bulk of the reflectivity (60+ dBz echoes) were below the freezing level, so I’m not quite sure why the MESH was so high.  But this tool was definitely overdone in this instance.

-Deitsch

Tags: None

ProbSevere Model Error

ProbSevereErrorIn this image from 2158z over southern South Carolina the ProbSevere model highlighted an area where there was hardly a cloud in the sky. The readout shows a 78% prob of severe storm with 1600 J/kg MUCAPE, 2.1kts of EBShear and MRMS MESH of 2.08 inches.

Talking with the developer of this model, he indicated this is a known problem associated with QC of the MRMS MESH data.

Shawn Smith


Tags: None

Simulated Satellite Imagery – Rather Poor Performance on May 13

Simulated satellite imagery did not perform too well today on May 13. The simulated imagery seemed to be too slow with the development of storms over the Great Lakes, and depicted too much convection across the Mid Atlantic states at 2200 UTC (second image).  Deep moisture indicated by water vapor satellite moved east faster than simulated.

SimulatedSatelliteImagery1400UTC051314

SimulatedSatelliteImageryComparison22UTC051314 Michael Scotten

Tags: None

Convective Initiation Product over eastern West Virginia

CI_RLX

Click the image for an animated loop of GOES East visible imagery between 16z and 1745z along with the Convective Initiation product.

The color scale on the convective initiation product has been adjusted to three colors to simplify identification of the various probabilities. Blue is a 0-30% probability, Yellow is a 31-70% Probability and Red is 70% to 100%. I feel this helps to show increasing probabilities better than the standard multi-color scale. In the looping image notice the outlined area over eastern W. Virginia to the west of the Shenandoah Valley. Watch how the CI product shows increasing probs starting at 1615z along a ridge top 30 to 45 minutes before a line of thunderstorms exploded along the ridgeline. This product also highlighted these storms about 3 hours before a Satellite Precipitation Estimate message was issued by NESDIS. (1907z)

Shawn Smith


Tags: None

Tuesday 2030Z – NearCast Analysis

Here is the 2030Z forecast from the 20z Nearcast model. White line represents a weak boundary
Here is the same image with current radar overlaid.

This post shows how the Nearcast model did well in depicting a weak north/northwest moving boundary that initiated convection in southwestern WV.  In a rather “pulsey” environment, the ability to pick out this boundary aided in confidence as to where convection was going to form.  Definitely a good tool to use in conditions where forcing is subtle and there is uncertainty on location on CI.

-Deitsch

Tags: None

NearCast – Decreasing 780 mb Theta E = Weakening Storms in NW OH

CIMSS NearCast 780mb Theta E product depicted decreasing values from 15 UTC (first image – around 329 K in NW OH) to 19 UTC (second image – around 327 K in NW OH)  on May 13.  Storms seemed to decrease in coverage and intensity 18-20 UTC in NW OH.  The decrease in mid level moisture around 780 mb may have caused the decrease in storm coverage and intensity. The GOES Vertical Theta-e Differential Mid-Low product showed an increase 15 to 19 UTC from -5 K to +1 K, which may have helped to cause the decrease in storm coverage and intensity.

NearCast780ThetaE15UTC051314

NearCast780ThetaE19UTC051314

CLERef1808UTC051314


CLERef1901UTC051314

CLE0513142006UTC

Michael Scotten


Tags: None

GOES-R Convection Initiation NW OH

The 1930 UTC GOES-R Convective Initiation image on May 13, 2014 depicted yellow  (65%), green (58%), light blue (46%), and several darker blue pixels (less than 40%) across northwest Ohio ahead of a line of storms.  There was a small cell that developed near the green pixel at 1945 UTC (third image below) moved northeast at 1958 UTC (fourth image below).  A cell developed and moved into the yellow and light blue pixel areas at both the 1945 UTC and 1958 UTC images below.
This product seems to do a good job highlighting higher potential areas for convection initiation (if 50% or greater) compared to lower chances (50% or less).

CI1930UTC051314 CLERef1931UTC051314 KCLERef1945UTC051314CLERef1958UTC051314Michael Scotten

Tags: None

Tuesday – 1945Z vLAPS Analysis

Here is the 18Z vLAPS simulated reflectivity valid at 1945Z
Here is the actual reflectivity at 1945Z

Overall, the vLAPS is performing a bit better today.  It’s still a bit too slow with the linear band of convection, again likely not catching the cold pool that has accelerated east with the convection in reality.  But it does hint at storm structure, with generally a disorganized line with some embedded bowing structures, some of which have been severe given decent low-level lapse rates and inverted-v soundings. So overall, it’s done pretty well and certainly useful in an operational setting.

Tags: None