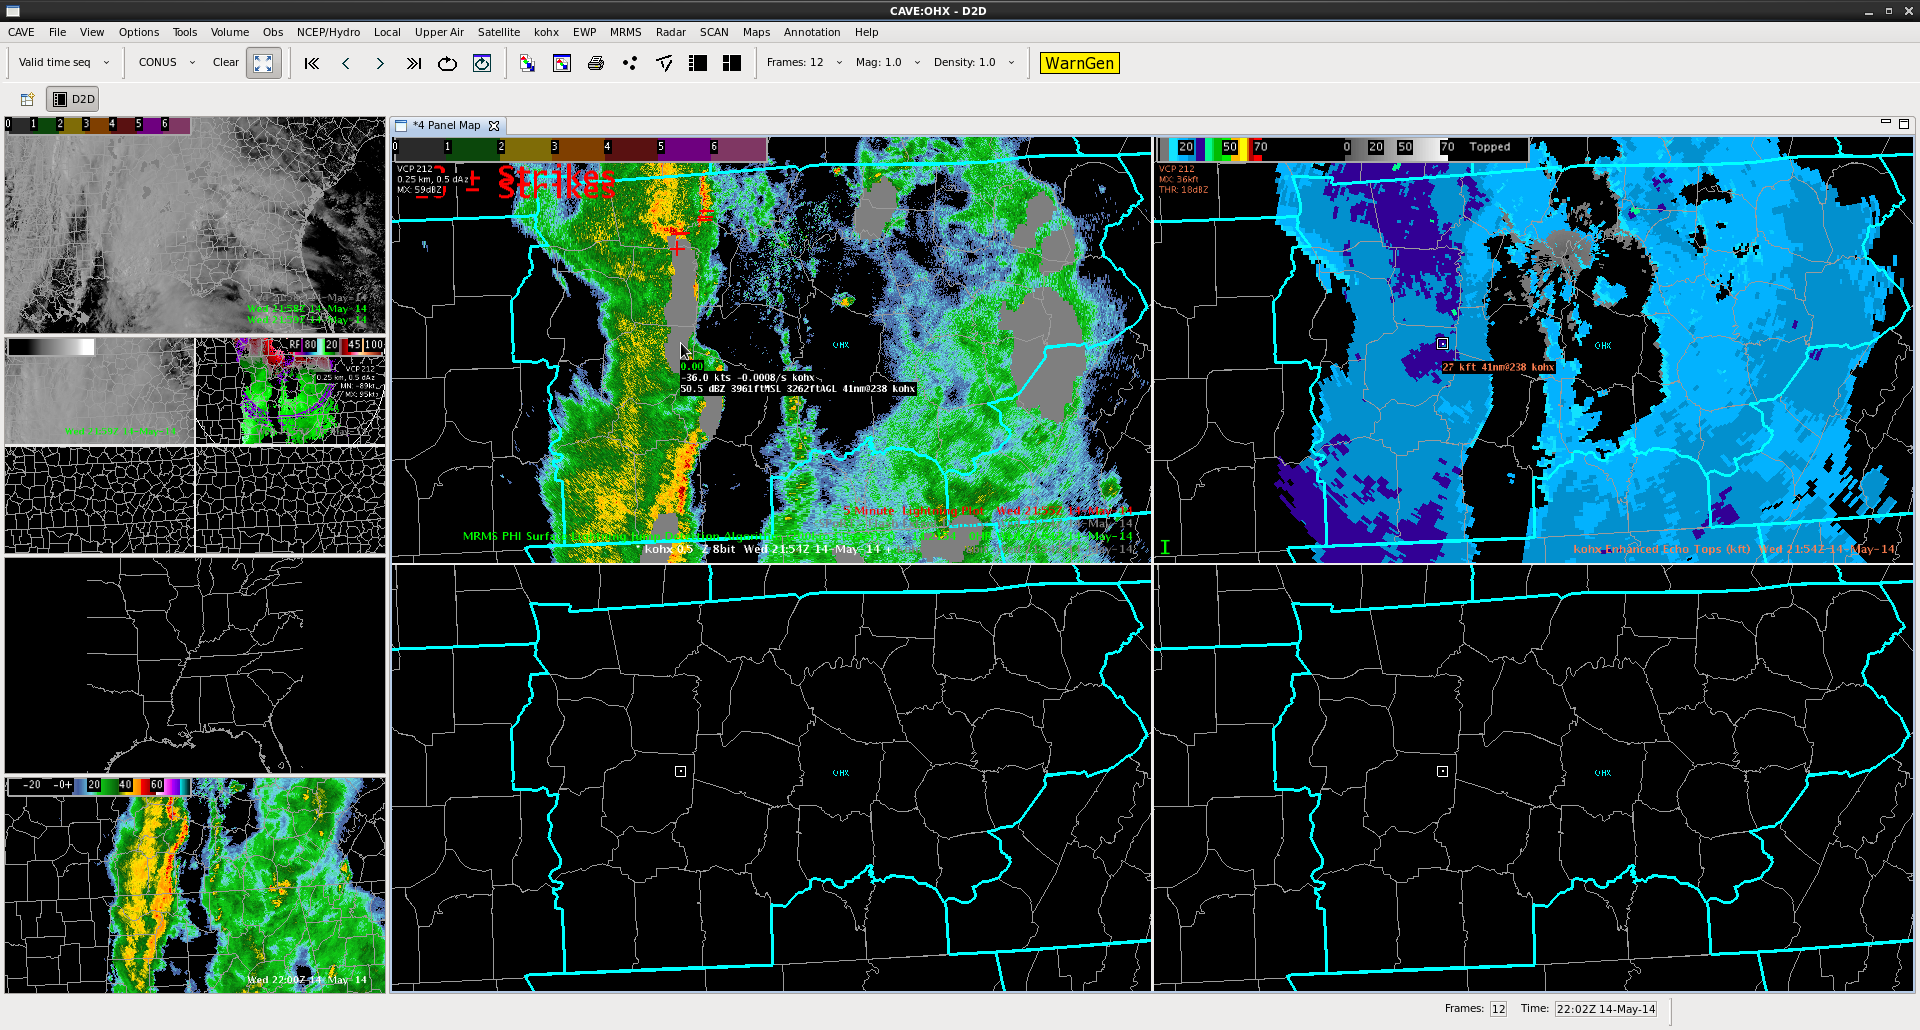
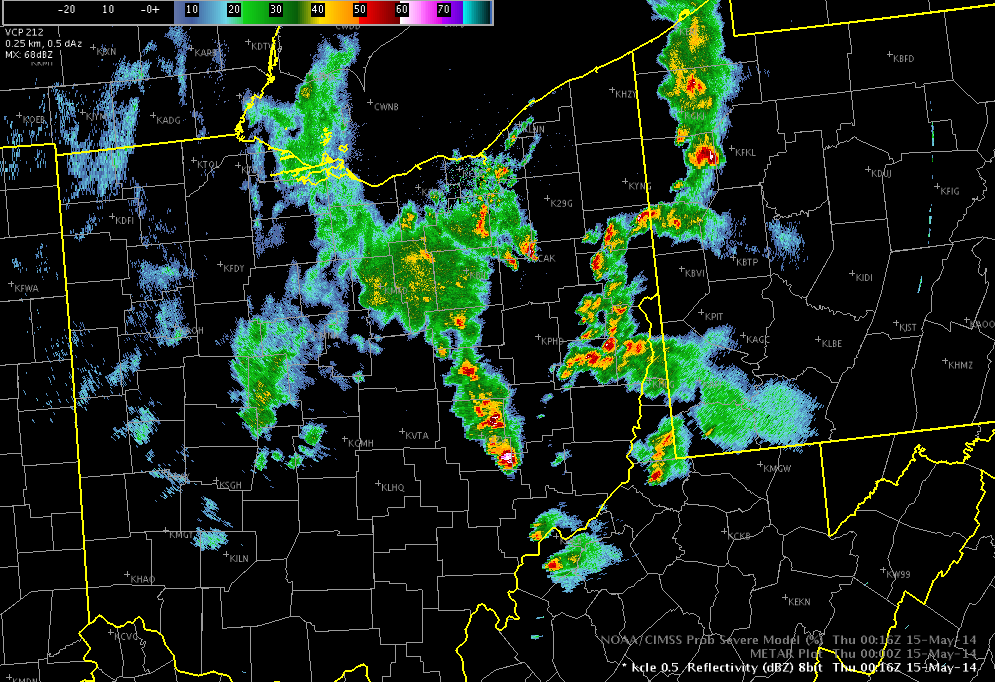
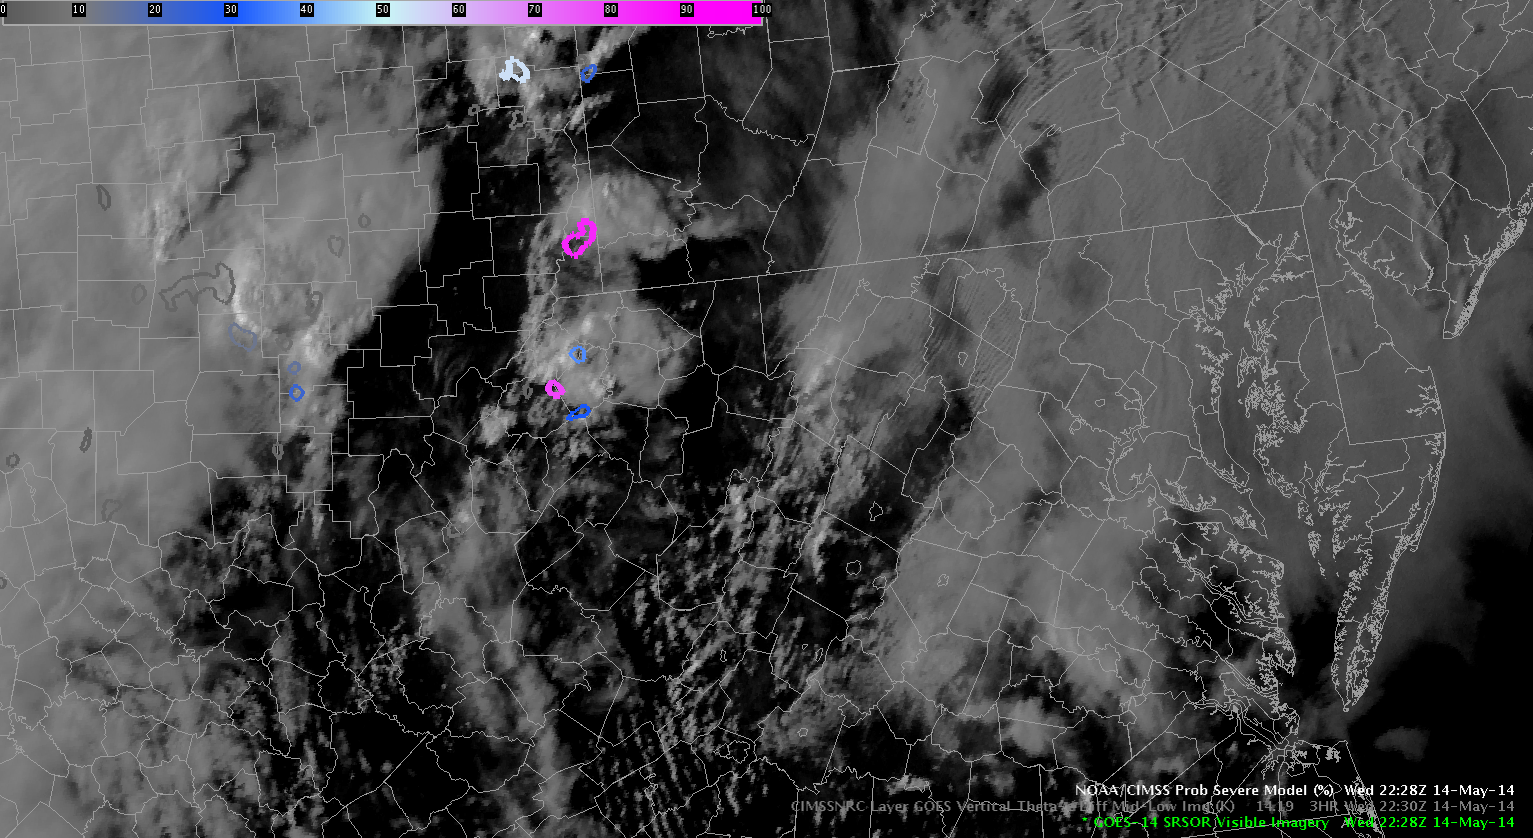
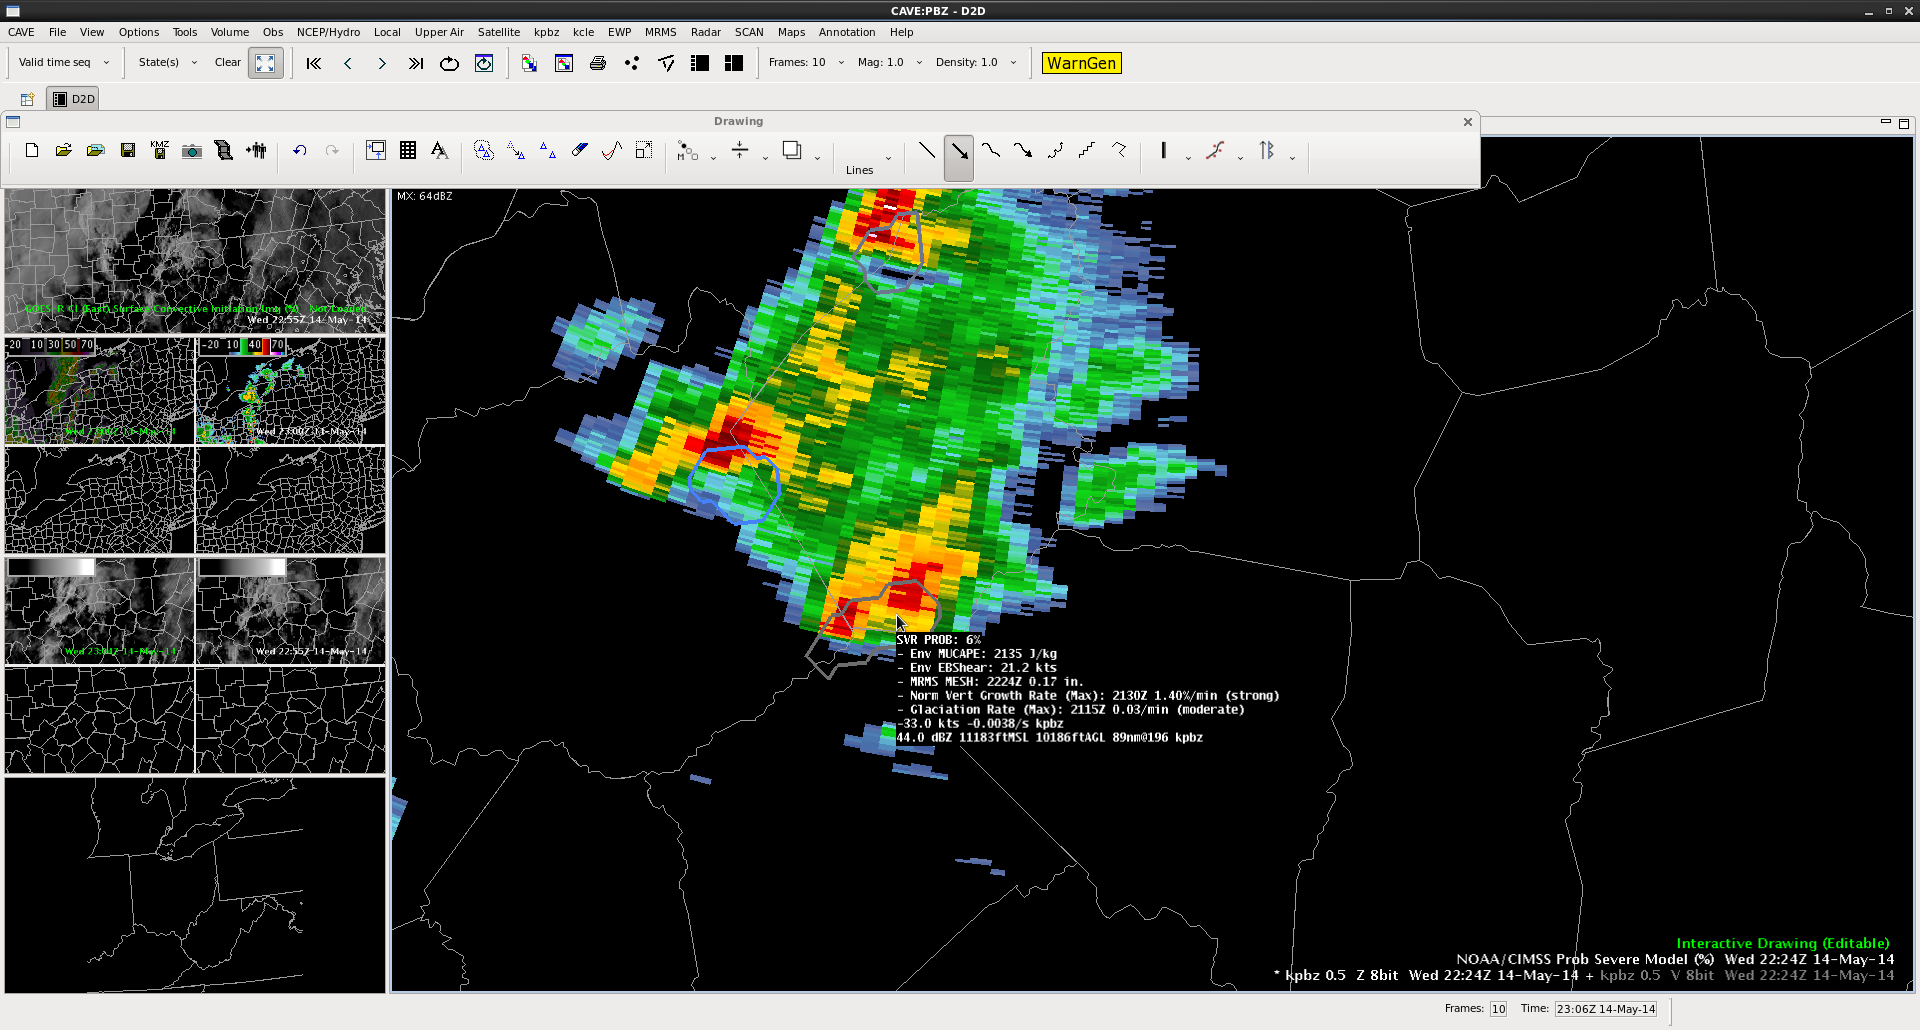
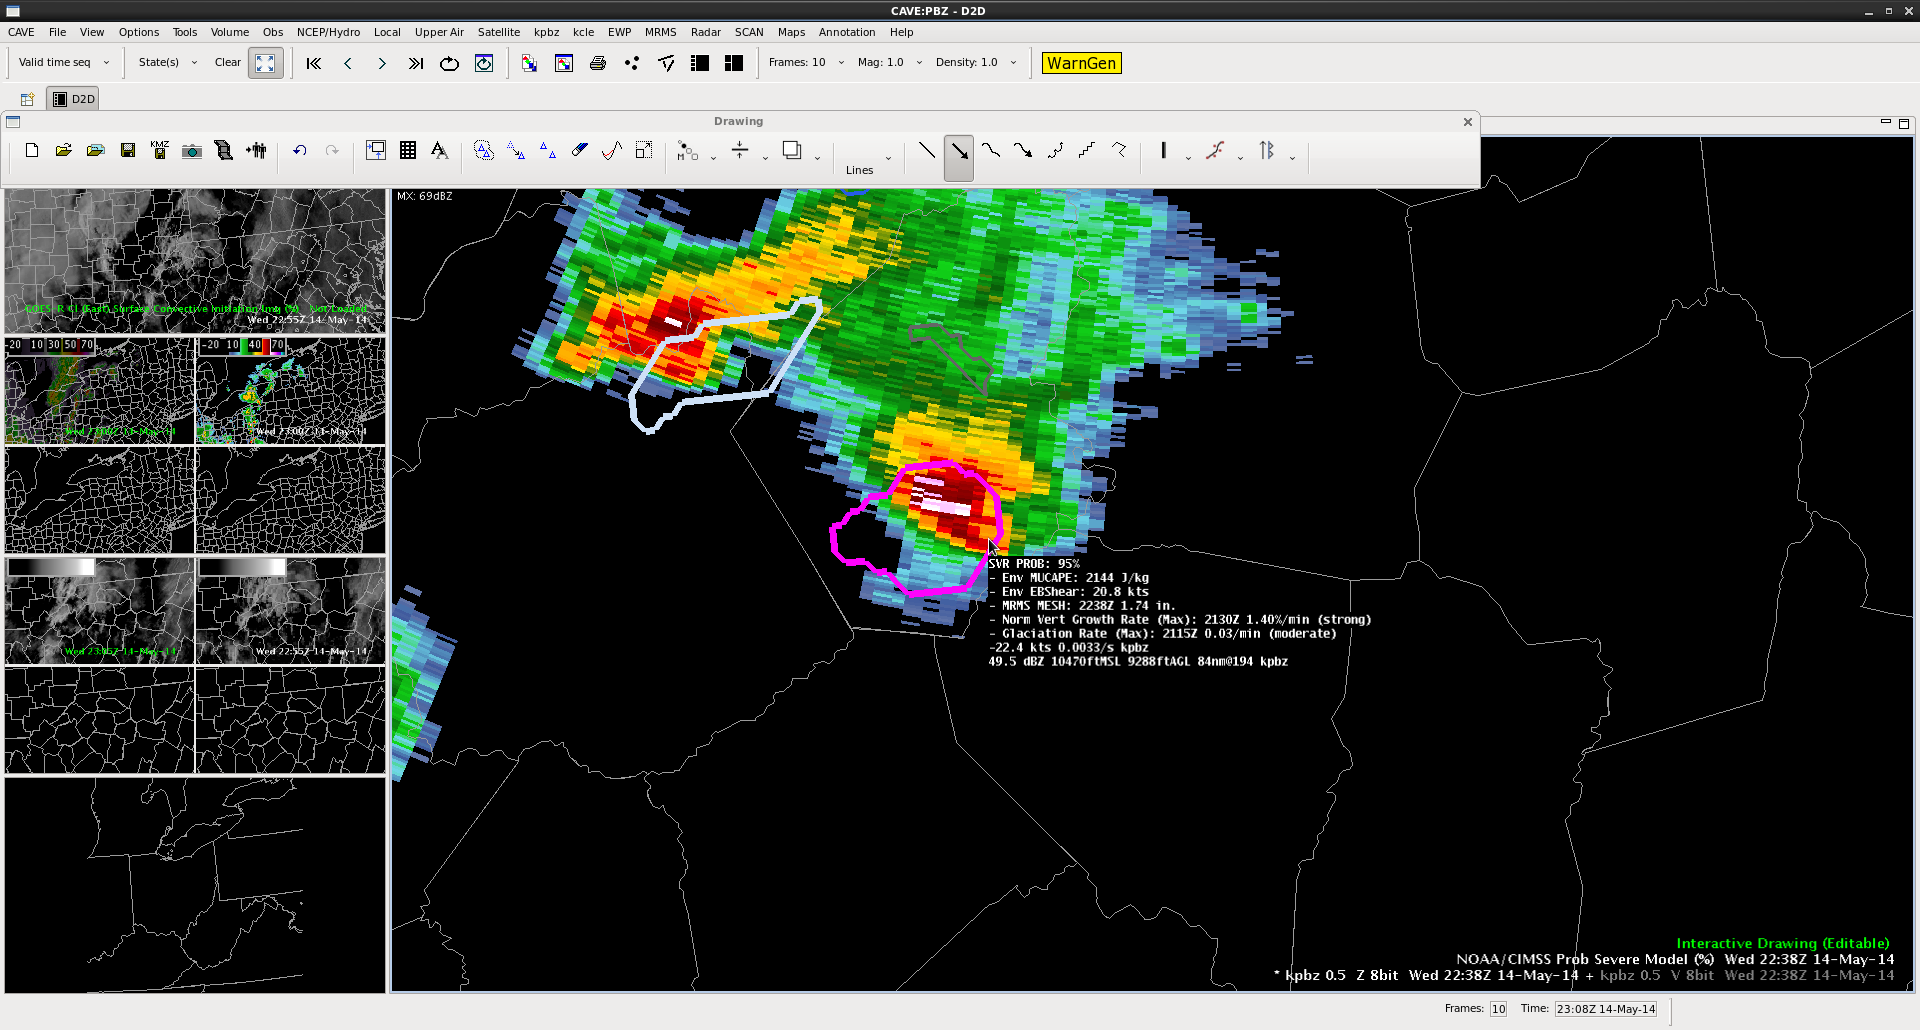
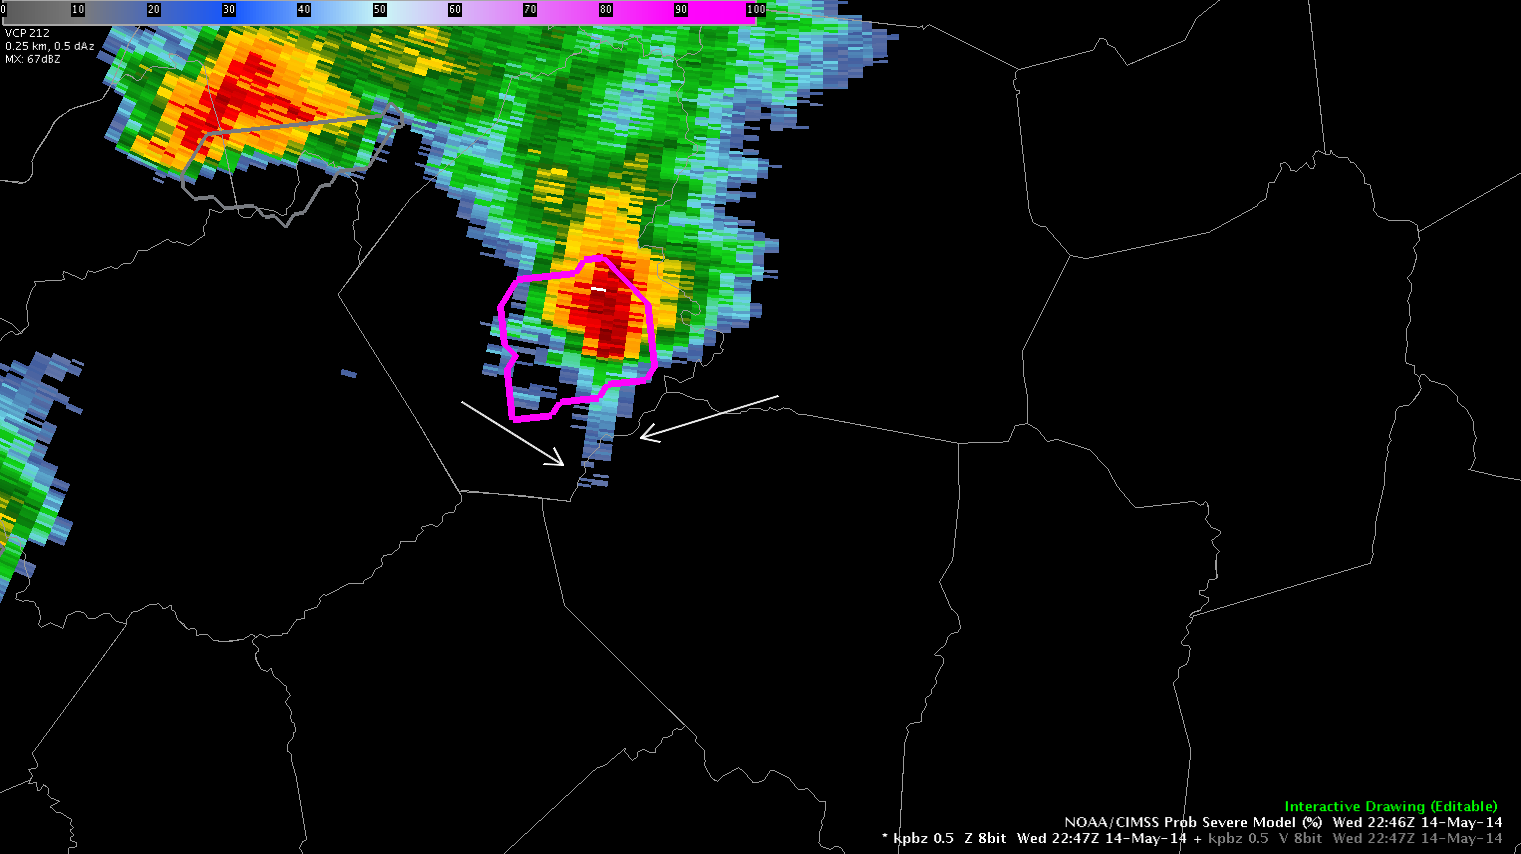
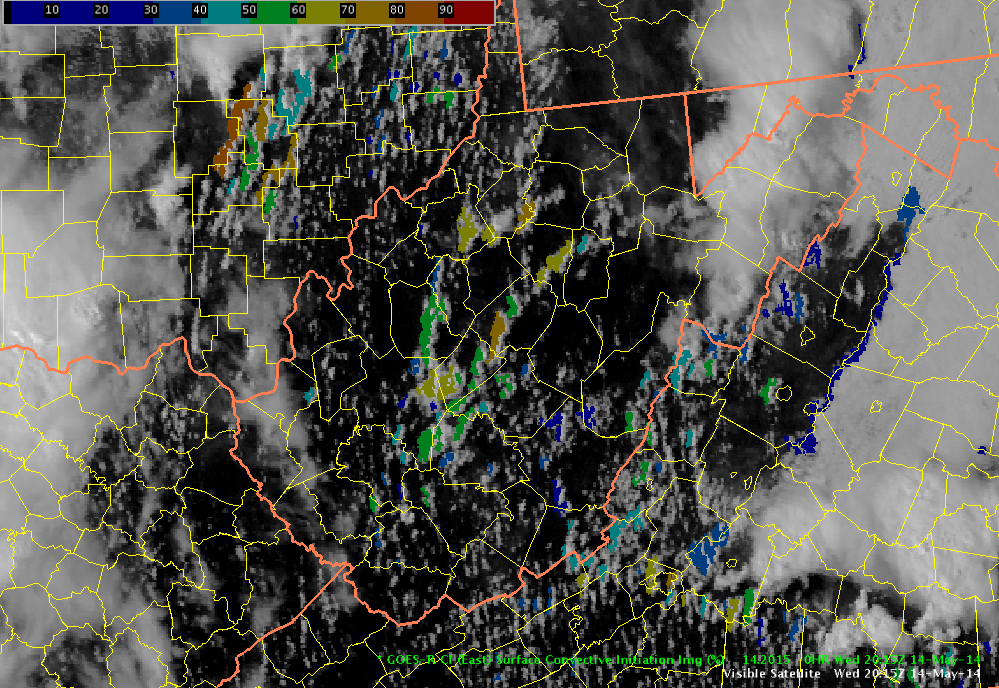
The ProbSevere model was useful in spotting a convective cell that popped up in the Pittsburgh area late in the afternoon. The rapid scan GOES imagery, overlaid with ProbSevere, shows a few cells worth keeping an eye on. The northernmost shapefile in pink was in an area that I otherwise would have ignored, because I didn’t see any visual cues in the visible imagery that indicated convection in the immediate area of the pink outline.
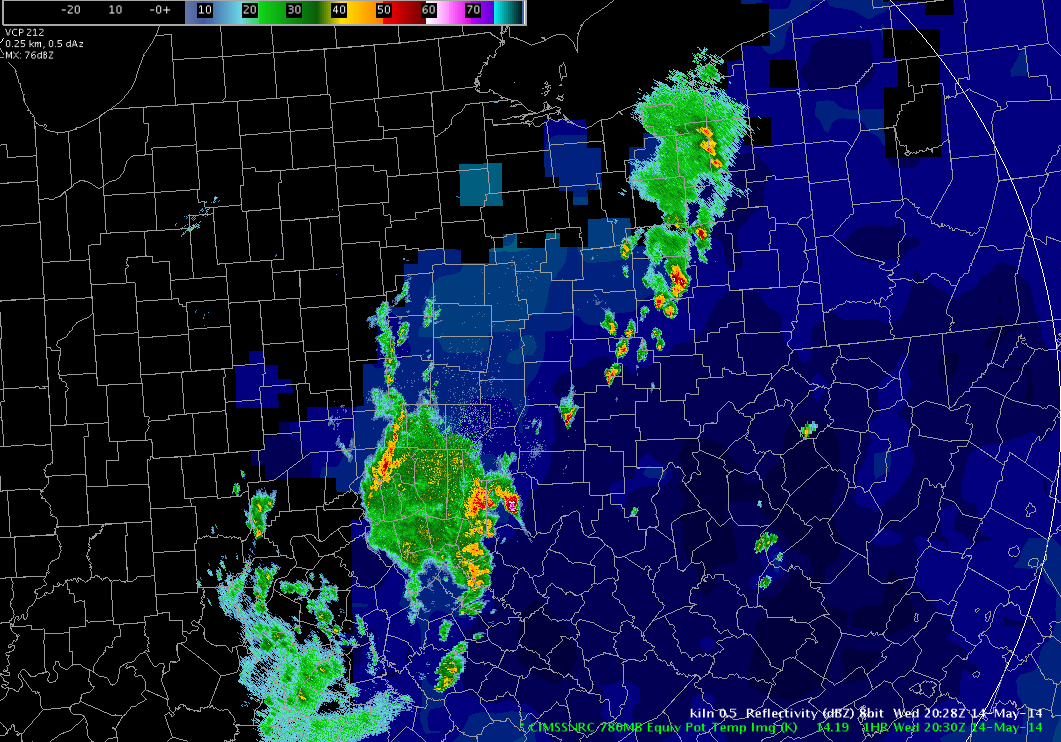
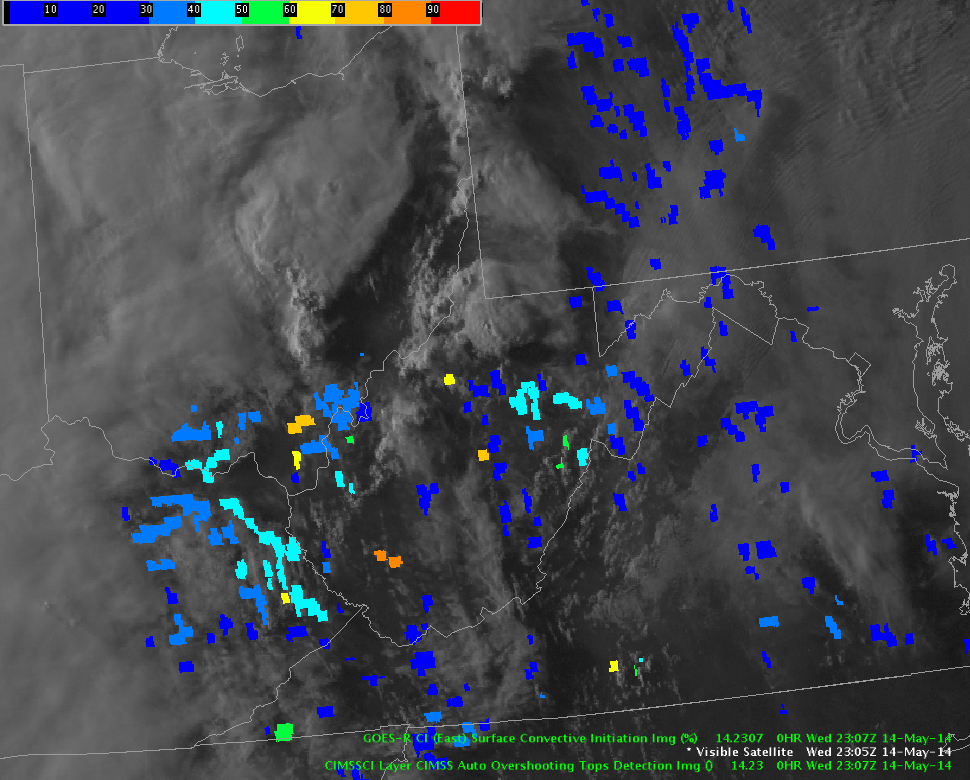
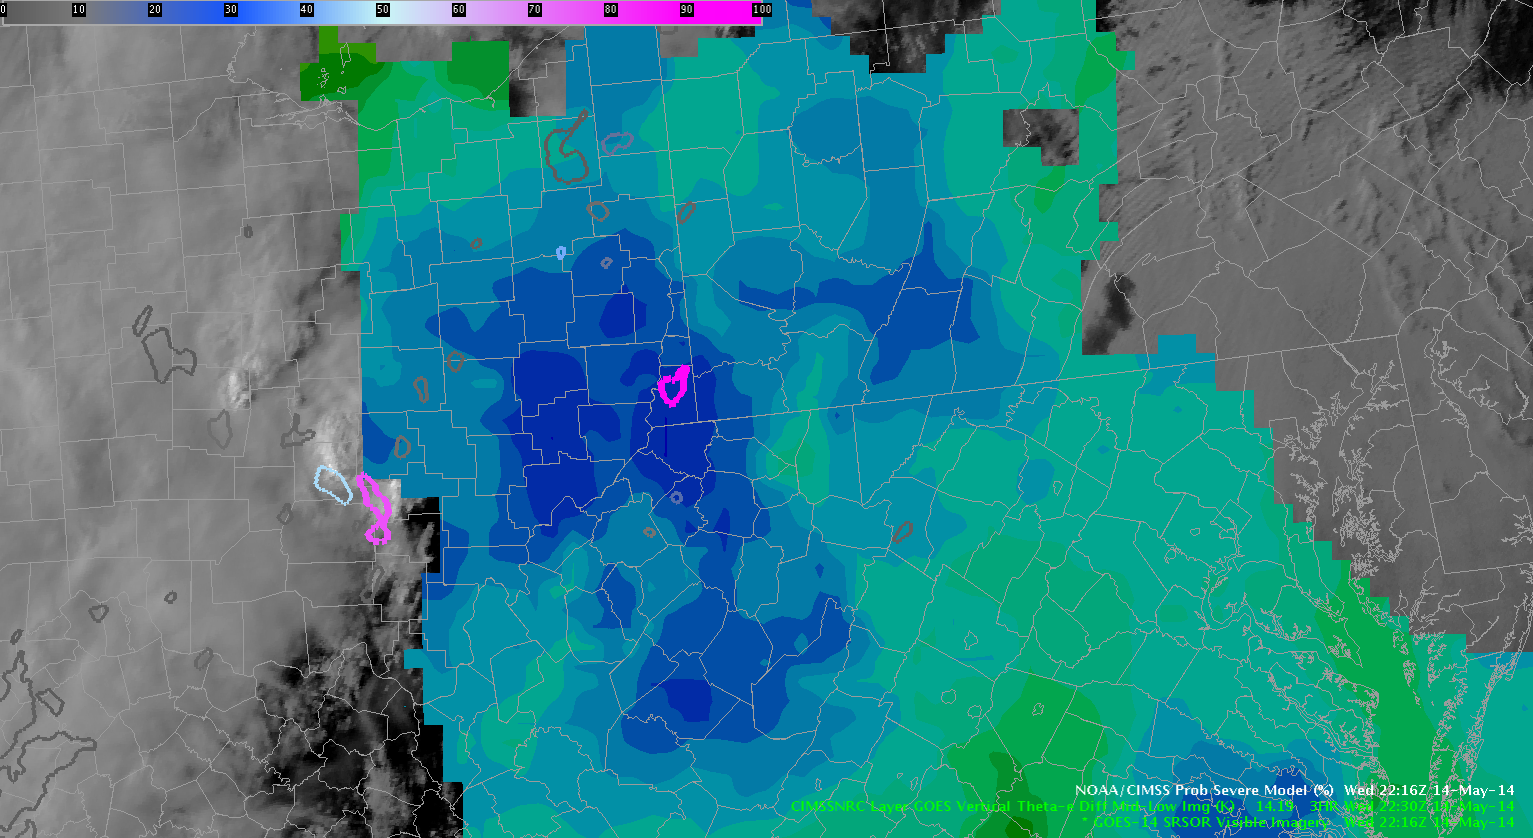
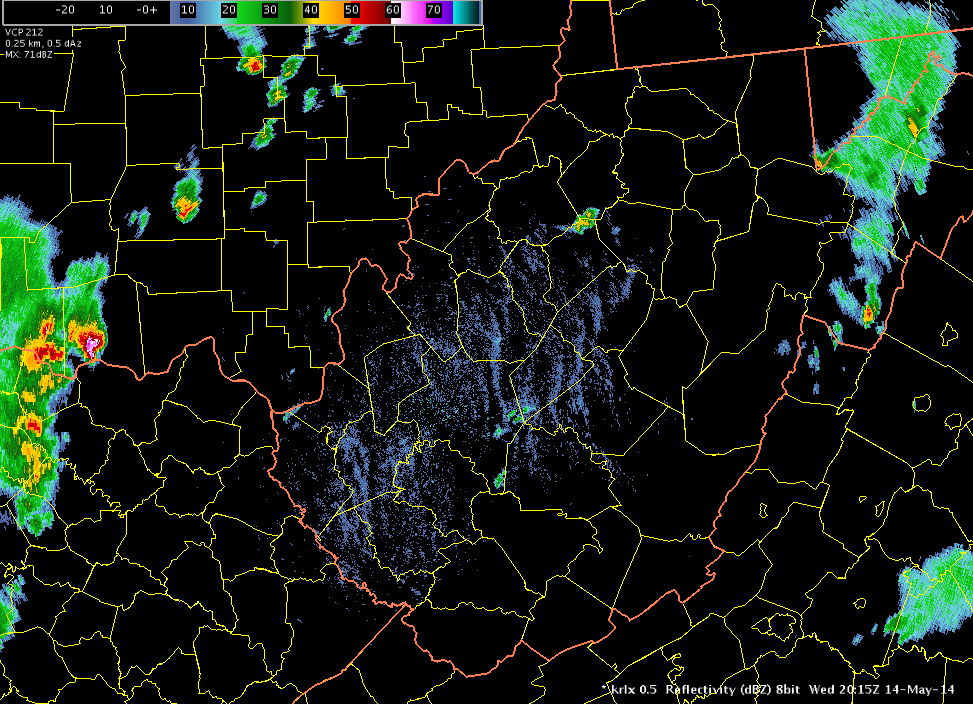
 At the time when I was looking at this cell, I also had the Theta-e differential overlaid, to see if that was pointing out any unique features. I dialed down the opacity of the color table so it wouldn’t interfere too strongly with the high-res sat data. For the picture below, I pushed the opacity back up to clearly show the colors. As you can see, there is a relative maximum over the ProbSevere shapefile of about -9.0K, but without the ProbSevere shapefile, this area wouldn’t have caught my attention, since there are other areas with that same intensity, and the values weren’t too impressive, either. That said, the -9K blob on the right was in an area with developing Cu, whereas the blob on the left didn’t have Cu development yet. So I guess in retrospect, I could have taken notice to the area with relatively high Theta-e difference in conjunction with the developing clouds. I do feel like the ProbSevere gave a jump on any visual confirmation I might have made on changing cloud structure, because like I said before, the clouds did not look that impressive to me.
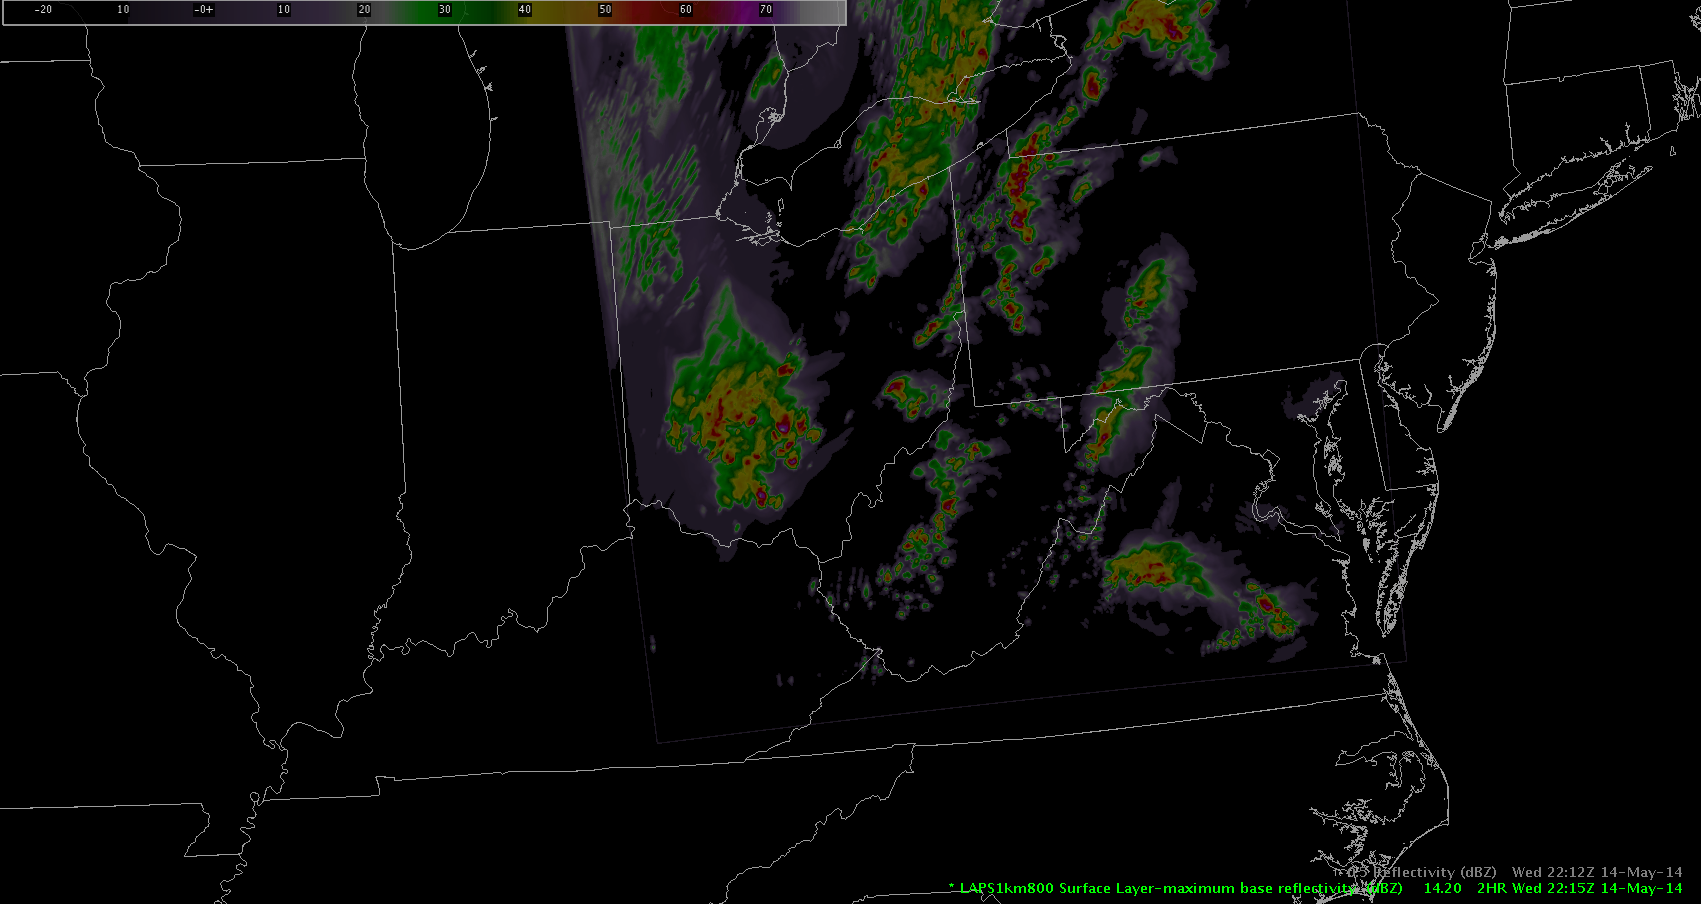
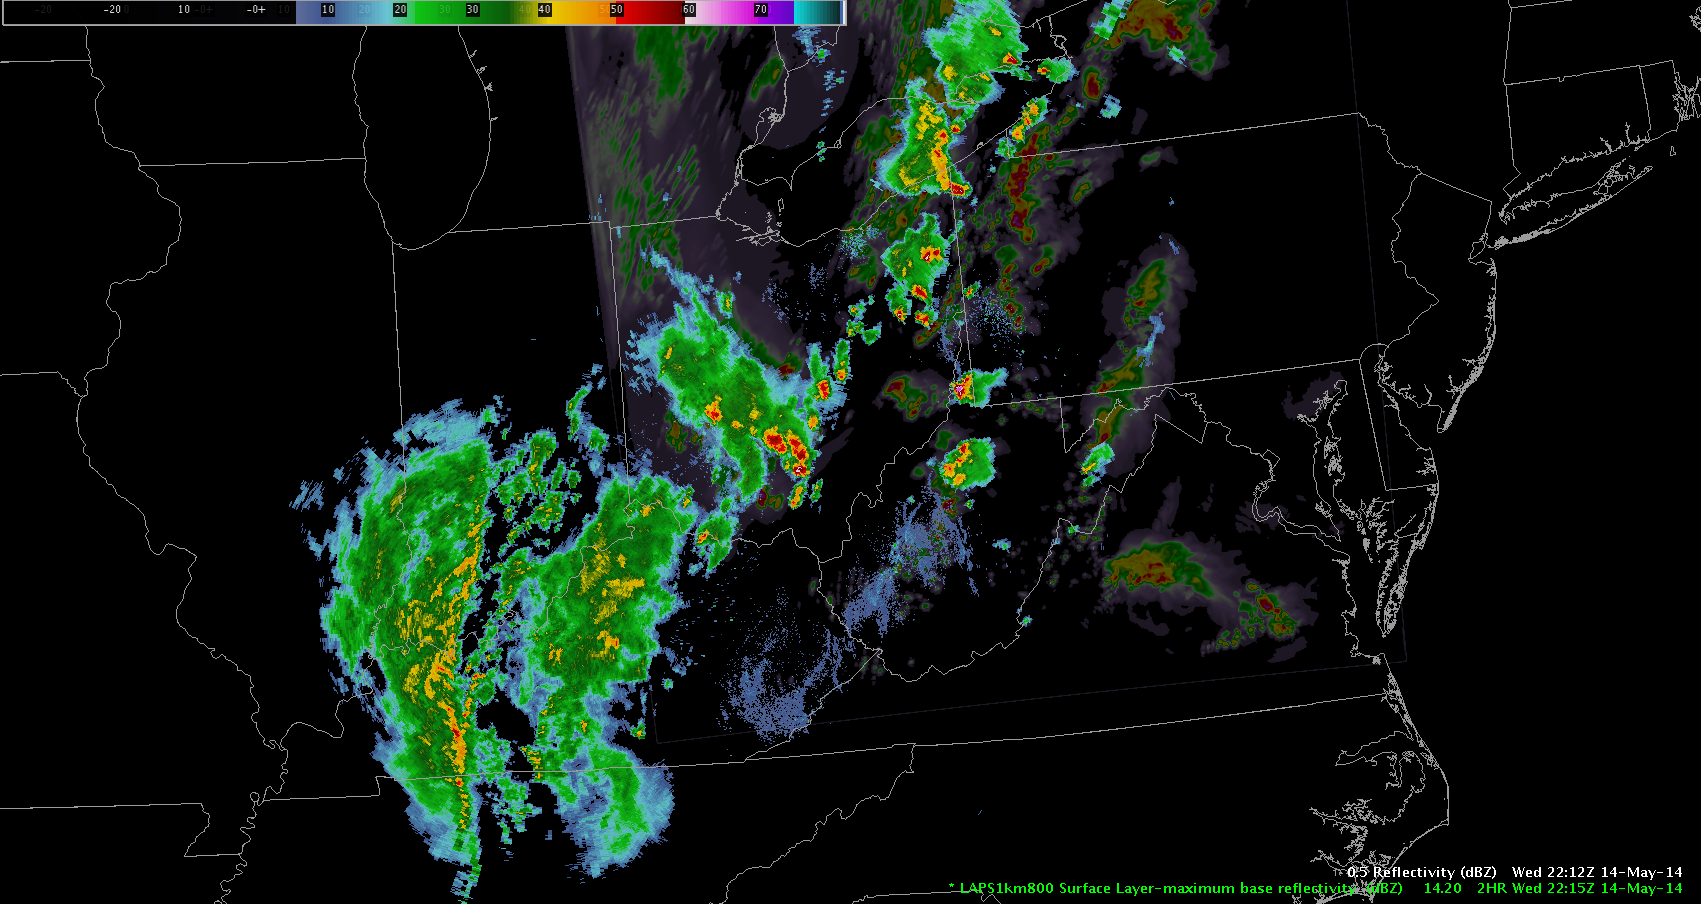
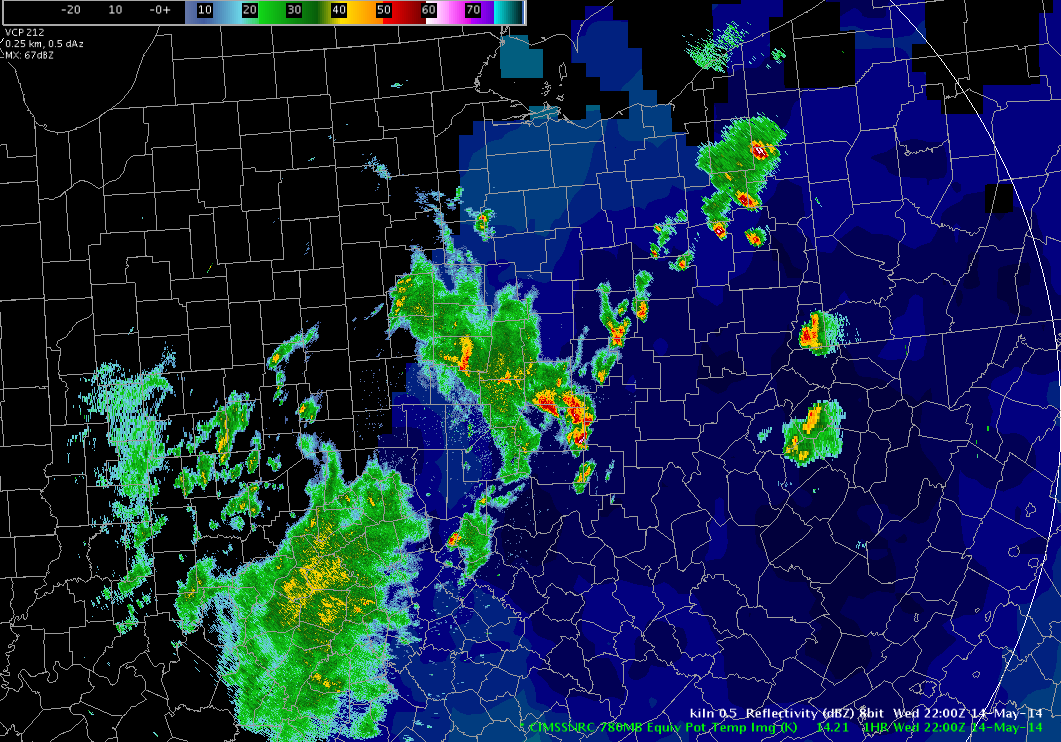
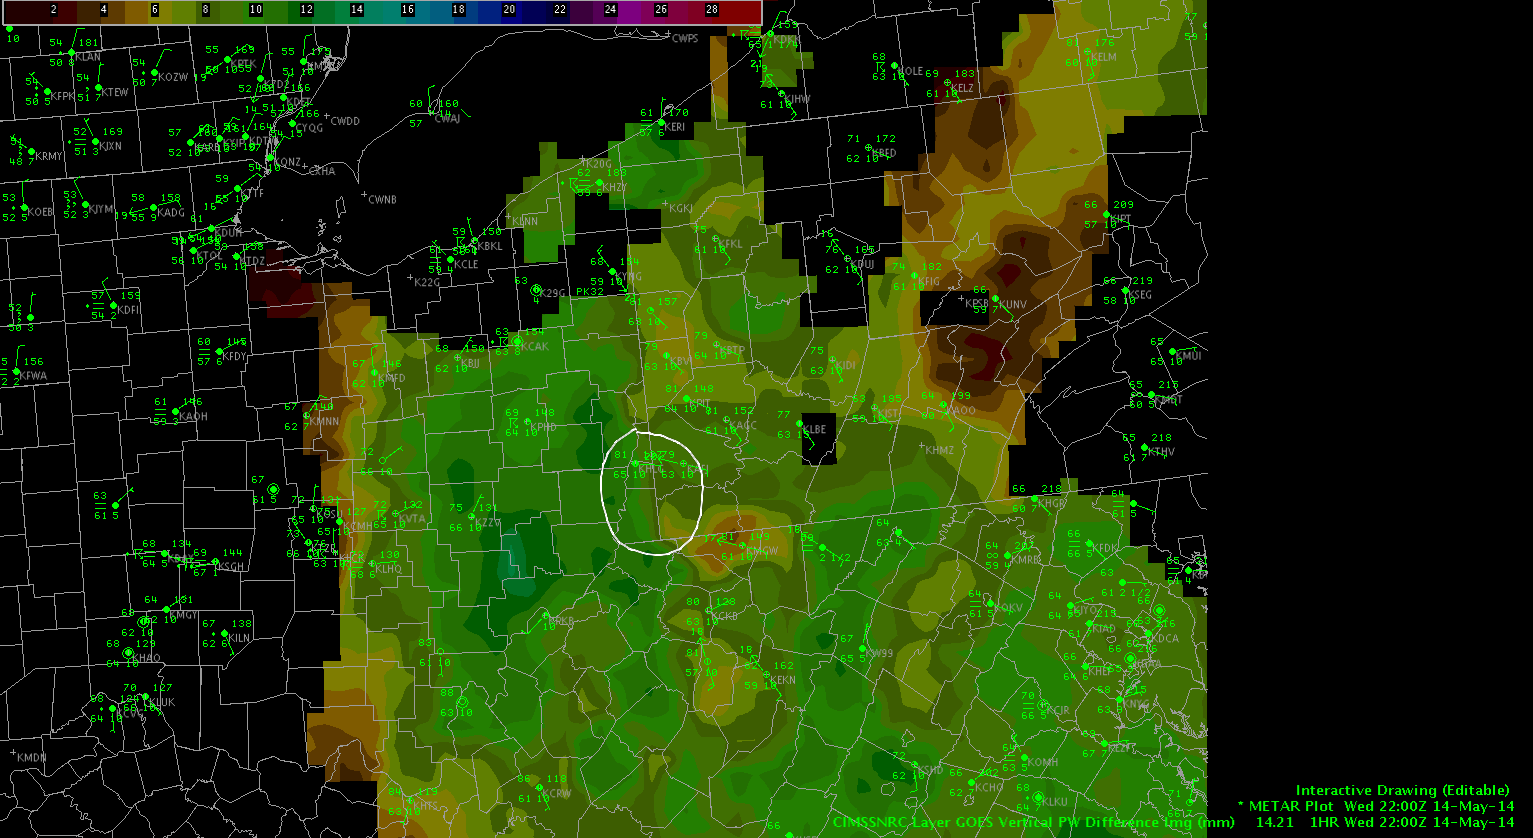
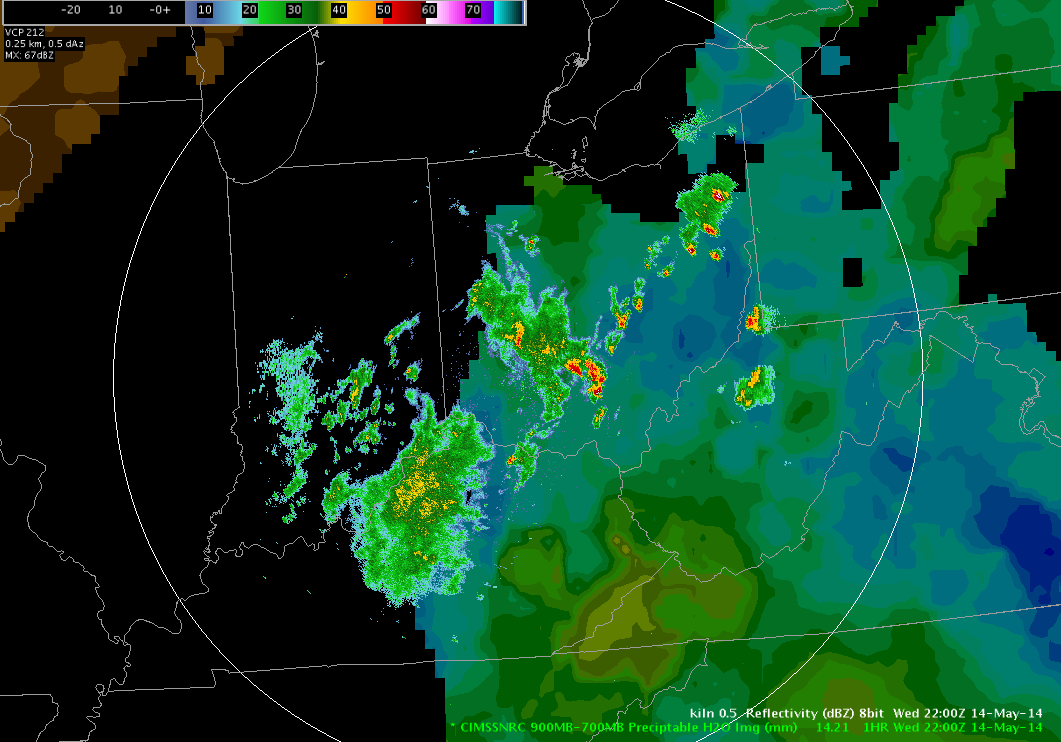
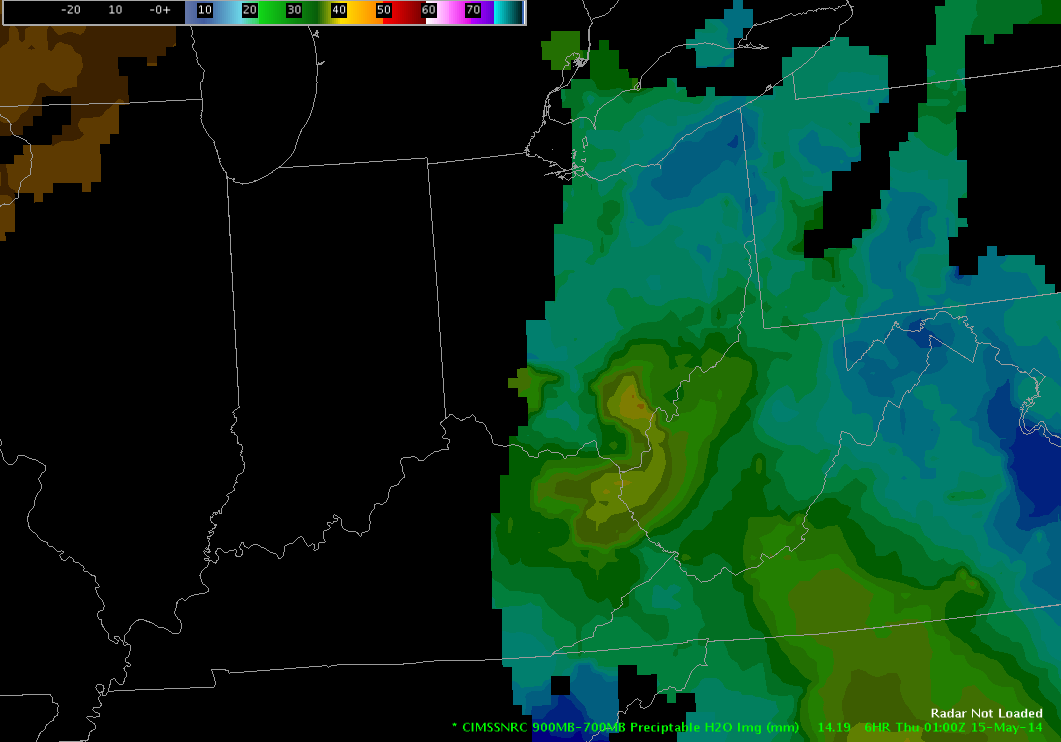
 The vertical PW difference wasn’t showing any impressive values, either, but something that’s worth noting is the gradient that formed right in the warned area. As we know, gradients are conducive to volatility, and the storm’s path actually tracked right along this gradient, moving due north. The image below is valid at 22:00Z. A warning was issued in the circled area at 22:27Z.
 This cell had been warned earlier in the afternoon, and redeveloped. The ProbSevere model might prove to be very useful for tracking storm cells, not just before they become severe. It could also be useful after a storm loses its severe characteristics by tracking its redevelopment potential.This could be very useful for a forecaster to help them sift through the clutter, especially in events with lots of pop-up cells and in linear MCS events.


 Michael Scotten