Simulated Water Vapor Speed Max

Analysis of the simulated water vapor imagery compared to the actual water vapor imagery at 13Z indicated the simulated model had a good handle on the speed max that was located over western KS at 12Z. Although the simulated water vapor/IR was to agressive on TSRAs over western NEb at 13Z this leads to confidence in the position of the speed max later in the day on the simulated water vapor.

-JB

simulated_wv_20_13

Tags: None

PGLM, Lightning Jump, and Quarter size hail

lightning_jump_storm_4sigma_5sigma

Example lightning jumps from just east of Denver CO at 2251 UTC. The image above shows the lightning jump feature (shaded purple), flash initiation density (FID; pink boxes) and the meteogram output information.  The top two panels are the sigma levels at which lightning jump occurs, and the bottom panel is the total flash rate from the PGLM.   The Tracking meteogram outline is the white circles encompassing the storm.  Two lightning jumps occur at 2249 and 2251 UTC.  The first jump occurs as the total flash rate from the PGLM reaches 10 flashes per minute (4 sigma level; anything above 2 sigma indicates a lightning jump according to Schultz et al. 2011), and the second jump occurs with the larger increase in total lightning from 5 flashes a minute to 15 flashes per minute (6 sigma).  The jumps are indicating increases in updraft strength and volume,and can be used as a metric in storm intensification.  Quarter size hail was reported approximately 20 minutes later at 2310 UTC.

*note the flash rates are likely higher with this storm because the LMA used in this case only had 5-8 sensors active at any given time.*

Jump in Prob Severe

We have now switched CWA to LOT and have loaded in the MRMS composite reflectivity overlaid with ProbSVR. It is interesting to compare this area to what we were seeing to the west. In eastern WY the probabilities were lower despite rotation on velocity products and supportive 3-dementional reflectivity of a BWER. For the LOT CWA there is very high probabilities.

-JB

prob_svr_diff

Tags: None

Prob. Severe Model and Dual-Pol

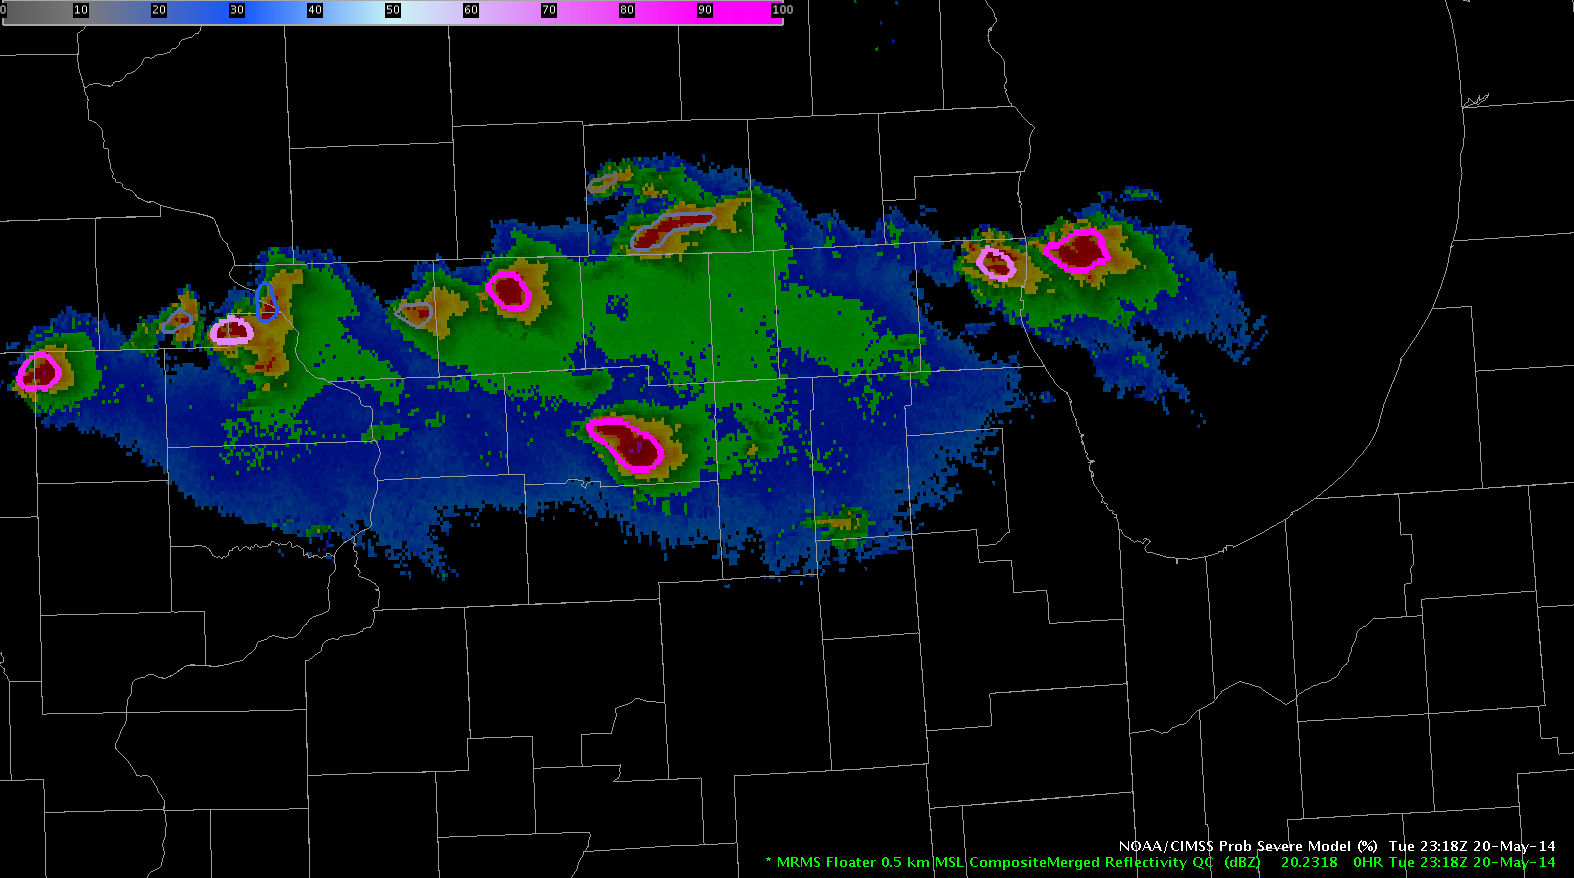
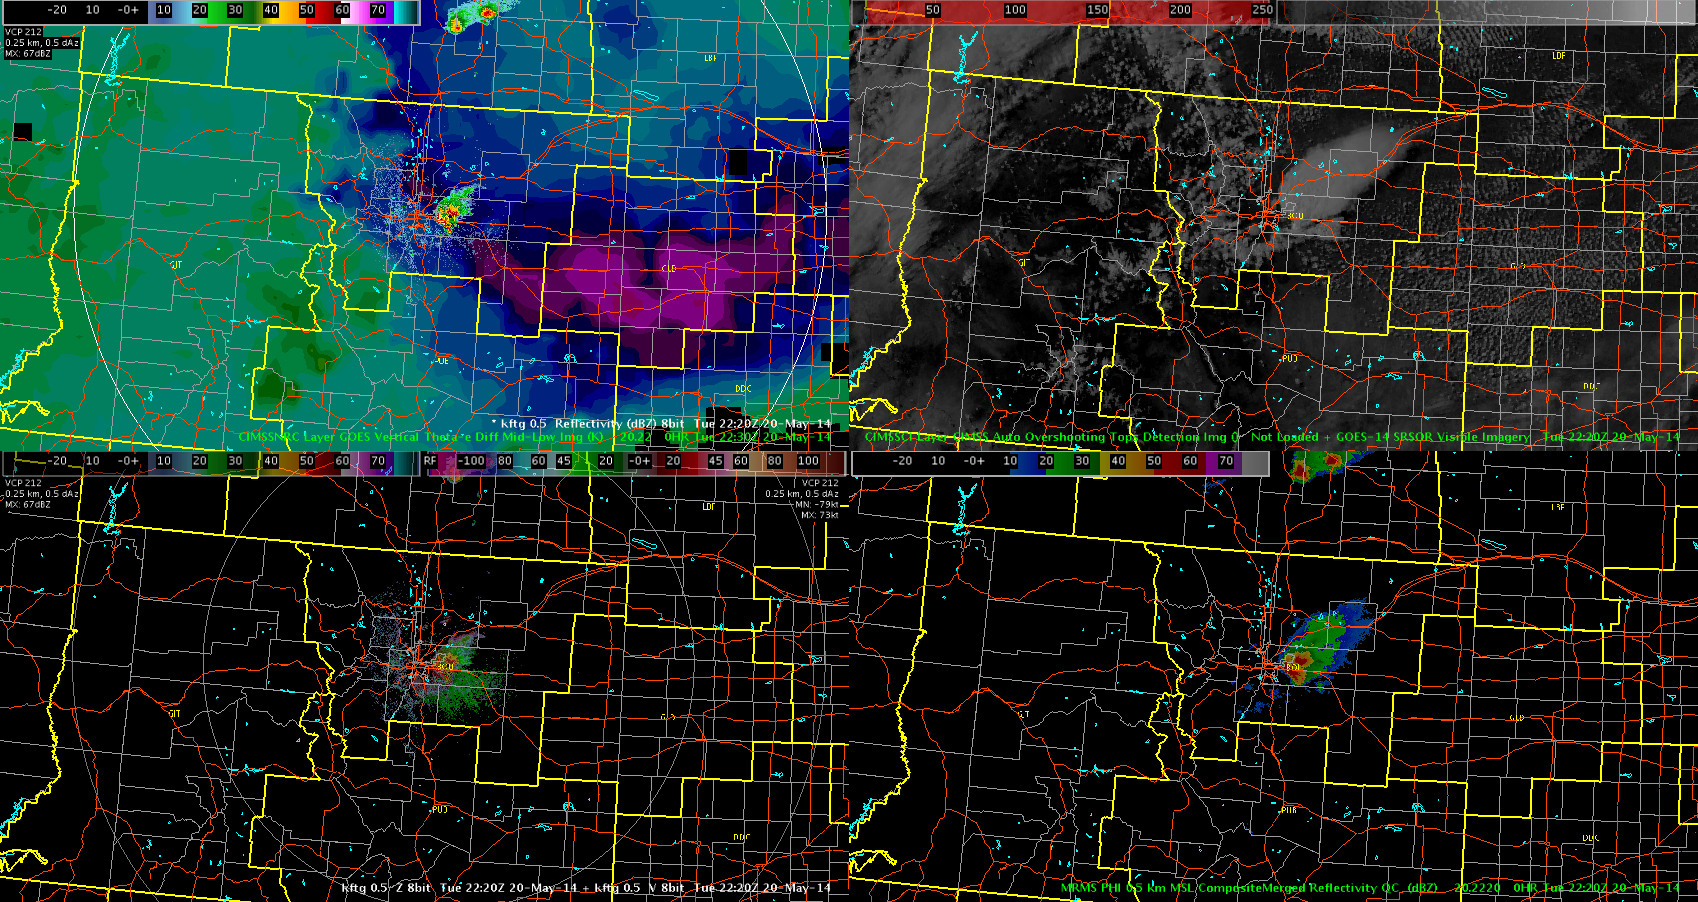
The prob. severe model has been a great way to grab attention to storms that need to be monitored for the developing convection over the northern DVN CWA. Taking a look at how well it verified with dual-pol products and spotter reports, this screen capture (below) shows the prob. severe model overlaid on ZDR (upper right) and then 0.5 base reflectivity in the upper left, KDP on the lower left, and CC on the lower right. Based on the severe prob (shows 94% at 2138Z), my partner issued a Severe Thunderstorm Warning ten minutes prior to this screen capture as the probability trend was increasing over time. Having the ability to look at the parameters detailing more specifics about what the model is analyzing is very helpful in maintaining awareness with a particular storm. The MUCAPE (2325 J/kg, shown) and effective bulk shear (50.3 kts., also shown) being consolidated into one quick click of a mouse is much faster and easier than going to pull up the RAP elsewhere and analyzing the local storm environment. One other parameter that might be helpful is effective SRH. As for the other current, existing parameters, the same could be said as the other two above: the MRMS MESH, while overdone, provides an opportunity to monitor trends; and the satellite progs with annotations indicating whether or not the vertical growth rate and glaciation rate is moderate, strong, etc. is helpful and allows for increased confidence when utilizing this tool with other, more traditional methods. Without knowing how the exact values with respect to the satellite-tracking rates translate to growth/decay, the annotations deciphering what the values mean is critical to understanding the storm’s trend.

2138Z_ProbSvrwithDualPol_cropped

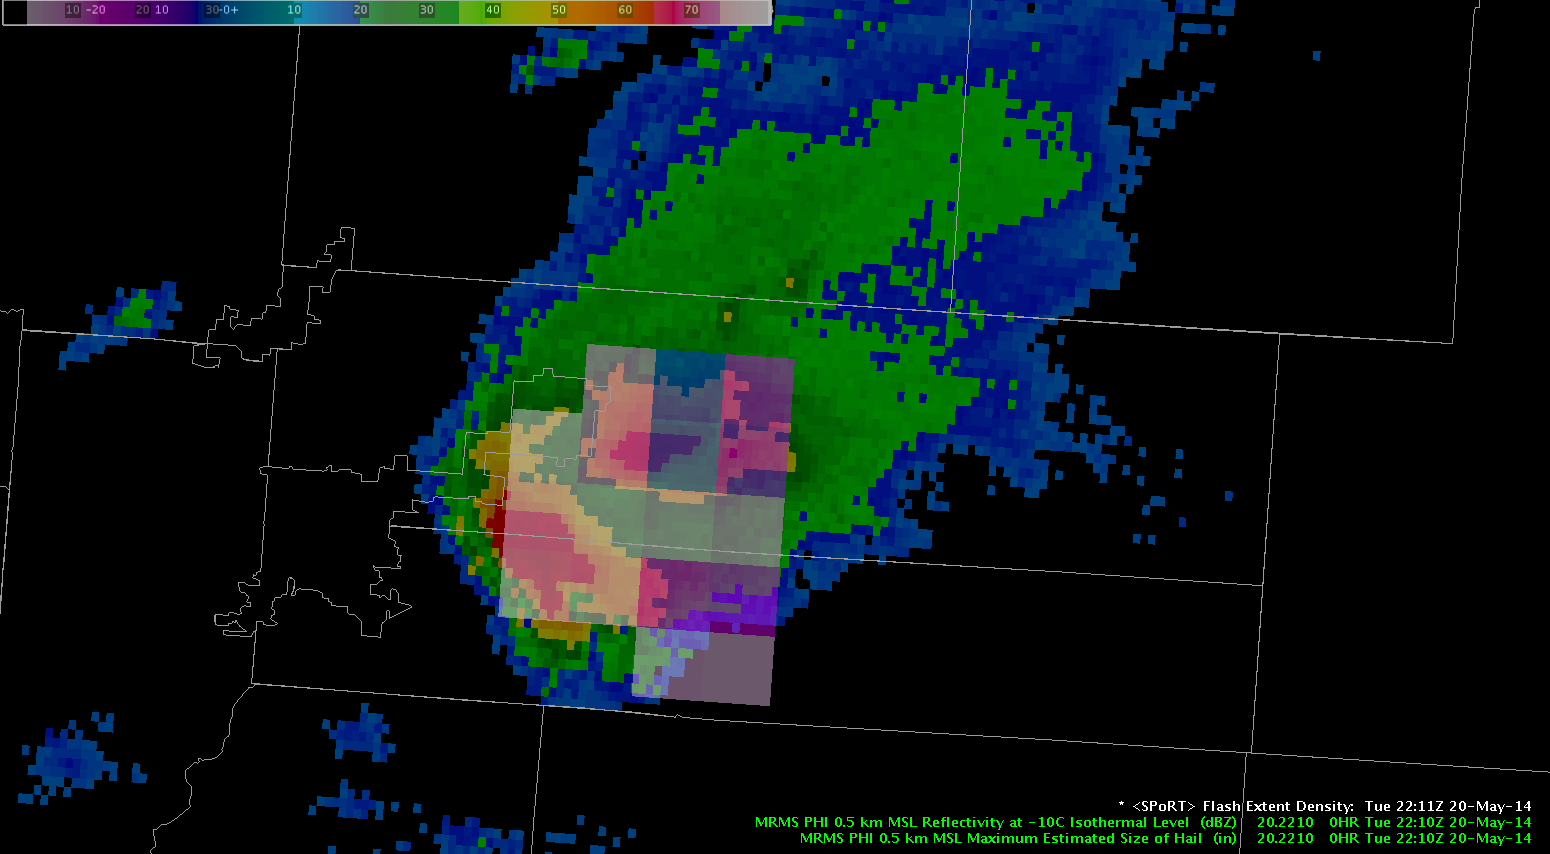
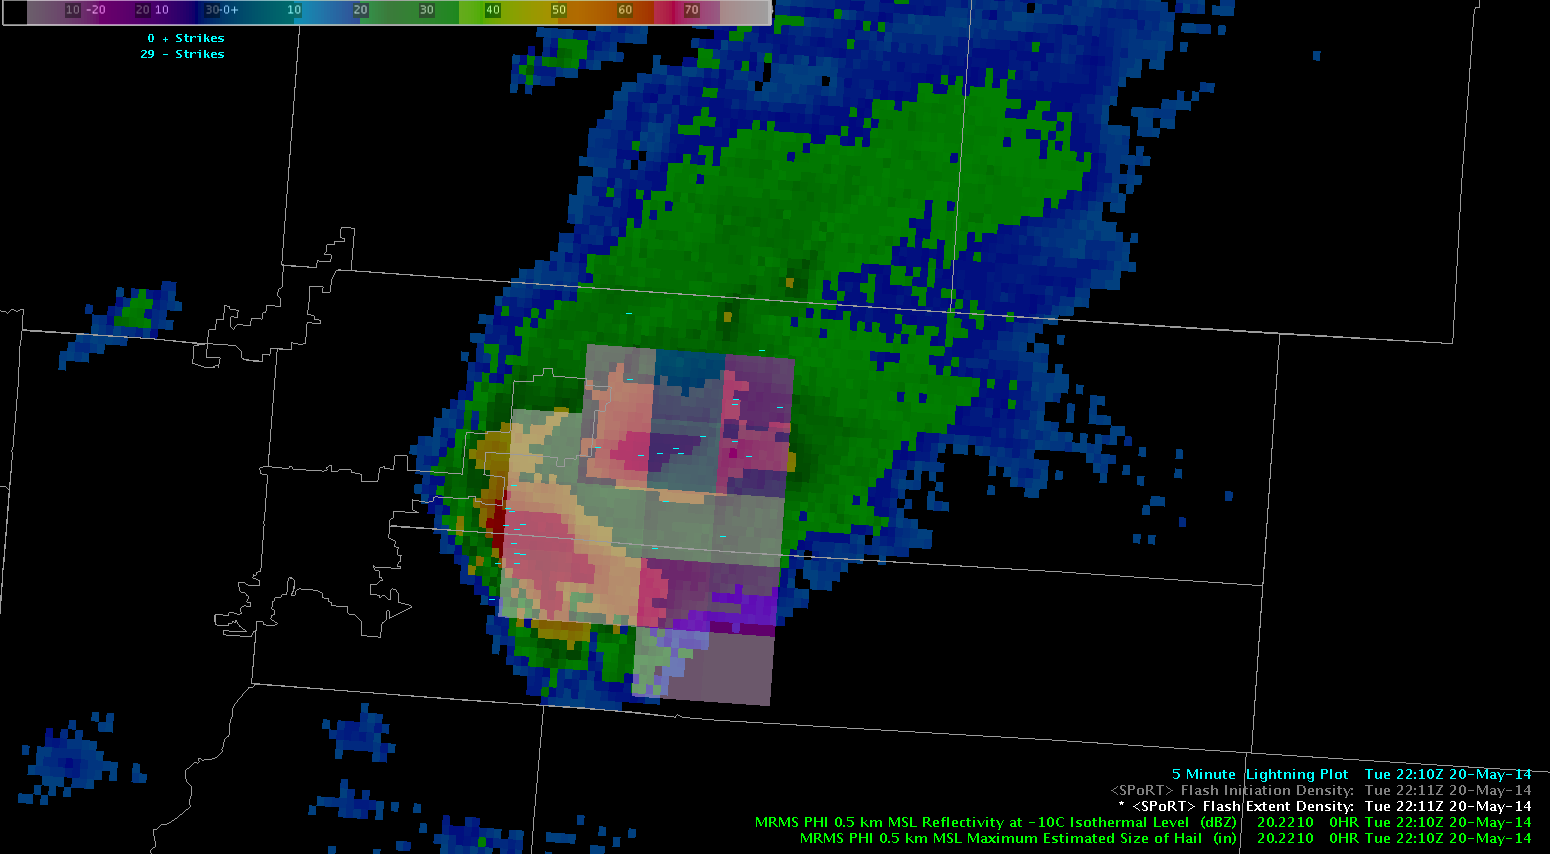
Comparing the prob. severe outline with the storm in question, dual-pol showed KDP values that were blacked out (with surrounding pixels well above 1), CC values below 1 (~.8 to .9), and a small but still evident three-body scatter spike. DVN received a report on this storm just two minutes later that was close to severe criteria:

LSRDVN

PRELIMINARY LOCAL STORM REPORT
NATIONAL WEATHER SERVICE QUAD CITIES IA IL
445 PM CDT TUE MAY 20 2014

..TIME...   ...EVENT...      ...CITY LOCATION...     ...LAT.LON...
..DATE...   ....MAG....      ..COUNTY LOCATION..ST.. ...SOURCE....
            ..REMARKS..

0440 PM     HAIL             2 W DUBUQUE REGIONAL AI 42.40N 90.75W
05/20/2014  M0.88 INCH       DUBUQUE            IA   EMERGENCY MNGR

            PEA TO NICKEL SIZE HAIL REPORTED ON HIGHWAY 151.

&&

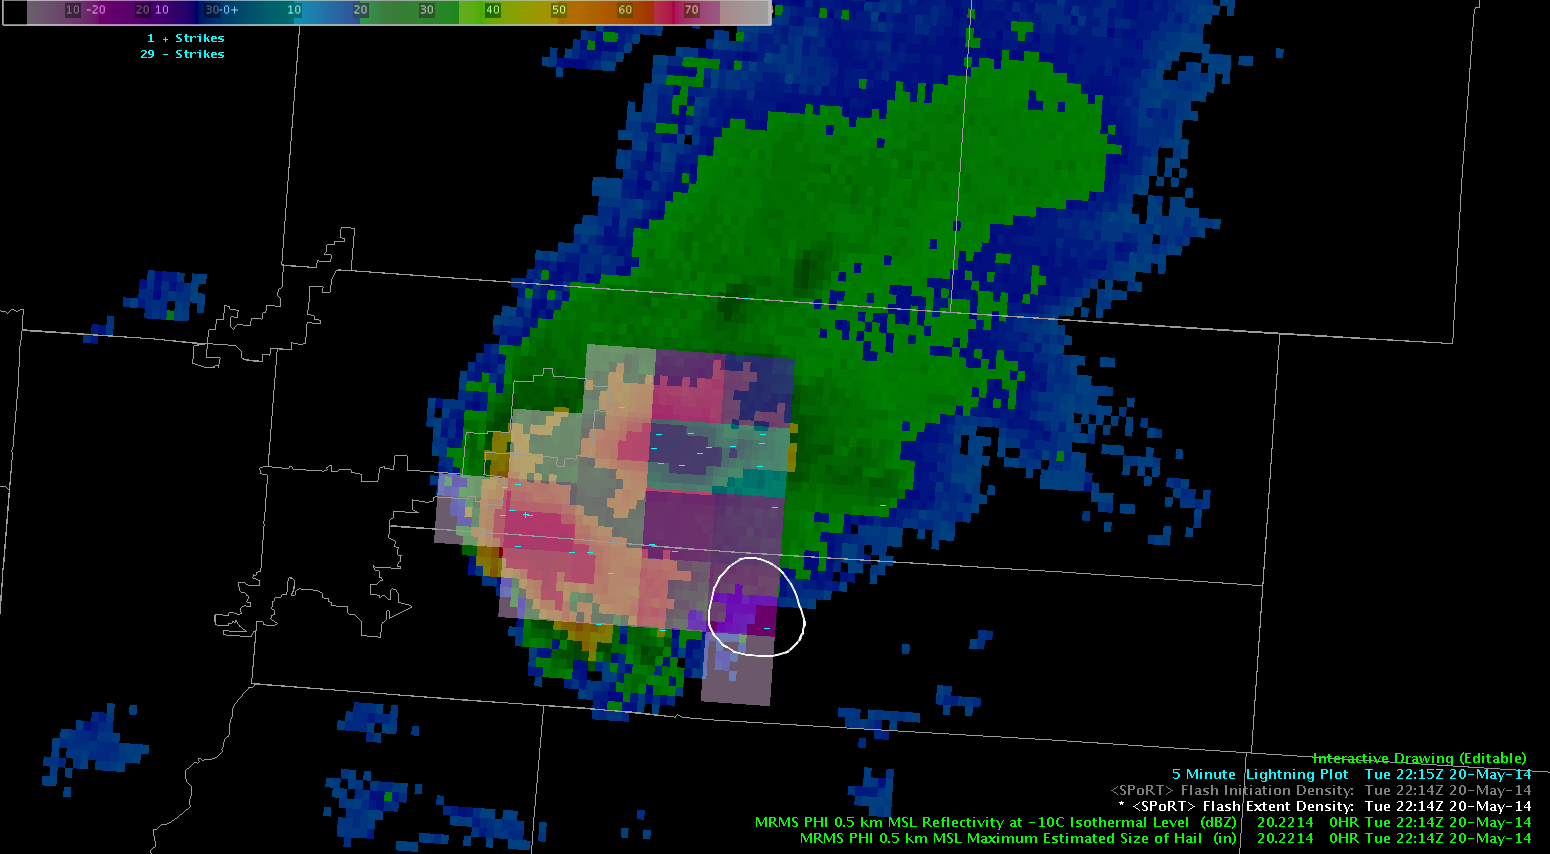
Ten minutes later, another report of hail over severe criteria was issued from DVN, verifying my partner’s warning, the prob. severe model, and what was seen in radar trends:

LSRDVN

PRELIMINARY LOCAL STORM REPORT
NATIONAL WEATHER SERVICE QUAD CITIES IA IL
457 PM CDT TUE MAY 20 2014

..TIME...   ...EVENT...      ...CITY LOCATION...     ...LAT.LON...
..DATE...   ....MAG....      ..COUNTY LOCATION..ST.. ...SOURCE....
            ..REMARKS..

0450 PM     HAIL             1 E DUBUQUE REGIONAL AI 42.40N 90.70W
05/20/2014  M1.50 INCH       DUBUQUE            IA   EMERGENCY MNGR

&&

Overall and so far, this tool is a great resource and would be good to have in the toolbox.

~Linda

Tags: None

Using Probability of Severe to help issue Warnings

mrms with prob severe warnings

It has been a very active day with storms over our warning area.  The Prob. of Severe tool really helped me focus in on the storms that were more intense and then I was able to use Dual-Pol info to help verify and issue the warnings.  I was able to observe that the Prob of Severe as it followed the strengthening and thus weakening of the individual storms.  As you can see from above…when they turned the hot pink color..is normally when I was issuing the warning and actually allowed the warnings to expire when they started to drop down to the gray color.  This also verified with storm spotter data so I find this tool very useful and I really like it. ~Vollmar

Tags: None

Variability in CI

ci_varability_20_2045

It is interesting to note the variability along the CU field from east-central IA into northern IL. This CU field developed into TSRA the next satellite scan in the regions all along the line. The variability in CI ranged from 27 to 70 percent.

-JB

Tags: None

Nearcast storm feed.

May20th 2259Z

With this post I just wanted to showcase off the Nearcast model’s difference in Theta-E layers as a large area of instability is feeding directly into the lonely storm over Denver. With no slowdown of the instability feeding this storm, it will probably continue into the late early evening hours.

Grant H.


Tags: None

Flash Extent Density and Storm Structure

flash_extent_vsMinus10

Overlaid here is Flash Extent Density (FED; shaded pink and blue boxes) and Reflectivity at -10C at 22:11 UTC.  The lightning information is highlighting where active charge separation is ongoing within the storm, and lightning is occurring. Notice how the FED extends outside of the reflectivity cores within the two storms, highlighting how lightning propagation can and does occur outside where it is actively raining, posing a threat to those caught outside.

FEDvsrefwnldn

NLDN information has been added to the image above from the same time at 22:11 UTC.  The NLDN is represented my the minus signs within the image.  Note the difference in spatial information of lightning that the PGLM provides over traditionally used NLDN cloud to ground points.

Four minutes later at 22:15 UTC, the NLDN reported a lightning strike that occurs outside of the precipitation of the storm (white circle, below).  circle_2214


vLAPS Underdoing CIN

laps_cin_20_2045

Using the vLAPS and looking at the frontal boundary from eastern NEb to the southwest into south central NEb and into northwest KS the model indicates that there is no convective inhibition remaining in the scalped area. Comparison of this to the SPC mesoanalysis indicates that CIN remains in this area, especially in southern NEb and northwest KS where no convection is occurring.

-JB

Tags: None

MRMS units shown (m vs ft)

Screenshot-Merged Reflectivity

Quick Note: When looking at reflectivity of different heights, the typical unit for a meteorologist on radar operation is in ft not meters (m) as this is typical of most radar readouts.  It might be an idea to convert this to ft for faster use at catching the wanted level that is noticed in the base products.

Grant H.

Tags: None