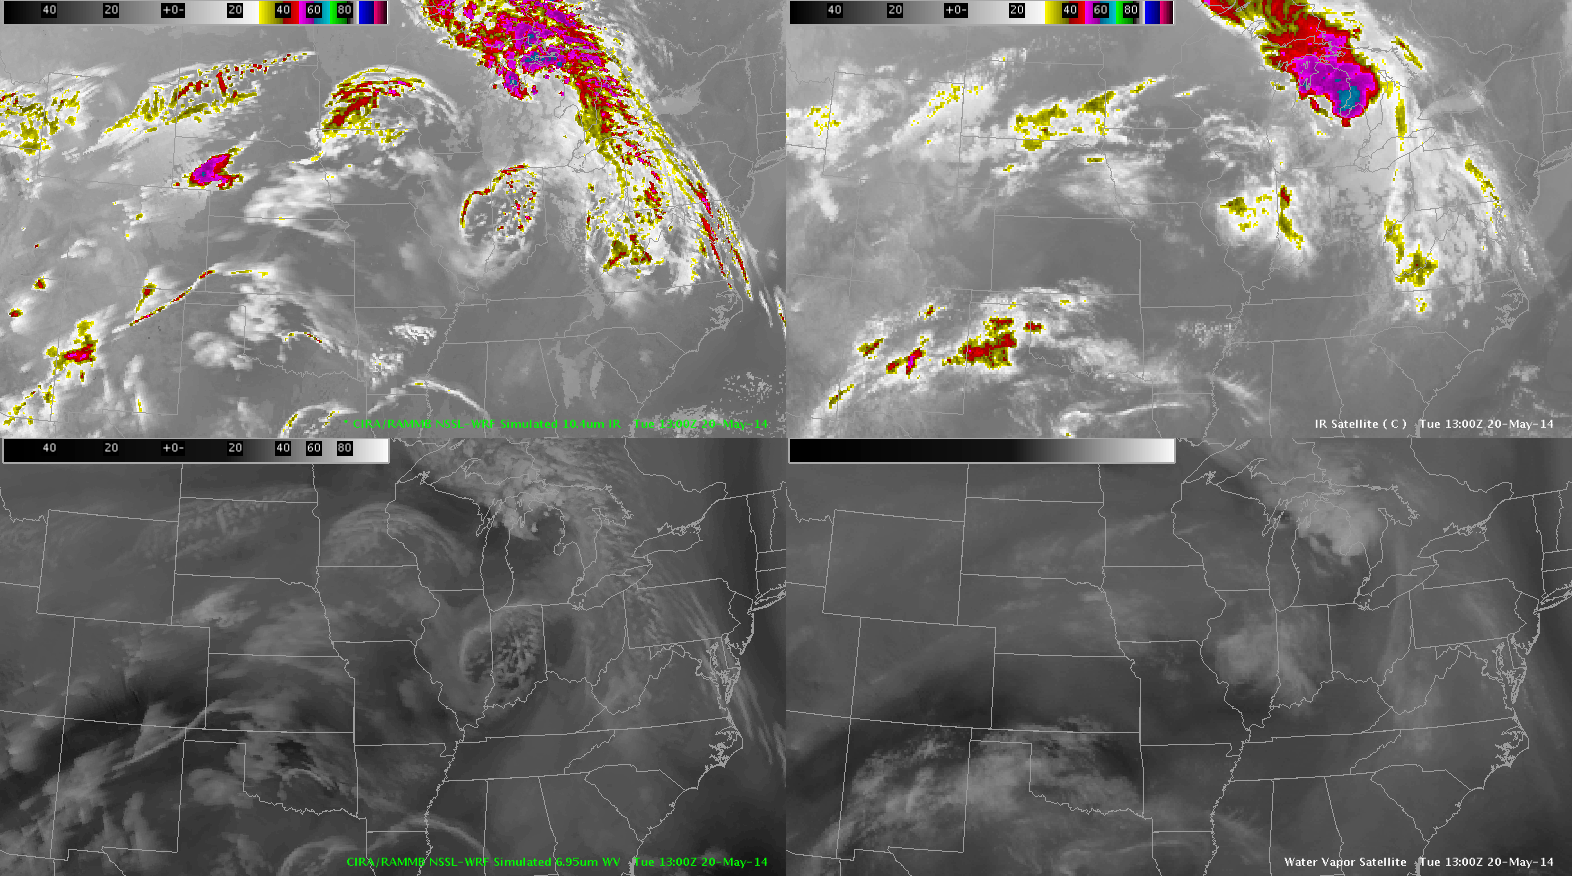
Analysis of the simulated water vapor imagery compared to the actual water vapor imagery at 13Z indicated the simulated model had a good handle on the speed max that was located over western KS at 12Z. Although the simulated water vapor/IR was to agressive on TSRAs over western NEb at 13Z this leads to confidence in the position of the speed max later in the day on the simulated water vapor.
-JB