An official website of the United States government
Here’s how you know
Official websites use .gov A
.gov website belongs to an official government
organization in the United States.
Secure .gov websites use HTTPS A
lock (
) or https:// means you’ve safely connected to
the .gov website. Share sensitive information only on official,
secure websites.
I like the 15 min forecast time steps of the LAPS_OUN_1km data. The most noticeable feature is a secondary sfc CAPE maximum about 2 counties out ahead of the current line of convection. The LAPS fcst maximum base reflectivity continues to try and develop a secondary line of potentially severe convection 50 to 60 miles out ahead of the current line of convection over east TX. May want to watch satellite for cloud cooling trends and possible initiation of new severe convection out ahead of the current line of storms over east TX. These new cells would be forming in a very volatile environment and thus will quickly become severe assuming they form as LAPS data has been trying to indicate. Thus far this new convection out ahead of the line has not been forming, but should be monitored as the LAPS is persistent in trying to develop this convection.
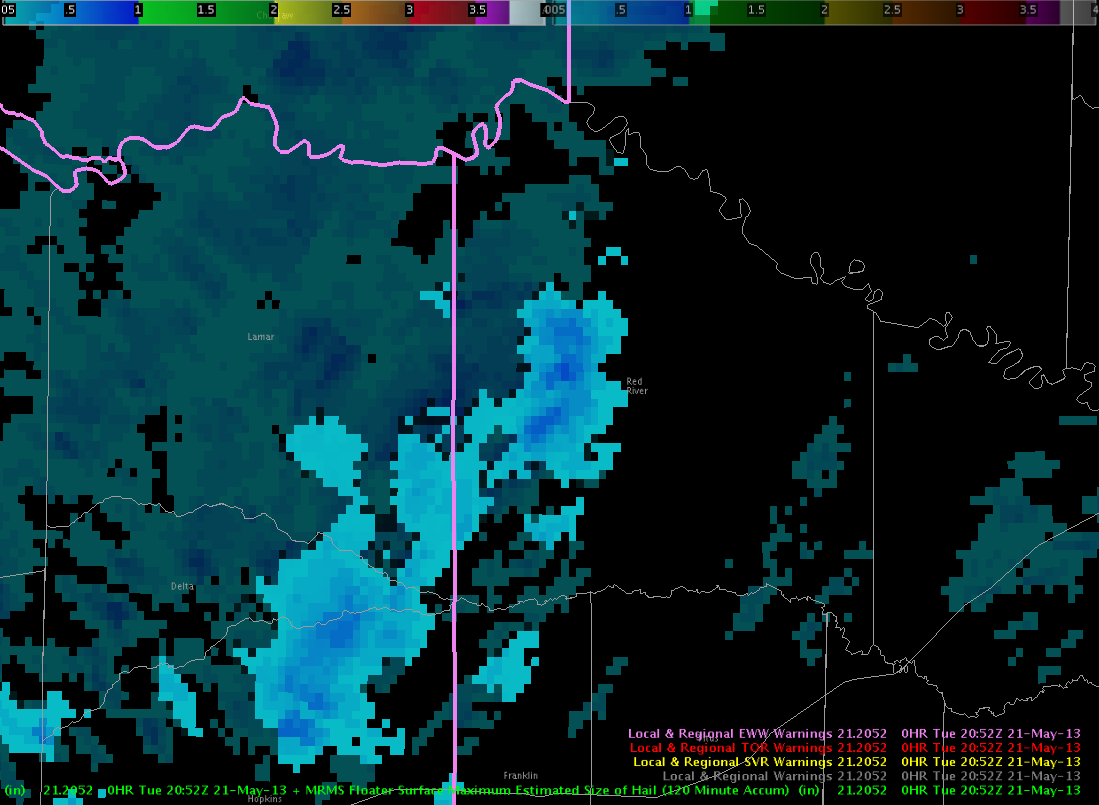
A report of penny size hail was received at 2051 UTC in the NW portion of the SHV area in Red River Co. TX. At this time the HSDA off the SHV radar showed hail within the line with scattered pixels of large hail. MESH showed at max of 0.63in.
Tried to manually loop a 4 panel image of CI/CTC/Radar/Vis and with a 40 plus frame count it was too slow to be useful. It took over 20 seconds for all parameters to load. However, at a frame count of 12 it was much faster and of more use for following trends.
Moderate Risk again for portions of SE OK, AR, NE TX, and NW LA. Convection will be ongoing in the late morning, and is expected to continue well into the late evening and overnight hours. With better CI opportunities to occur later this week, and to allow for some time in the morning for damage survey activities in Moore, we are opting to capture the later portion of this event.
Likely CWAs: Shreveport, Fort Worth, Little Rock, Tulsa, Norman
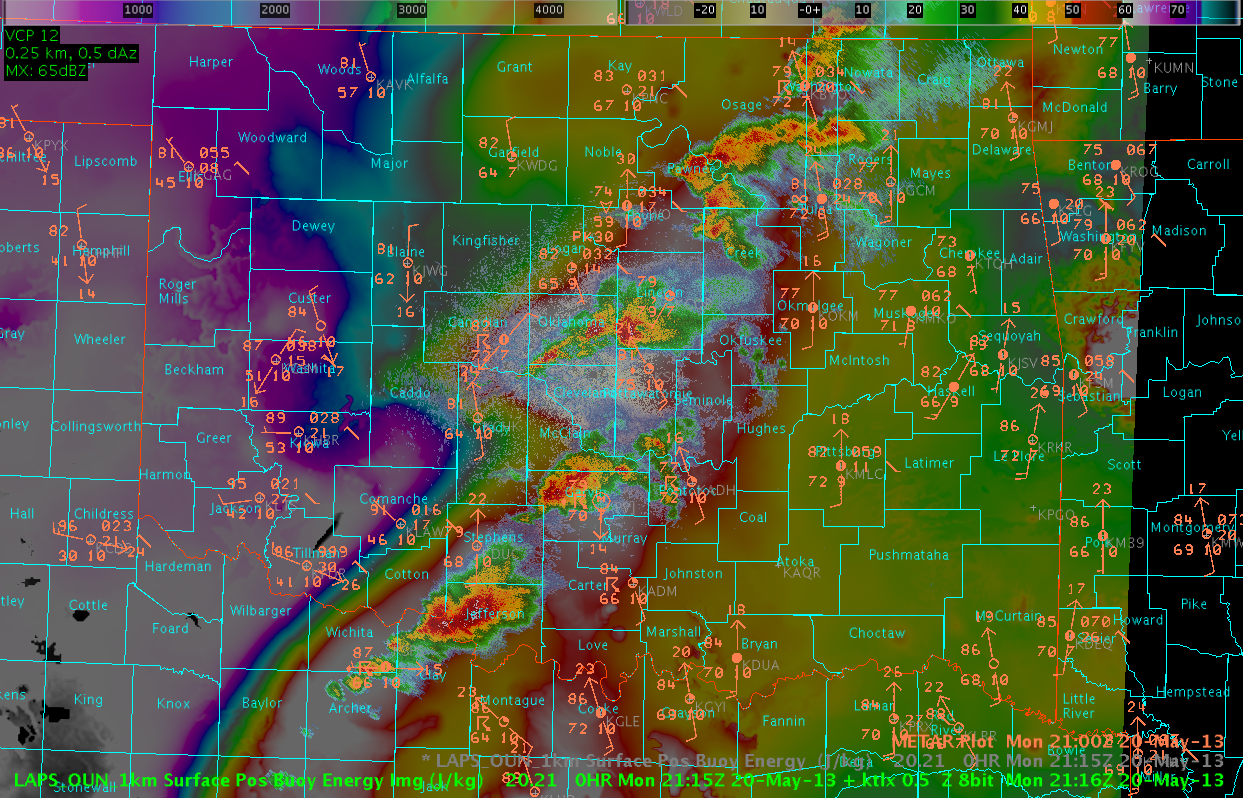
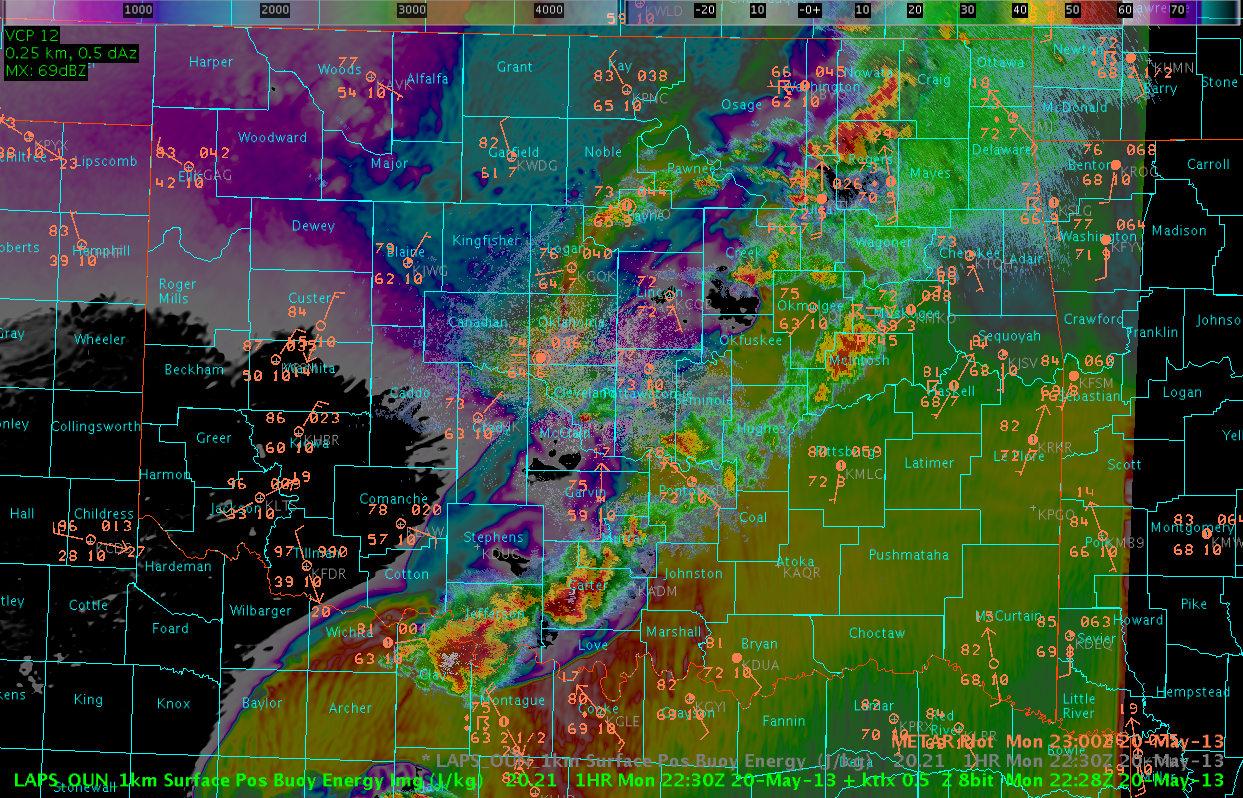
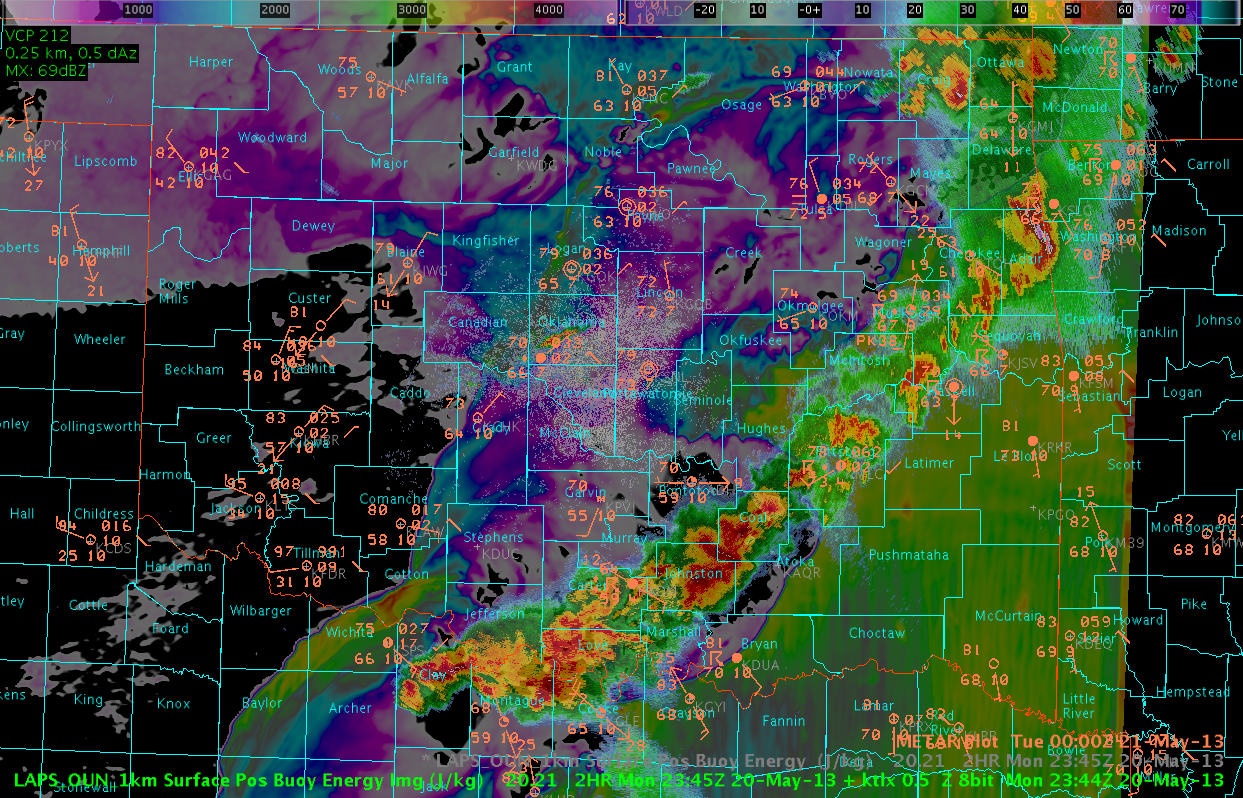
The following imagery are taken from the 21 UTC forecast run of the 1 km LAPS model and are overlaid with KTLX 0.5 reflectivity imagery. At the first image below, valid at 21 UTC, or the model initialization time, you can see the ribbon of high CAPE values, exceeding 4-5000 J/KG is some areas, stretching from SW-NE across portions of north Texas and central Oklahoma. The radar imagery initially are valid at 2116 UTC. Notice the large supercell over the Red River in Clay and Jefferson Counties. The LAPS CAPE values can serve as a proxy of sorts for the resulting reduction of CAPE in association with the outflow from this storm. In subsequent imagery, the outlow (or relatively low CAPE field) can be seen to migrate quickly northward. In image 2, the wind at KPJV is observed to shift from the south, as the outflow boundary crossed the area. The timing matched the LAPS forecast values quite well. Later, in images 3 and 4, as the outflow boundary intersected an area of higher CAPE in the OK City metro, a small storm suddenly develops. The timing of the propagating outflow boundary was handled very well by the LAPS model in this particular case.
Image 1. LAPS CAPE values (K) at 2115 UTC, overlaid with KLTX 0.5 degree reflectivity. Observations included.Image 2. LAPS CAPE values (K) at 2300 UTC, overlaid with KLTX 0.5 degree reflectivity. Observations included.Image 3. LAPS CAPE values (K) at 2345 UTC, overlaid with KLTX 0.5 degree reflectivity. Observations included. Notice the small cell that has developed over the OKC metro.Image 4. LAPS CAPE values (K) at 0000 UTC, overlaid with KLTX 0.5 degree reflectivity. Observations included.
Too bad we couldn’t show a loop of the imagery, because the LAPS’ handling of the outflow from the convection was rather stunning.
We issued a severe thunderstorm warning for northern Palo Pinto County and close areas after noting an increase in vertically integrated ice and both POSH and MESH in a small column along the county border. We didn’t see a lot of reflectivity above -20 C but felt the storm detail favored 1 inch hail.
After developing off an old outflow boundary and near the triple point with the dryline, the storm encountered more stable air across northern OKC Metro. Once this happened, the storm rapidly dissipated the storm rapidly per LAPS near time data and Theta-E trends in the near storm environment.
Flash Rates have stayed steady or fallen across Johnstone/Coal counties in southern OK, but a have increased rapidly with a new some developing across northern OKC area.
This is likely the arriving of a second, strong shortwave disturbance arriving over the top of the cold front draped across central OK.
Just a quick post about observations of the LAPS theta-e field this afternoon. It was interesting to see the near stationary aspect of the theta-e boundary in assoc/w the dryline to our south across portions of north Texas this afternoon. This suggests that continued development is possible late this afternoon especially across northern Texas, where the gradients have been sustained and have even increased lately. However, notice that the gradients have decreased generally across much of Oklahoma where convection and related effects (rain cooled air, cloud shield) have helped to stabilize the environment.
Image 1. LAPS 2115 UTC analysis. Shaded values are sfc theta-e (K), while wind vectors are in blue.Image 1. LAPS 2130 UTC analysis. Shaded values are sfc theta-e (K), while wind vectors are in blue.
Image 1. LAPS 2145 UTC analysis. Shaded values are sfc theta-e (K), while wind vectors are in blue.Image 1. LAPS 2200 UTC analysis. Shaded values are sfc theta-e (K), while wind vectors are in blue.Image 1. LAPS 2215 UTC analysis. Shaded values are sfc theta-e (K), while wind vectors are in blue.
The 15-minute temporal resolution of the product can be very useful for diagnosing locations of continued convection especially in rapidly developing convective situations.


 I like the 15 min forecast time steps of the LAPS_OUN_1km data. The most noticeable feature is a secondary sfc CAPE maximum about 2 counties out ahead of the current line of convection. The LAPS fcst maximum base reflectivity continues to try and develop a secondary line of potentially severe convection 50 to 60 miles out ahead of the current line of convection over east TX. May want to watch satellite for cloud cooling trends and possible initiation of new severe convection out ahead of the current line of storms over east TX. These new cells would be forming in a very volatile environment and thus will quickly become severe assuming they form as LAPS data has been trying to indicate. Thus far this new convection out ahead of the line has not been forming, but should be monitored as the LAPS is persistent in trying to develop this convection.