

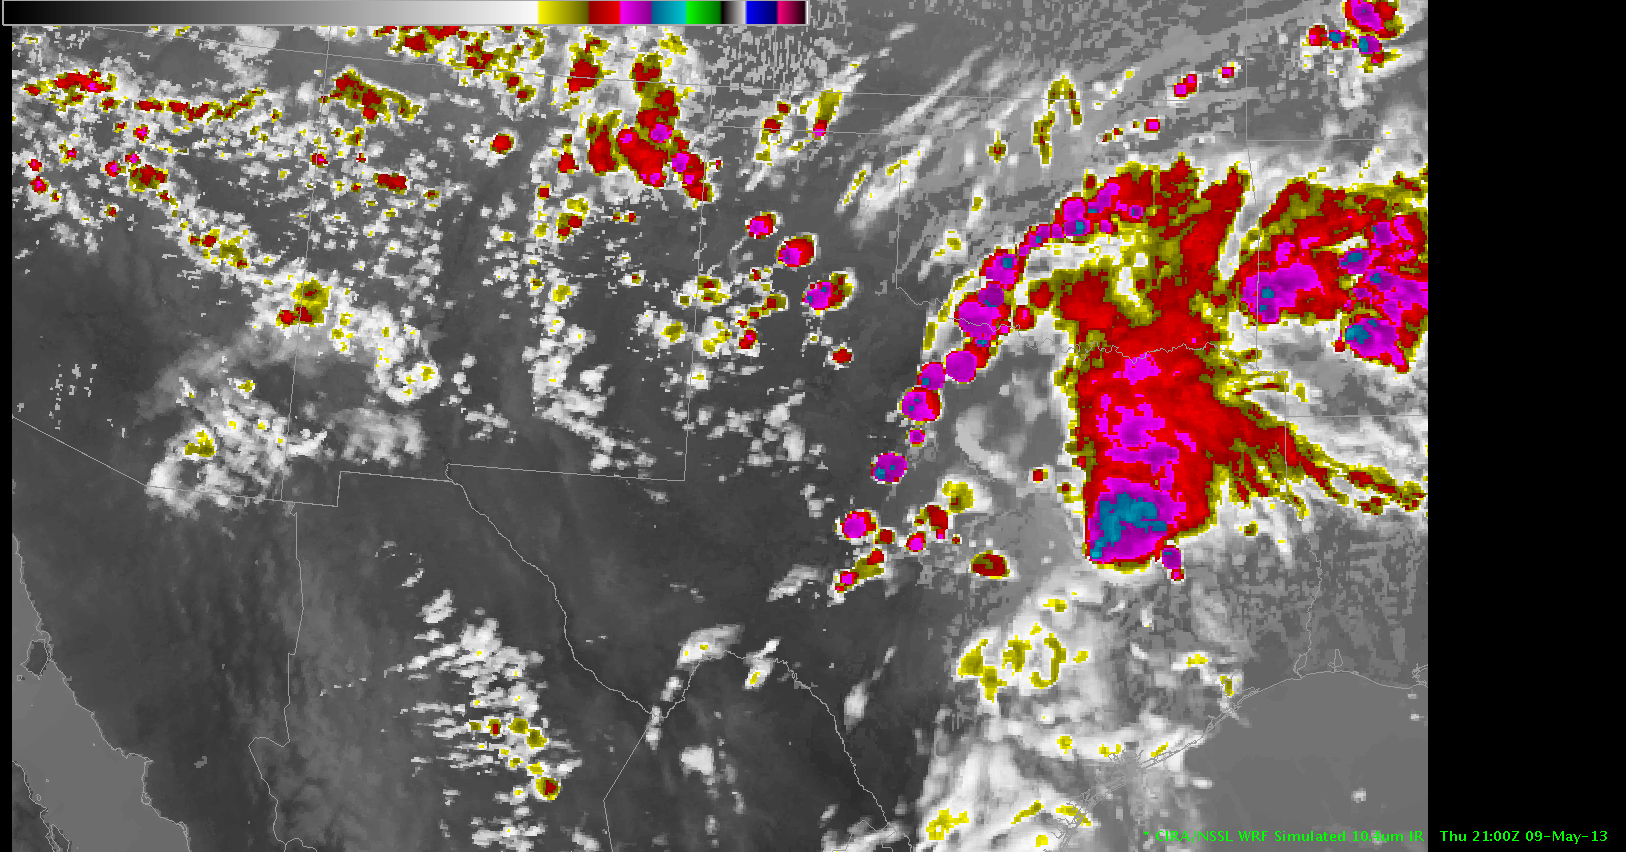
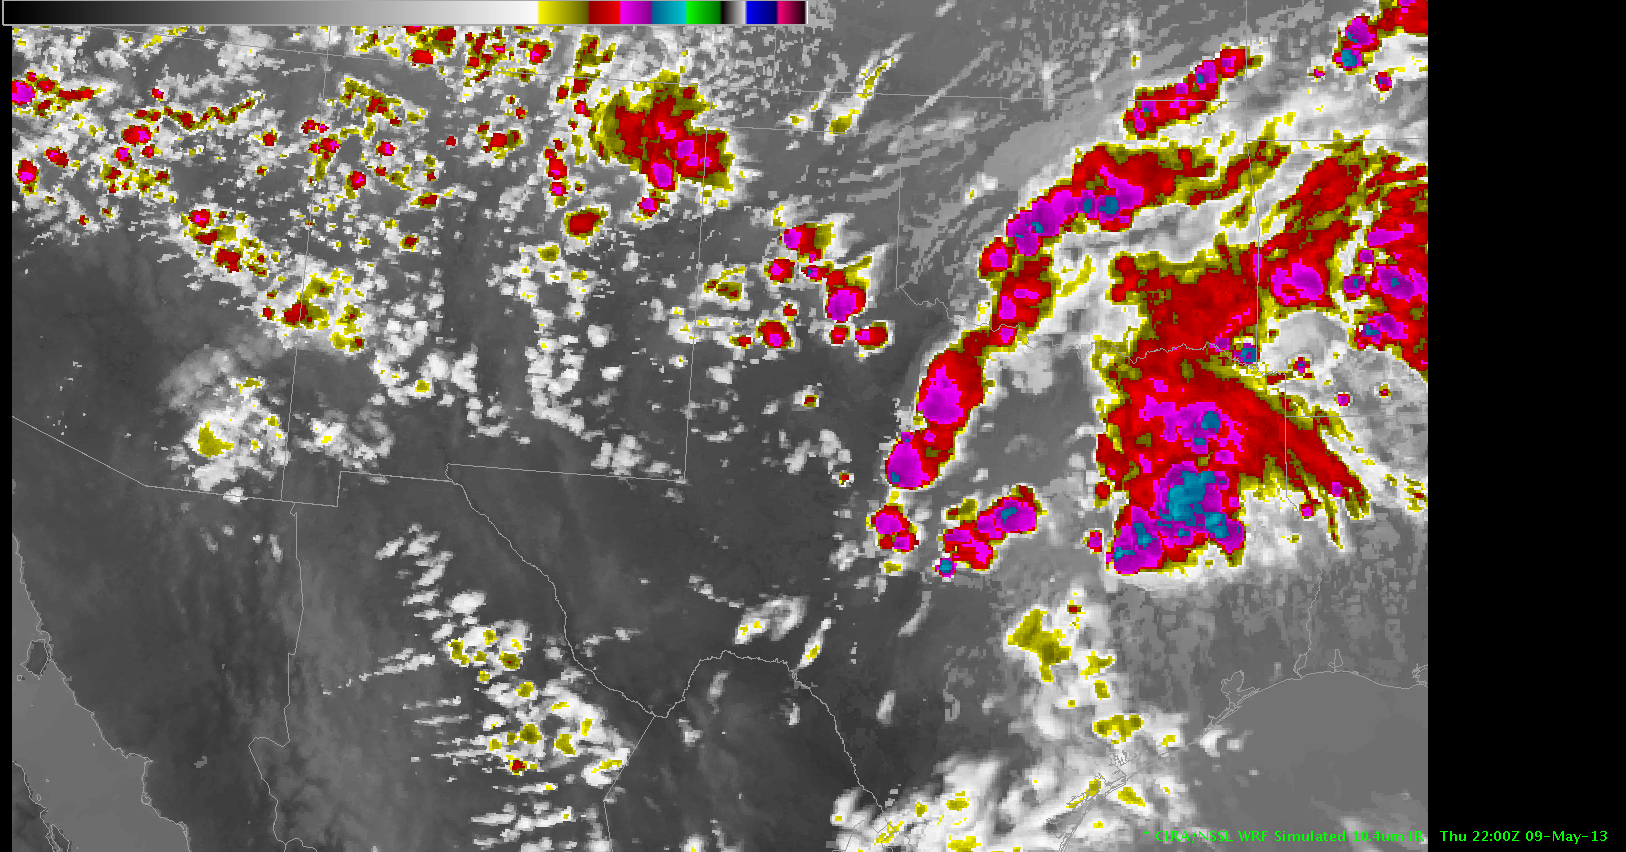
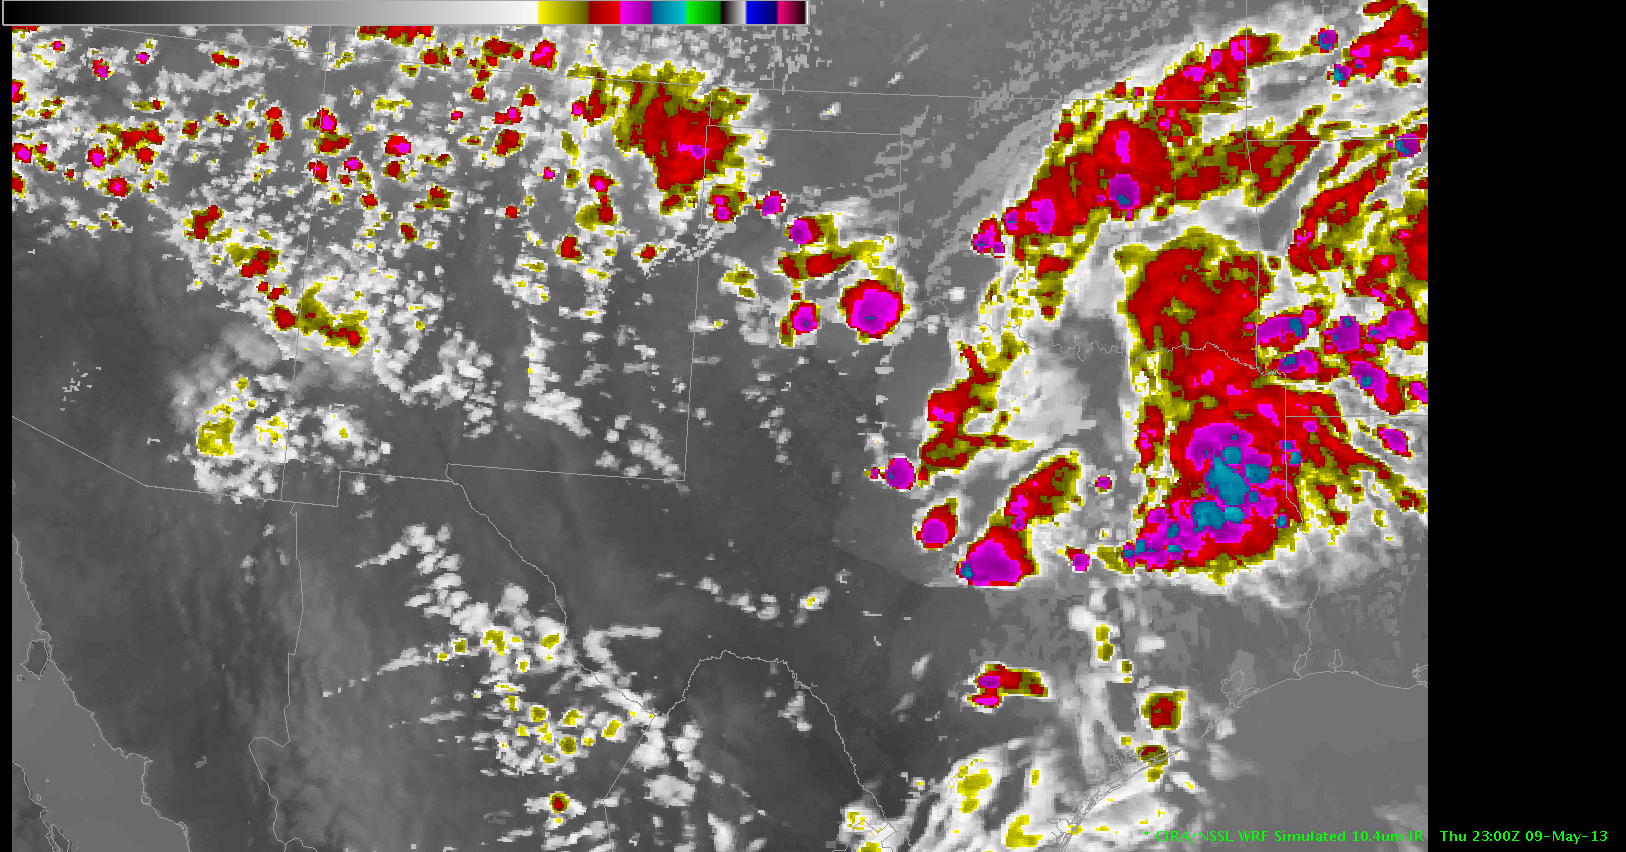
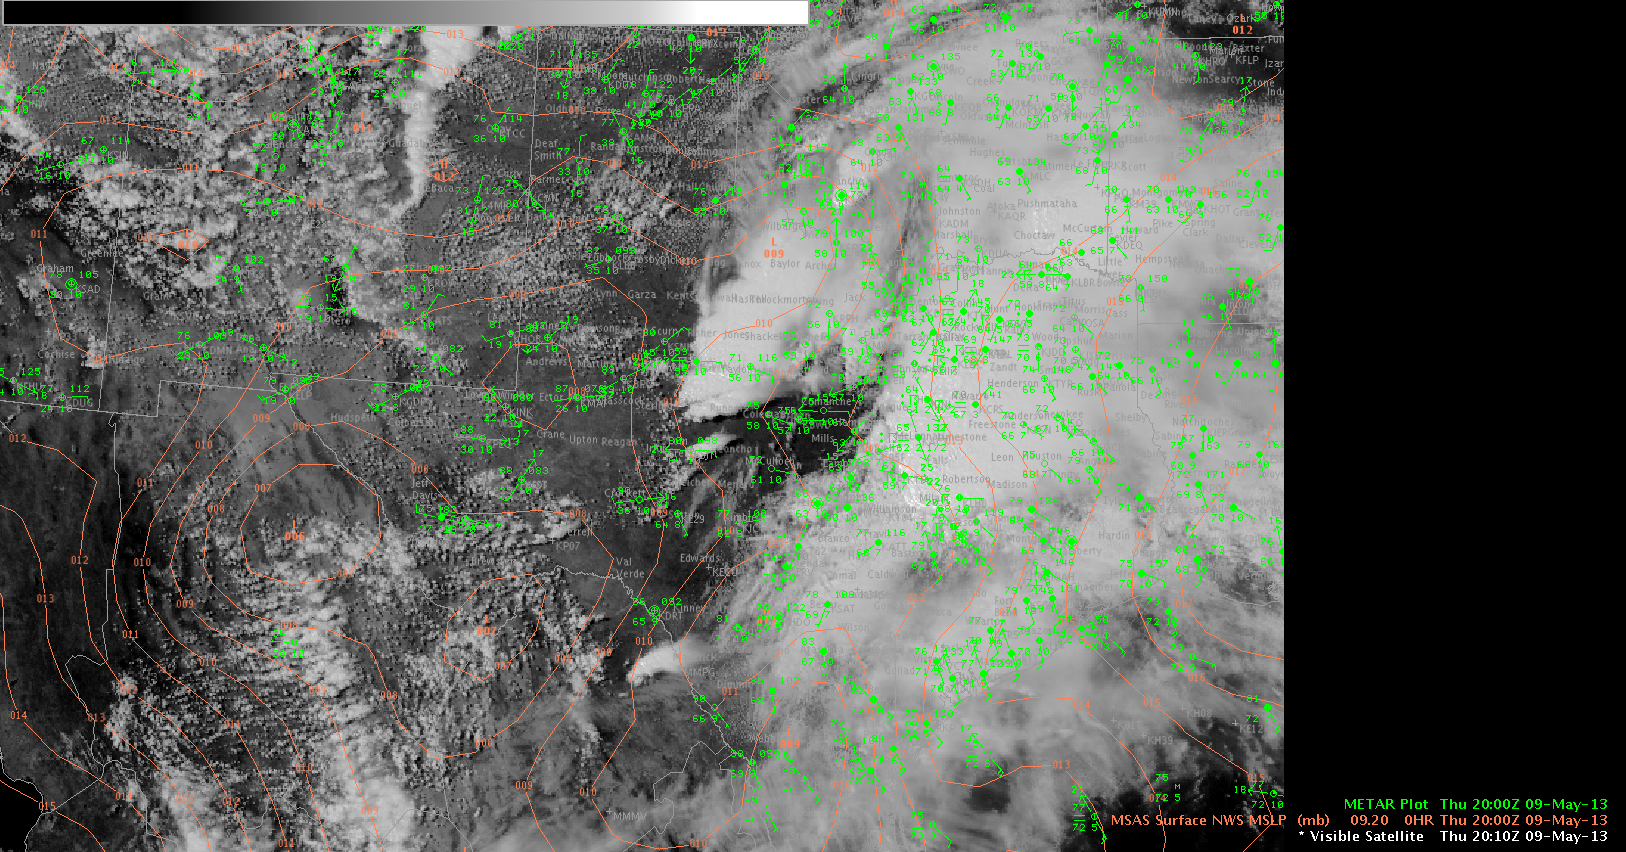
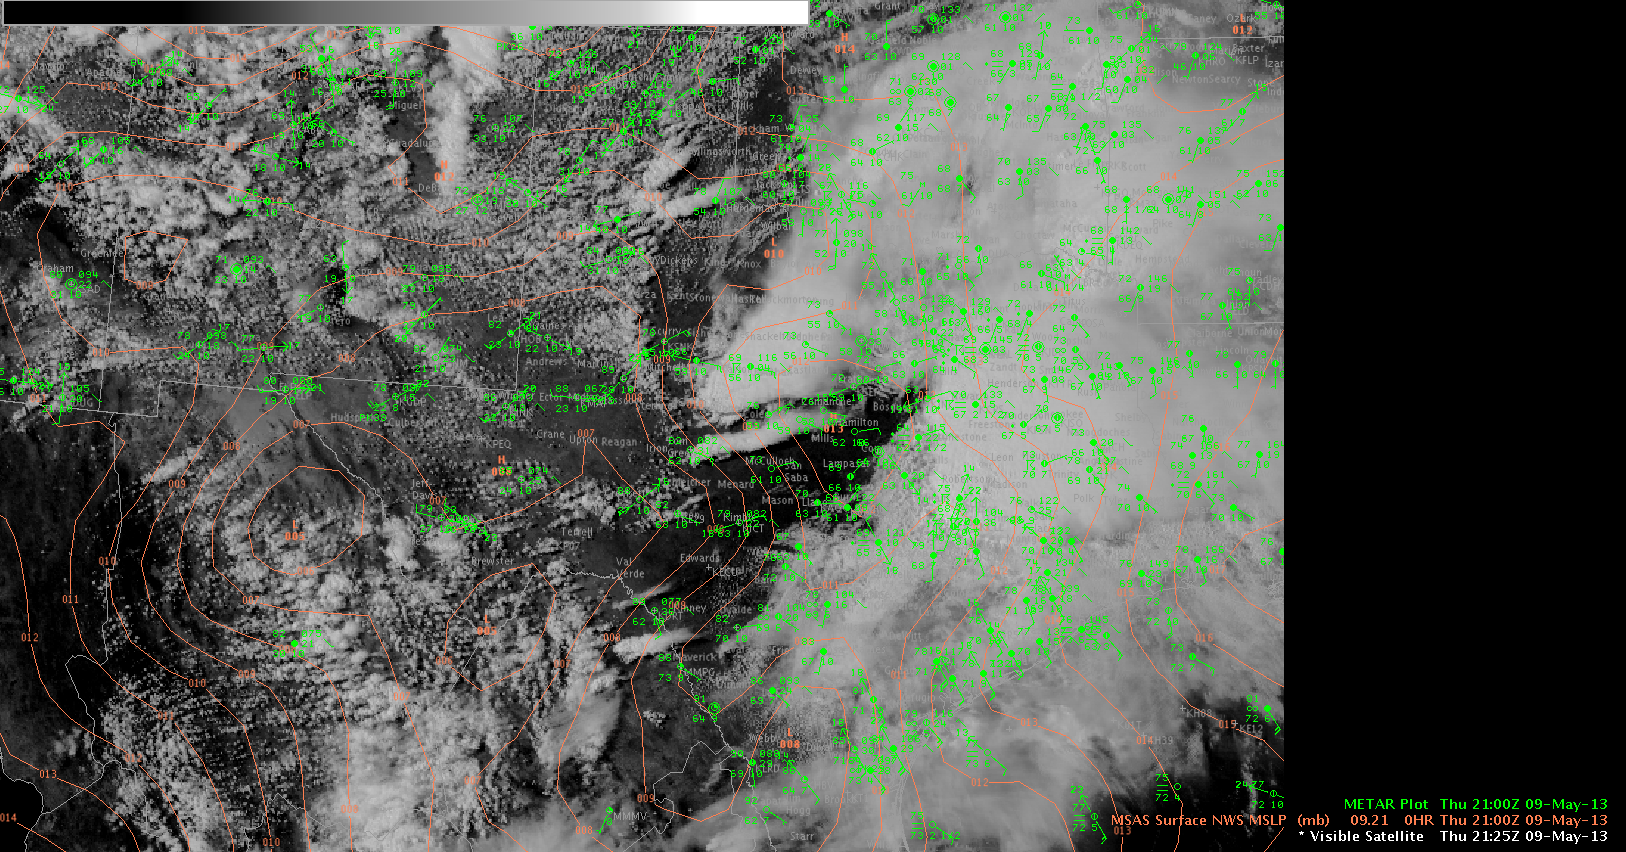
NSSL WRF simulated satellite imagery accurately depicted convection erupting across West Texas as an outflow boundary from a previous MCS across north-central Texas interacted with the dryline. The three following images show a westward propagating outflow boundary interacting with isolated cells along the dryline across portions of West Texas.
The UAH CI and UW-CTC products were also very persistent in developing convection across the extreme southern Texas panhandle and adjacent portions of West Texas.
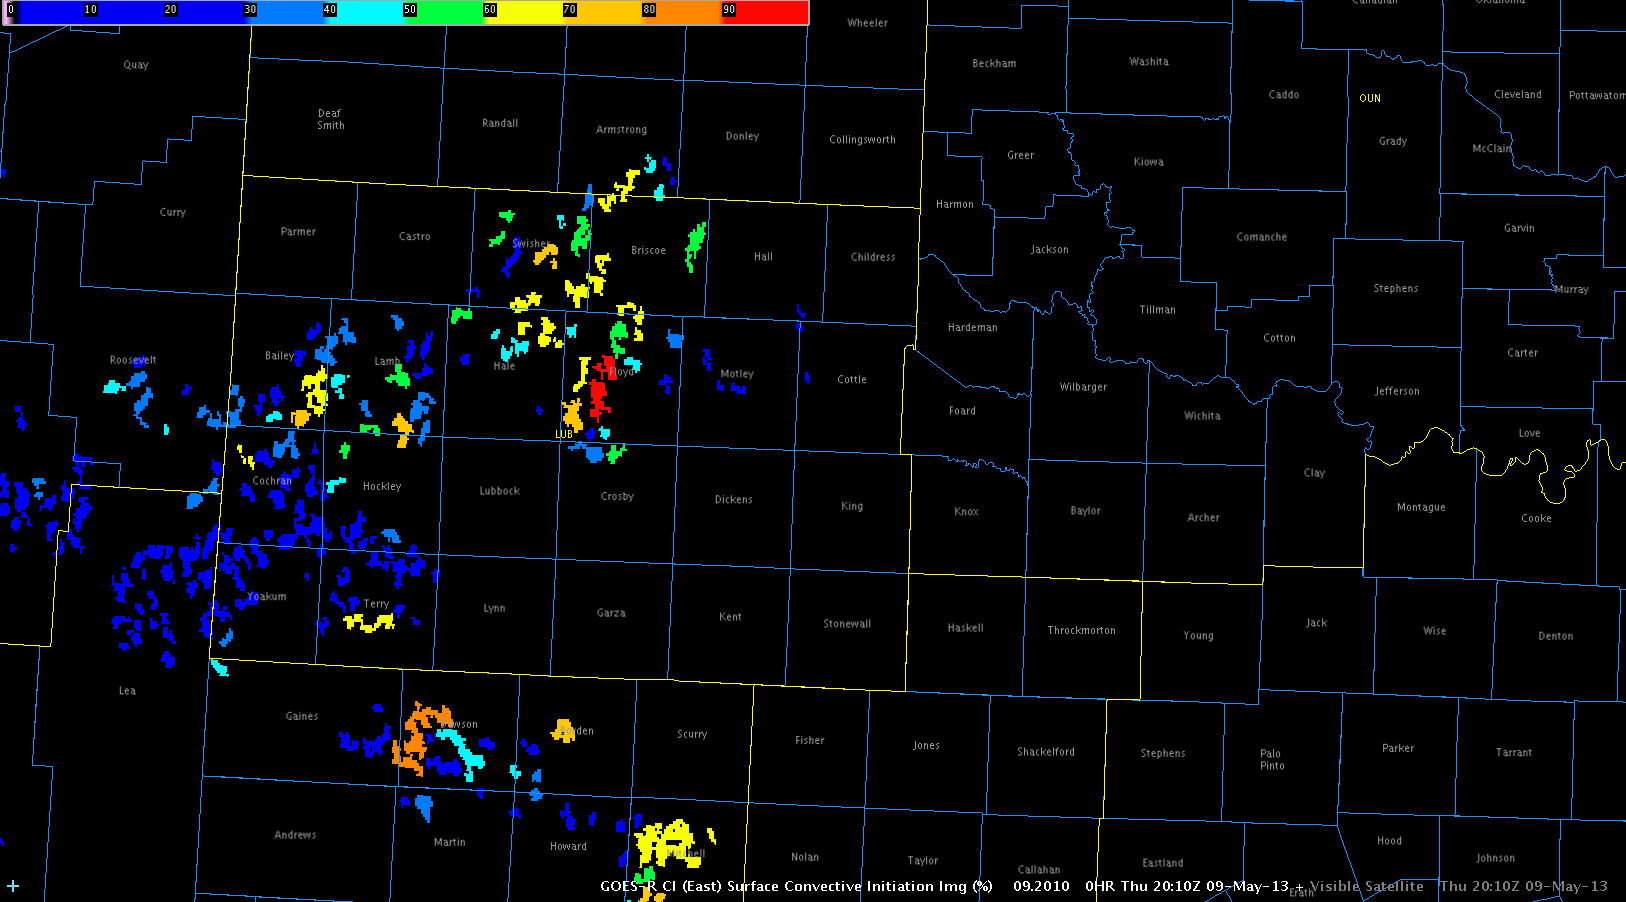
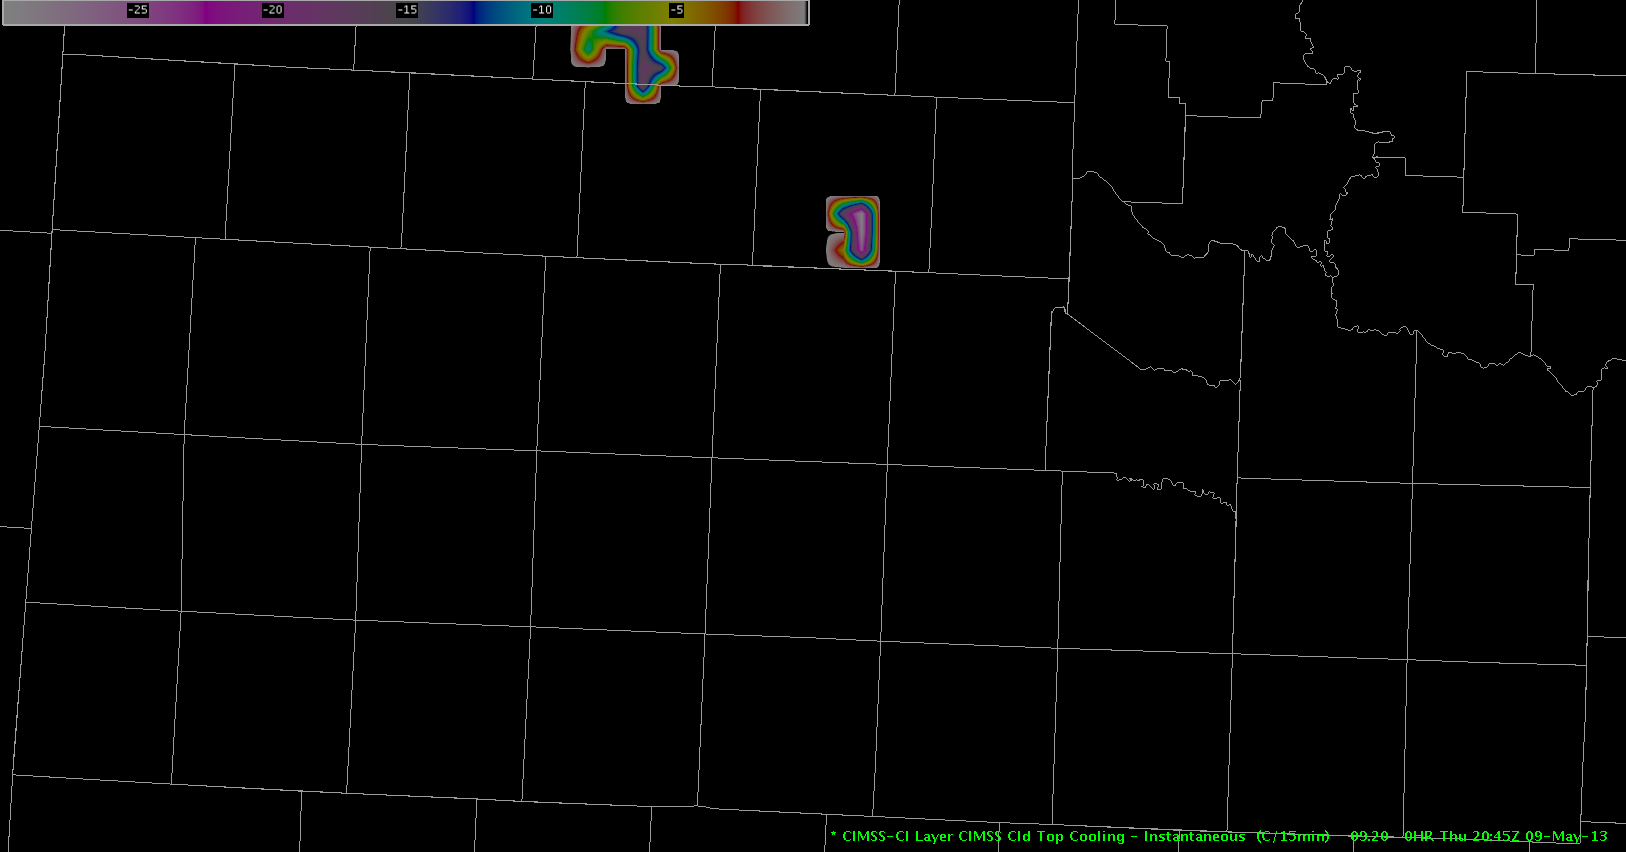
Satellite imagery verified convective development across West Texas. While impossible to forecast the exact location of initiation, the general area was well represented with lead times of up to around half an hour. Convection can be seen beginning near 2010Z and lasting well into the afternoon hours.
Guseman