LightningCast Good For A DSS Heads Up…Dashboard Needs Some Work

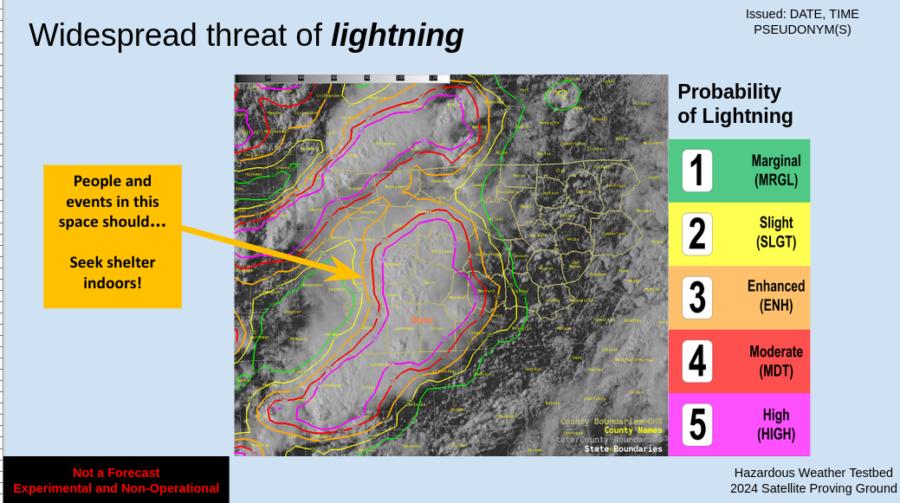
Storms off the the west in New Mexico approaching our DSS location in far NW Texas were a great way to test the LightningCast and the associated LightningCast Dashboard. Our DSS location was focused on the “Rita Fire” that was along Hwy 385 between Dalhart, TX and Boise City, OK and partners wanted notice of a 50% probability of lightning within one hour within a 25 nm radius around the fire. Convection was ongoing across NE New Mexico one storm showing deviant motion. This storm was warned on at 2043Z for 1.5″ hail and winds of 60 mph based primarily on radar; however, Octane was being used to monitor the storm as it tracked southeastwards towards the CWA boundary. Octane showed consistent divergent signatures in the direction product and good speed decreases on the upshear side of the updraft before being contaminated by an anvil from another storm to the southwest.


    As the supercell dropped southward from NE New Mexico, the LightningCast product probabilities started to increase into the Rita Fire range ring. It was noticed that the LightningCast Dashboard remained at around 10% despite 75% probabilities along the range ring boundary indicating that the dashboard is focused on a point. This is fine if you are only concerned about one point, but most outdoor events need time to evacuate people or move equipment from the location.


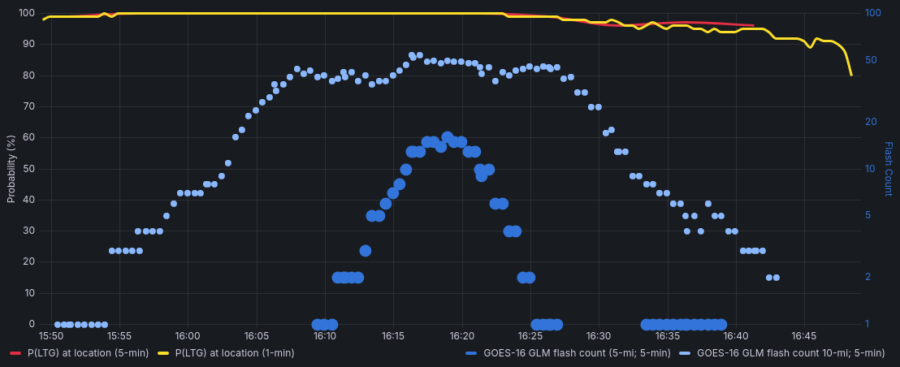
While it was nice that the LightningCast Dashboard allows you to choose different time ranges and an auto refresh rate per a drop-down, I think some other options might be more helpful for support of an event. To help provide a head’s up to partners, it would be valuable to have an option to input a specified area that you would like to be alerted for…with the option of inputting those criteria. For example, being able to have a range ring or being able to draw a polygon for the area of interest and then inputting lightning criteria in there to alert you when those values are reached within your range ring or polygon. The criteria provided for the Rita Fire of 50% probability within the range ring would have alerted us on the Dashboard that the threshold had been reached. As far as the LightningCast product overall…it was an excellent resource for monitoring then alerting the Rita Fire partners once their criteria had been reached. A quick screen grab can be sent to partners as well to indicate where the greatest lightning threat probabilities are located.


– Vera Mae

The Machine Learning Foretold the Future

While monitoring convective initiation in a sea of Altocumulus castellanus clouds as they moved into a more convectively unstable environment, I noticed that the GREMLIN Emulated reflectivity in Briscoe County was higher than the MRMS (GIF 1).  The GREMLIN emulation was producing a DbZ of 50+ while the MRMS was showing a 30 DbZ. To me, this difference was operationally significant as I would pay closer attention to the developing 50 DbZ feature than I would the 30 Dbz feature. So far in our experiment, this was the opposite of what I had experienced and I initially thought the emulated radar was wrong. I jumped over to the OCTANE products to get a sense of how rapidly the cell was building (GIF 2). My assessment of the cell seemed to confirmed my initial opinion that it was not growing as rapidly as I would have expected given that there was not a strong gradient in the speed or direction products.

Gif One: GREMLIN Emulated Radar on the top and MRMS Composite Reflectivity on the bottom.


Gif Two: OCTANE Products (Speed Upper-left, Direction Upper-Right, Divergence Bottom-Left) and Day cloud Phase RGB (bottom-right)
My opinion changed 10 minutes later.  Seen in image one, the MRMS with the next update showed a similar storm intensity to the GREMLIN emulation. This is impressive when one considers the latency of GREMLIN is greater (about 10 min) than the latency of MRMS (about 2 min). The GREMLIN product actually delivered a more operationally useful product sooner, despite having a greater lag. The GREMLIN product continued to show this ability for two more storms developing further back in the line!
Image One: GREMLIN Emulated Radar on the top and MRMS Composite Reflectivity on the bottom.

-Kilometers

Would you warn?

I want to walk you through a thought experiment that I had today during this event in the Panhandle region of TX/OK, as it enters the southeast corner of the Amarillo forecast area. From the Amarillo forecast area, highlighted in white in GIF one, the environment becomes increasingly more unstable. The storm in question is moving through the bottom right corner of the forecast area moving southwest to northeast.
Here is the question I want you to ponder. Would you warn on this storm with only the environmental information and the two satellite products provided in GIF one? We are assuming we don’t have radar data right now.
GIF one: CH-2, Red Visible GOES-16 1 minute imagery from the MESO-1 Sector.
Okay, I know, we would normally have the prob-severe tool, and lightning data. But I didn’t look at it. So what was my answer? A hard maybe because I would want to make it a group discussion with the other forecasters on shift. My vote would be to warn, but with the lack of information, I would have no problem waiting for a storm report or some other data source.
Now, ask yourself the same question. Would you warn on the cell moving through the bottom right corner of the forecast area? But this time, you have access to the OCTANE suite of products.

Have an answer? Let me share some further information I collected from the developer before we share out answers.


I discussed with the developer what correlations existed between the OCTANE speed and divergence products and the severity of a storm. None had been established yet and the rule of thumb I was left with was that the storm top diverge observed in OCTANE speed products were about 30% to 50% less than the radial velocity divergence signals we normally use with data from WSR-88D. So where we measured a divergence speed of 40 kt in the OCTANE Speed product, the radar velocity should be around 50 to 80 kt, which could definitely support severe hail.

So, I said I would have been comfortable warning with just this additional OCTANE information. That said, a discussion may still be held, but I think this would be the information that gets the warning out more quickly. If I had a table of correlated values and severity? My confidence would sky rocket!

-Kilometers

Update: There was a storm report generated from a mesonet observation that observed a wind speed of 78 mph.

Monitoring Convective Initiation

Convective Initiation along Dryline

We were monitoring convective development along the dryline in northern Nebraska with DSS being provided to a chemical spill across the northern part of the CWA. While most of the initial convective activity remained to the north of our DSS site, additional convective development occurred along a dryline to the south along HWY 83. These storms struggled to maintain updraft intensity and the OCTANE speed and cloud top cooling product was used to monitor the strengthening of these storms. Initial radar data showed spotty convective development, but the OCTANE speed product was particularly useful to show that uniform speed/shear information over the developing convection. None of these storms exhibited any significant divergence aloft and remained nearly steady state for about 20 minutes before weakening. Of note, the PHS and HRRR both showed this area to be void of convection with storms to the north and south. This activity diminished as the sun set. The OCTANE products did increase confidence in our thoughts about further development through the late evening.

MesoAnalysis Support and Lack of Radar

More emphasis has been put on mesoanalysis in severe weather operations over the last several years and utilizing the OCTANE products has demonstrated that it has utility in confirming objective analysis. Scattered thunderstorms were developing across parts of the Carolinas today, but the mesoanalysis suggested that severe thunderstorms would be favored farther south and east of our area of concern through the late afternoon. A quick look at the SPC mesoanalysis of effective shear showed values of 40-50 kt to the south of our area of concern. As thunderstorms started to develop, we were able to use the OCTANE products to confirm that larger areas of shear were present with our southern storms.
Thunderstorms were ongoing across parts of northern SC and southern NC through mid afternoon. The OCTANE speed products clearly show slower wind speeds aloft to the north, while our southern storms show much higher wind speeds aloft and even some divergent signatures to the southwest of our event. A few of these southern storms would eventually become severe. This product will be beneficial to short term operations in confirming local objective analysis.

Our case also required us to look at information without utilizing radar. The GREMLIN product filled the role of radar data, but some notable issues were present. The GREMLIN latency approached 20 minutes at time, which really makes the product unusable for real time warning operations. However, discussion with the developers indicated that some of these latency issues could be overcome. The utility in the product comes from its visual representation. Forecasters are used to looking at radar data, and this product offers something similar. Latency issues must be overcome for it to be usable in operations. The product overlaid with real time lightning data would offer utility in areas with poor radar coverage or during times of significant radar outages. After working a few days with the other products, the GREMLIN utility really became evident in the absence of regular radar data. An example is shown below.

Octane Trying with Confirmed Tornado within QLCS

Day 1:

A NE-to-SW line of storms approaching the southern Texas/Louisiana border from the west with another W-to-E oriented line of scattered storms developing along a stationary front. The eastward moving storms starting to bow out with notch in the line starting to develop near the town of Starks, LA. Low-level rotation starting to show on SRV with a weak TDS showing up between 2115-2117Z and a stronger TDS at 2130Z. Radar starting to show what looks to be an embedded supercell within the line and several mesovortices beginning to develop just offshore along the southern half of the line.


  2117Z
 

2130Z
        Leading up to the development of the tornado, the Octane speed product indicated a decent speed decrease on the upshear side of the storm before tornadogenesis. The Octane speed product also showed higher speeds wrapping slightly back to the west just to the north of the main updraft. The Octane direction product also showed an interesting appendage developing just to the east of the speed min at the same time.


        As the storm cycled, and new updraft and meso developed, another speed min and direction changed was noted. The two products again showed higher speeds bending back to the west and the northern side of the updraft and another appendage developing on the direction product. While this storm did not produce a tornado, strong wind gusts of 55-60 mph and damage was reported.
– Vera Mae

HWT Day 2: Protecting the Quartet

Protect the Quartet!

Today we were charged with the noble task of watching over the the Quartet Festival located in Lawrenceburg TN. Gaps in the cloud coverage allowed us to utilize some of the satellite products a little more efficiently today. Our first sign of trouble came as convection began to form out in front of the main line moving WNW out of Alabama. LightningCast 60-min prob gave us our first initial heads up that lightning was possible with storms forming out ahead of the main line. A combination of Octane overlaid with GLM data was the primary source in our decision making to issue a notification to the event organizers. Thanks to our quick decision making, everyone is alive to sing again another day.


We combined lightning cast and ENTLN data with the radar to provide ground truth on when lighting was first scene within the 15 mile range ring which allowed us to issue follow up messages regarding the likelihood of ongoing lightning potential. Requesting a LightningCast point too also gave us confidence in issuing notifications to the event organizers.


Discussing the LightningCast Probability data with Kilometers we were discussing ways to get more information out of it. We settled on loading the LightningCast as an image rather than contours. This combined with the sample tool and overlayed with Total Lightning products was more useful when forecasting for a specific DSS point. We also went ahead and limited the data being showed on the lower end of the GLM Flash Density. We didn’t want to exclude the Flash Density on the lowest end all together, but we wanted to highlight and compare the GLM Flash Density to the areas with the highest Octane SpeedSandwich. Our end result was this GIF below:


Today was a day to dive into GLM and Lightning probabilities. Once we settled on what we wanted to look at to make DSS related decisions, we realized that it wasn’t intuitive to the public. We needed a way to redesign the the Lightning Cast data to be easy to look at to the public. Because the NWS already has a color table for threats utilized by our National Centers, we decided to model our threat level based on the SPC’s convective outlook to create new colors for the contours. The following graphic is the end product of that:


As the system moved past, identifying areas that we could issue the all clear on was our next priority. The LightningCast created a nice looking bell curve that lined up with the time that the MCS moved over the event and showed the trends of the storm began to wind down.

Getting in Shape

Two aspects for what constitutes operational relevance jump to mind when discussing radar imagery. The first is the shape and the second is the intensity. In the image below a line of storms is moving through central Tennessee. The GREMLIN emulated radar is doing a fine job at showing the location of the convection. Where it is still lacking some usefulness to warning operations is not having high enough DbZ returns. Even so, between the two aspects, I believe GREMLIN is resolving the more operationally useful aspect because we can use the prob-severe tool to infer strength and warn on the meso-scale analysis.


Image one: GREMLIN Emulated Radar on the left and the MRMS composite reflectivity on the right.

Image two: GREMLIN Emulated Radar on the left and the MRMS composite reflectivity on the right later in the event.


-Kilometers

Missing data

Charmander and Kilometers were watching over an event in central Tennessee and employed the lightning cast meteogram. The probability of lightning tool worked (img. 1) great for alerting the event staff to an increase in the lightning threat, providing about 45 minutes of lead time.

I began to monitor the cell for further intensification and any chance that it could become severe. In the background of this work I was also monitoring for lightning activity from the cell. Eventually, the cell did produce lightning. Image two showed the ENTLN product pick up on a series of cloud flashes, with the GLM product showing some light lightning activity two minutes later (img. 3).

Positive for GLM was that the latency was not an issue. What was more of an issue was that the meteogram from lightning cast never plotted the GLM data on the meteogram. If the person working the event shared the meteogram to event organizers, they would assume this was a missed event. Positive though, is that the organizers could be shown the GLM image or ground network data and be assured that their actions were not for nothing. This left us wondering why the meteogram did not show the lightning activity picked up in the vicinity?

We saw that the GLM began showing up when the main line of convection moved through the event space about an hour later than we identified it through alternate means (img. 4).


Image one: Meteogram for the Probability of Lightning product with GLM flash Density.


 Image two: GLM Data quality (upper-left), GLM Background Image (upper-right, Day cloud phase RBG overlaid with GLM Flas Density (Bottom-right), ENTLN observed lighting flashes and cloud-to-ground strikes (bottom-right).


Image three: GLM Data quality (upper-left), GLM Background Image (upper-right), Day cloud phase RBG overlaid with GLM Flas Density (Bottom-right), ENTLN observed lighting flashes and cloud-to-ground strikes (bottom-right).


Image four: Meteogram for the Probability of Lightning product with GLM flash Density beginning at 15:15 local time.


– Kilometers / Charmander

Convective Initiation Failure

Watching a New Updraft Among ongoing Convection

Multiple supercell thunderstorms were ongoing across South Texas along and behind a southward moving outflow boundary within a strongly unstable airmass. At 2115Z, a new updraft began to develop near Realitos, TX to the southwest of an ongoing thunderstorm.


Fig 1: Notice the cooling cloud tops in the CTC image (top right) near Realitos, TX at 2114Z. This updraft is evident in the Day Cloud Phase Distinction RGB and Visible imagery.

About 5 minutes later, the cloud top cooling peaks near Realitos. The first faint radar echo become evident to the southwest of the ongoing supercell.


Fig 2: Cloud top cooling peaks at 2119Z near Realitos. The first weak radar echo is evident to the southwest of the ongoing supercell.

At 2127Z, the cloud top cooling product indicates that cooling has significantly decreased. Meanwhile the cloud top divergence product suggests little to no meaningful divergence is occurring. This suggests that the updraft has weakened and will not likely continue to develop. The latest CRP 0.3 degree reflectivity shows an intensification of the precipitation in this area, but the satellite derived imagery suggests that this intensification on radar is temporary and the updraft will continue to weaken.


Fig 3: Cloud top cooling has decreased and no notable cloud top divergence is observed. There is still considerable “texture” in the visible and daytime RGB. Notice the increase in reflectivity to the south of the ongoing thunderstorms.


The information from the derived products suggest that this updraft will likely not develop into an additional thunderstorm near the outflow boundary. There were several minutes of lead time over radar/visible imagery gained from these derived products to indicate that the updraft would not develop fully into a new thunderstorm. An animation of the updraft sequence is shown below.


wthrman