USING THE GLM BACKGROUND & DATA QUALITY PRODUCT (DQP)

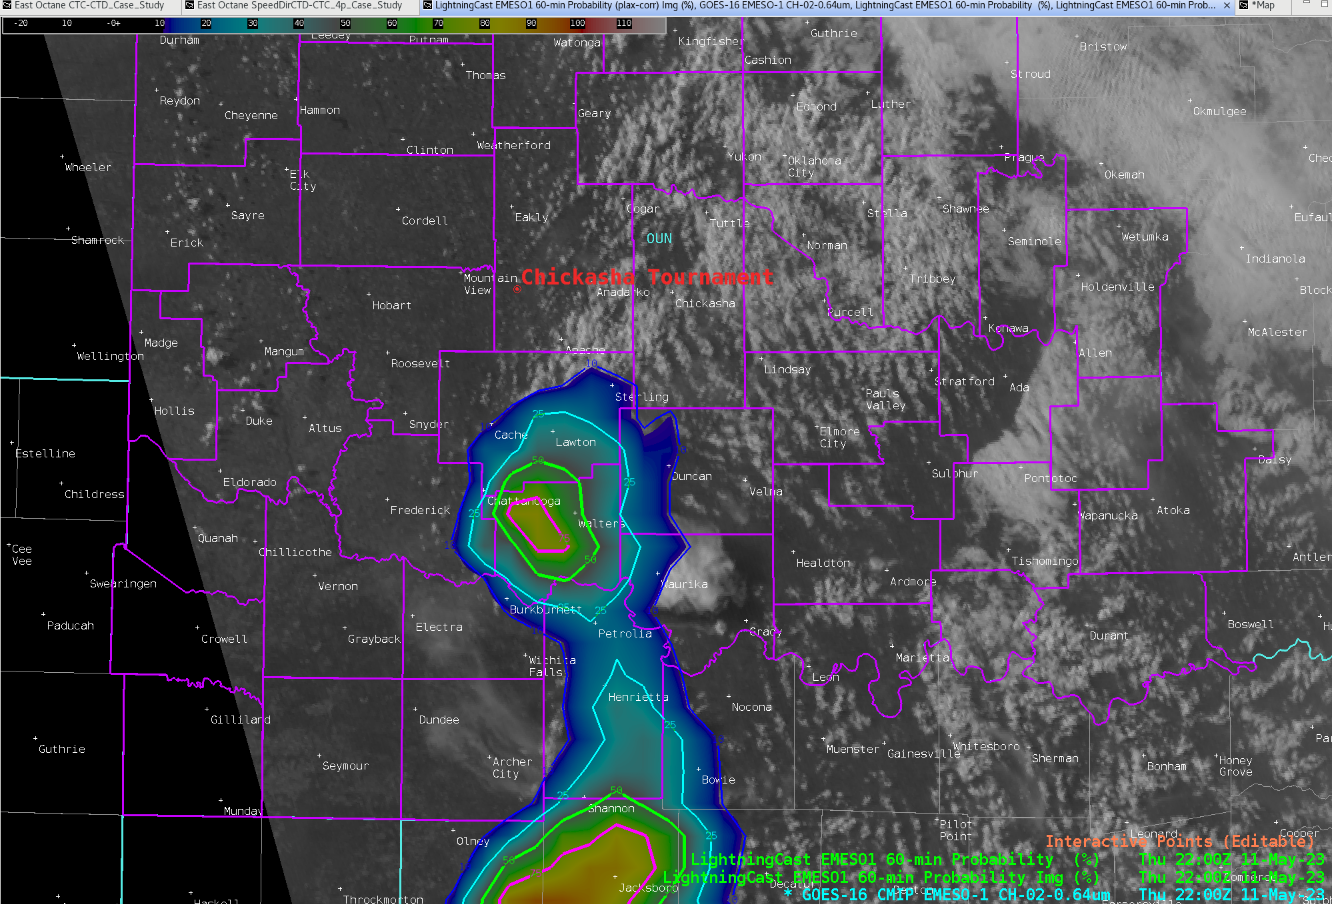
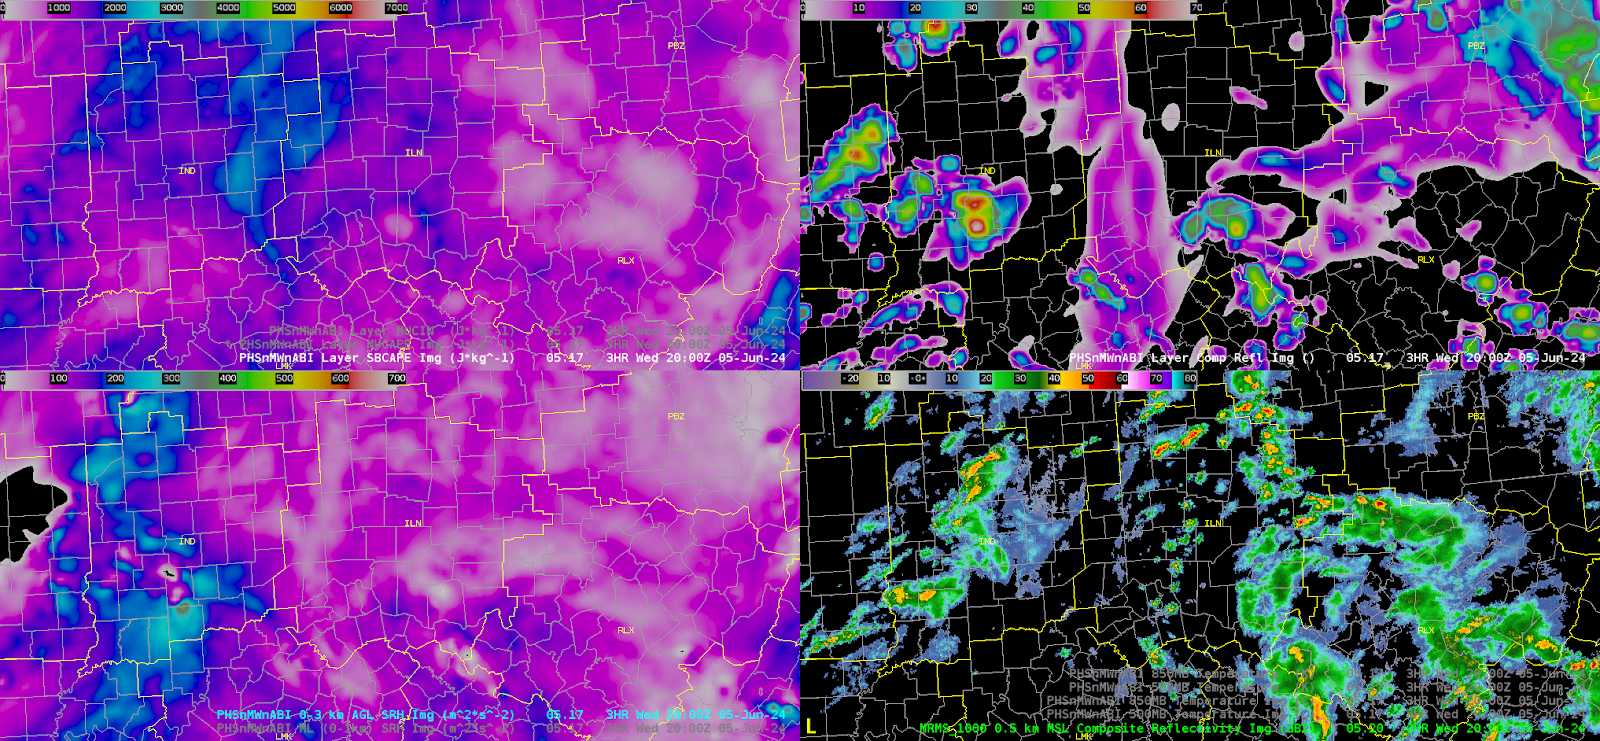
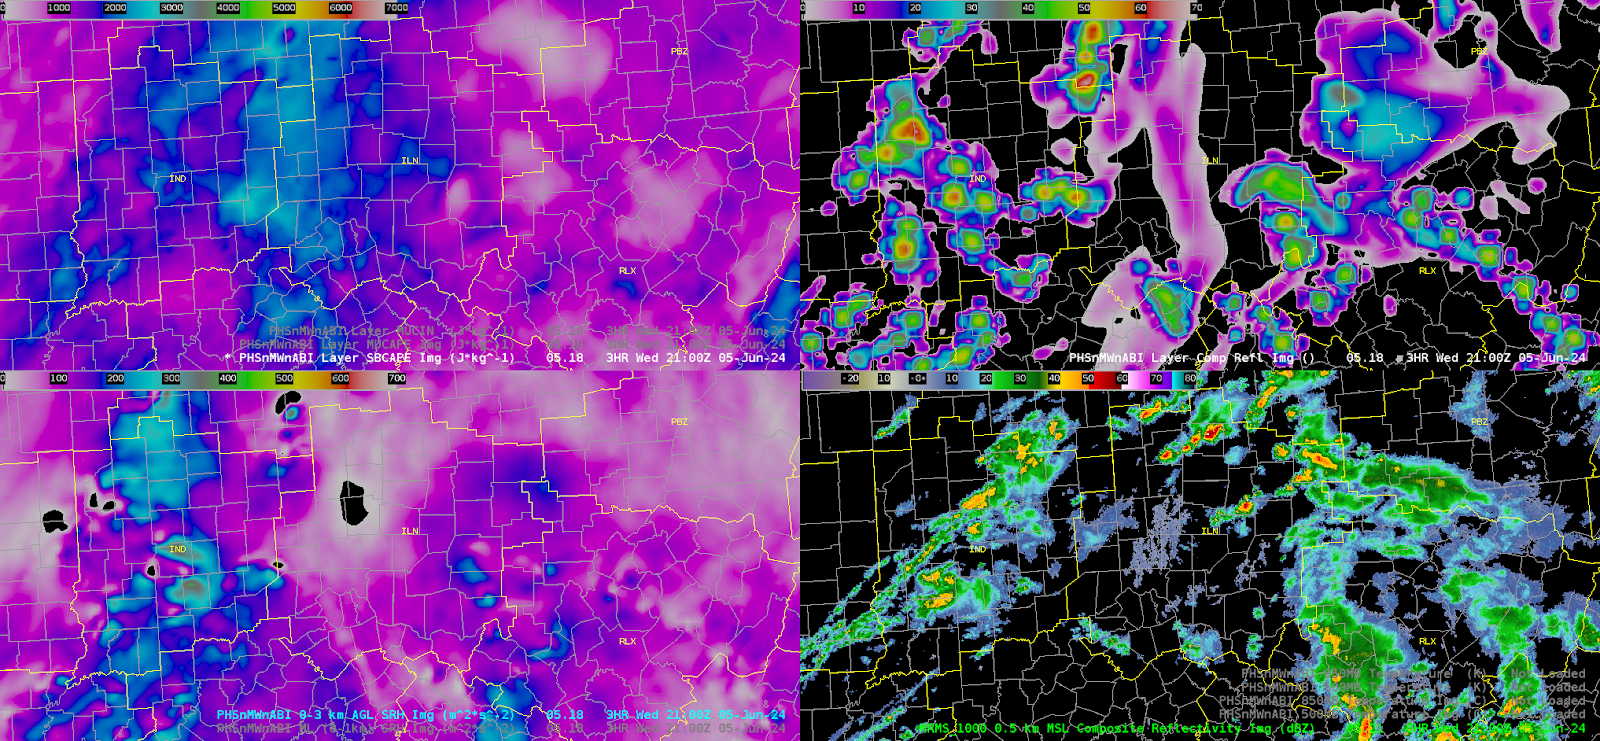
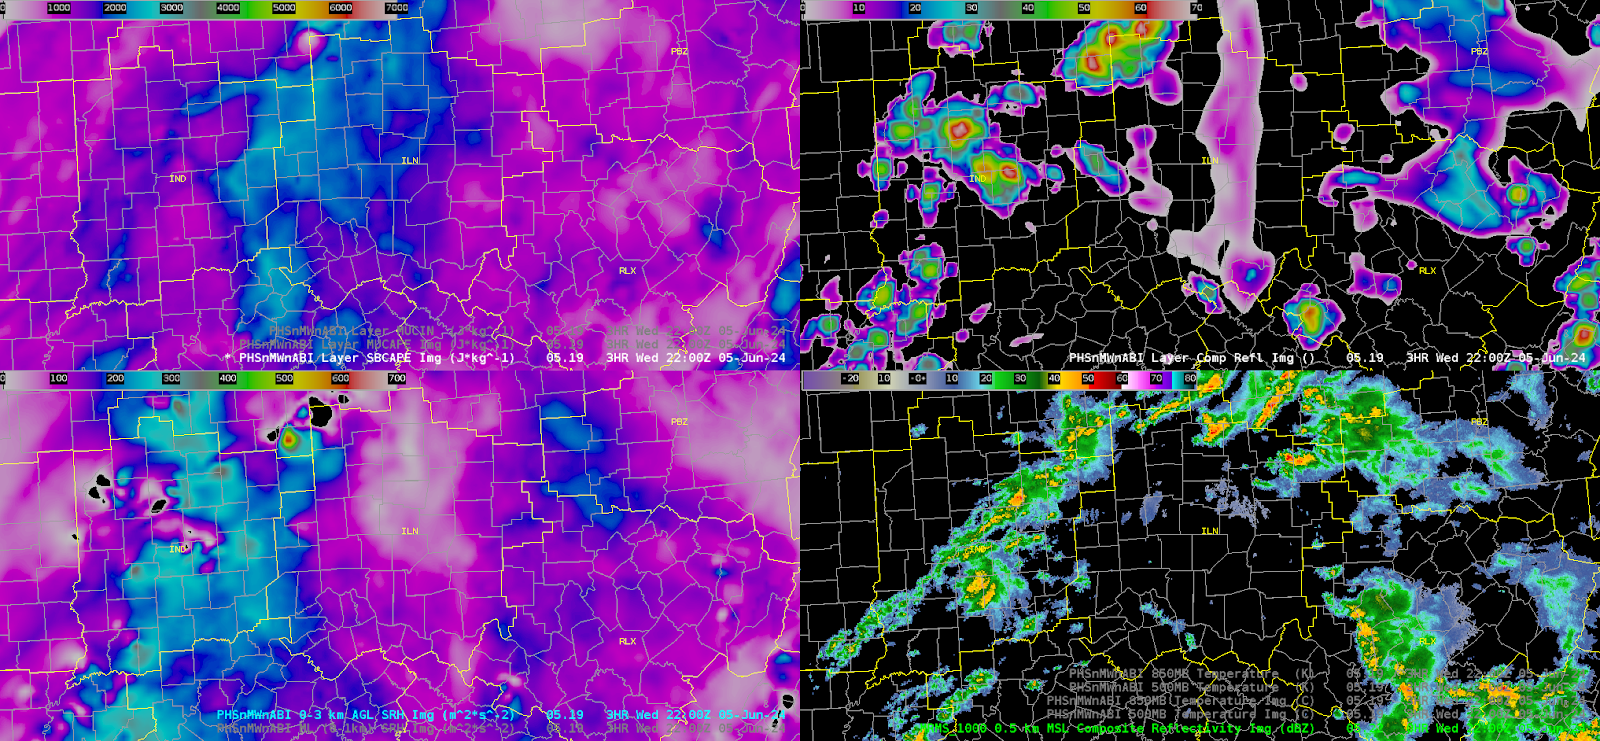
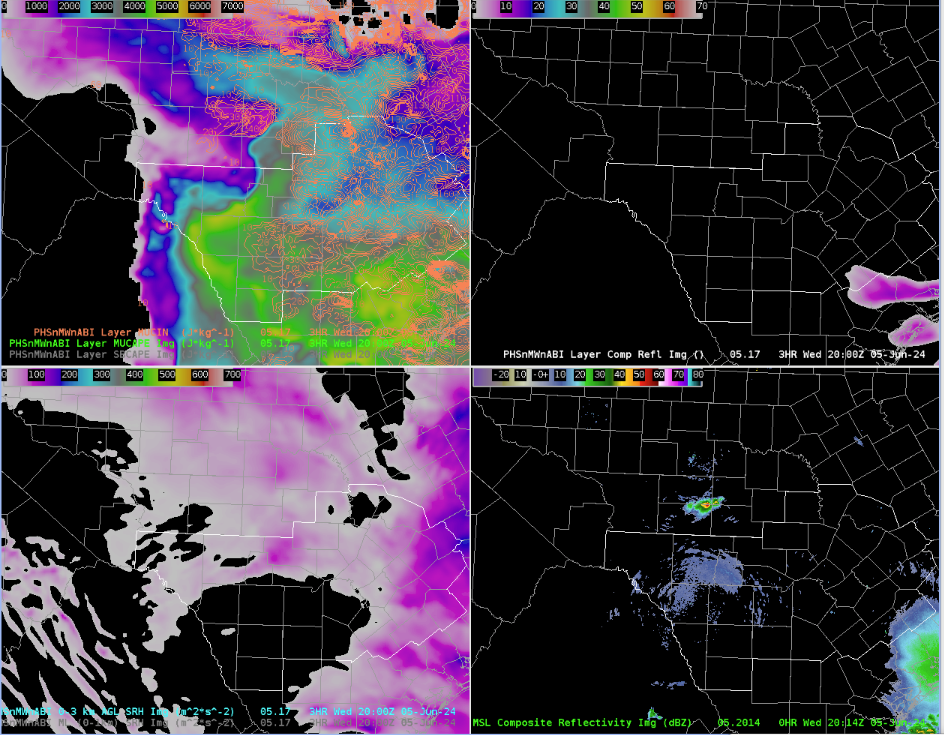
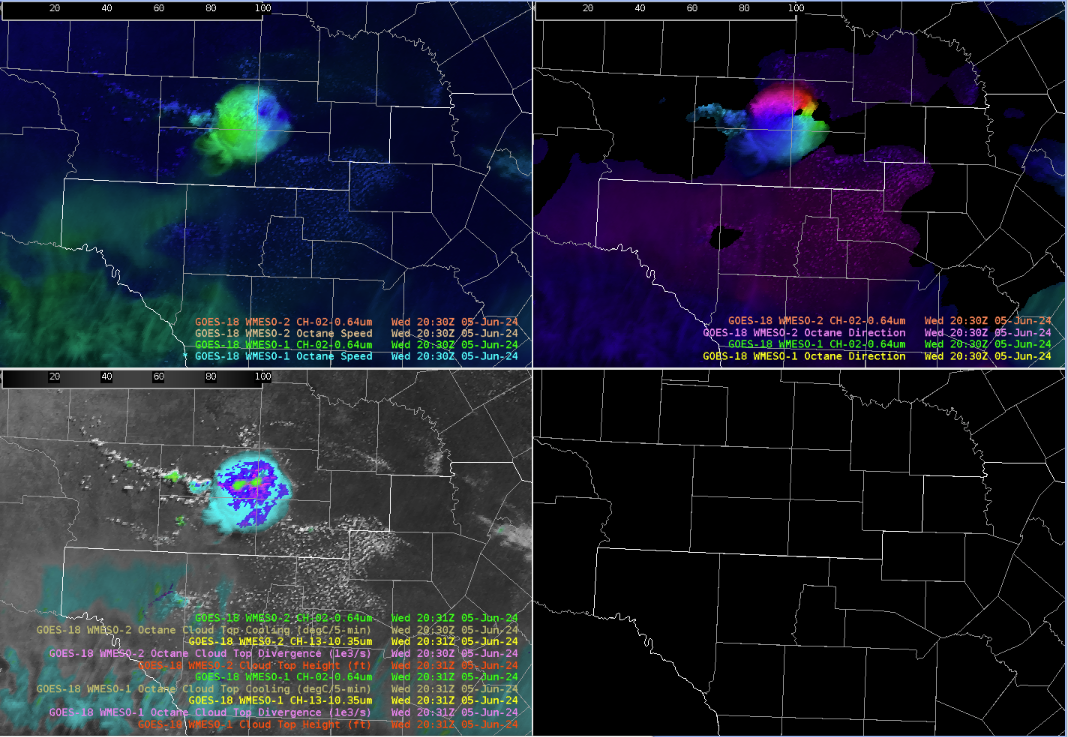
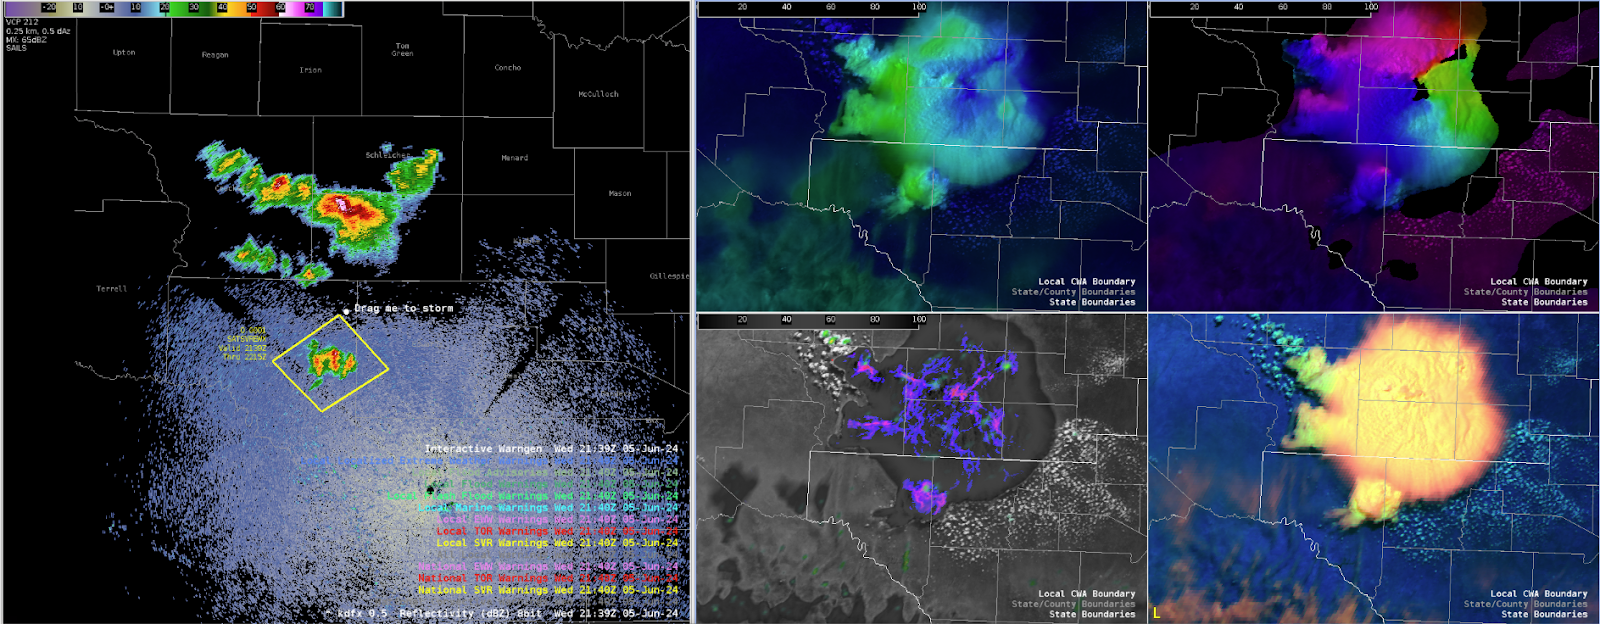
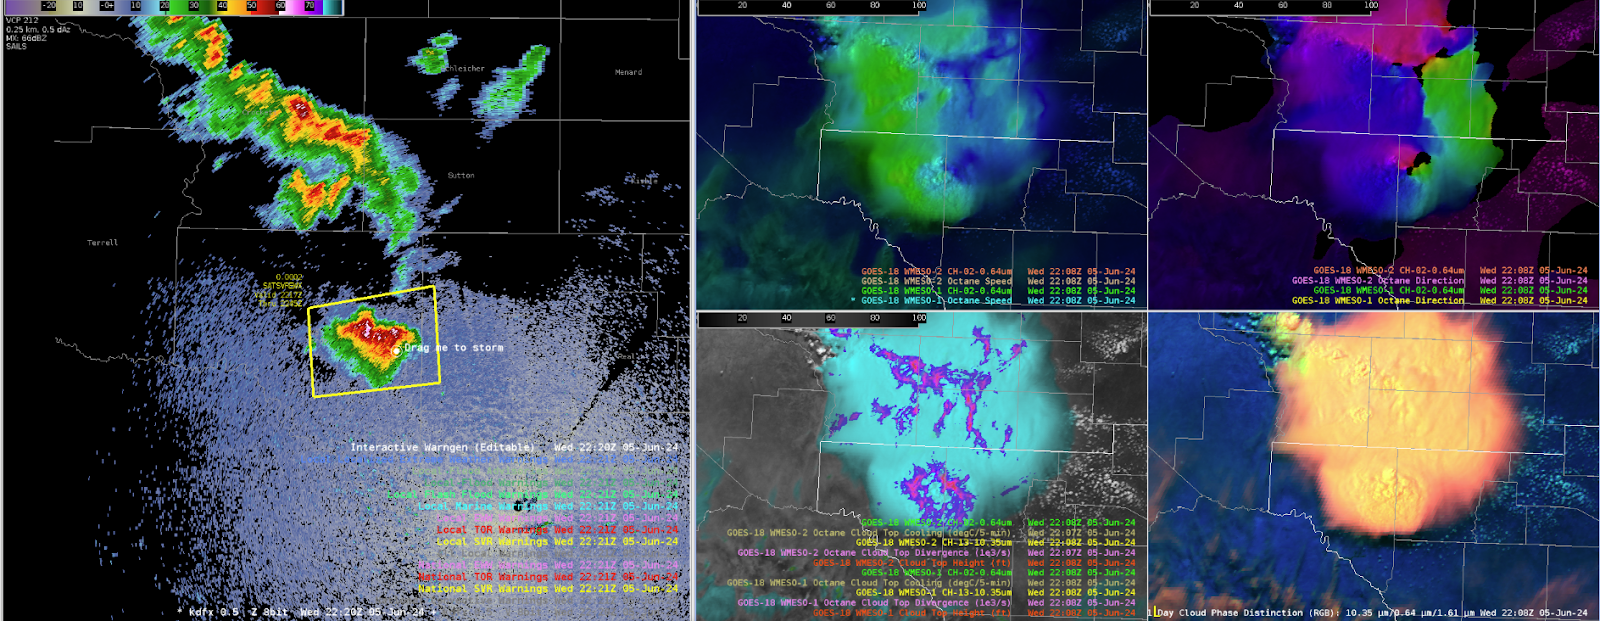
Here is an inspection of the GLM Background and DQP to get a feel for the reliability of the GLM flash extent density (FED) data.  Below you will notice a four panel display with GLM quality on the upper left, the GLM background image on the upper right, the GLM flash extent density on the bottom left, and the 0.64 visible satellite imagery on the bottom right.

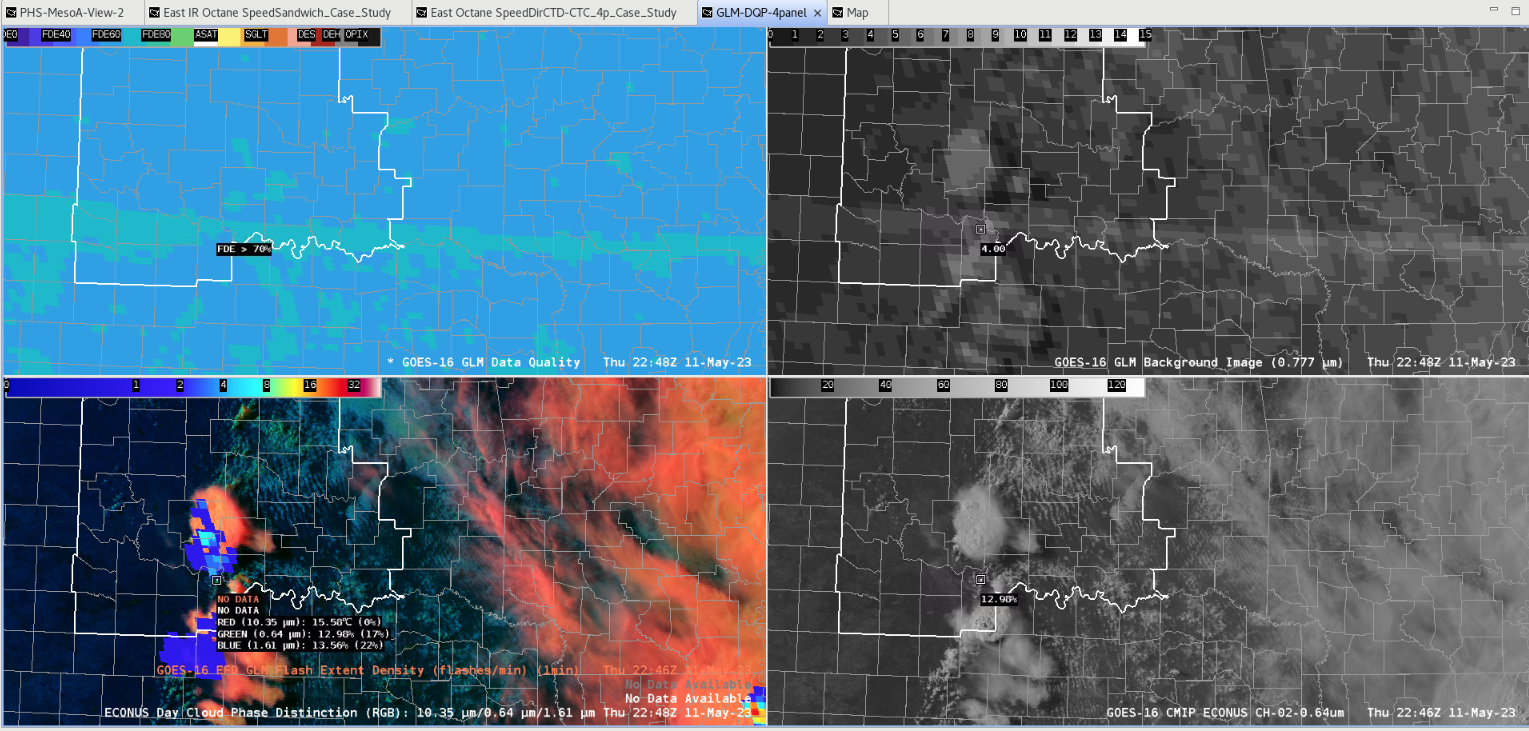
You should be able to make out a sub-array boundary going horizontally (upper left panel) AND also in the GLM background image (upper right panel). In the top right and both bottom panels you can make out strong convection taking place with two cells (one in the southern portion of the CWA, and one just to the south and along the CWA border). I did my best to put my AWIPS cursor along the sub array boundary.  You will notice in the bottom right corner that the cursor is actually between the two convective cells.  However, you can make out some weaker GLM FED signals along the sub array boundary where you are in-between the two cells.  This demonstrates uncertainty around the validity of the GLM data just to the south of the northern convective cell.  They are weaker GLM FED returns with only a minute or so of lag among the various elements being shown. And with these returns being upshear of the northern cell it is likely that this is not related to anvil lightning activity.  In this example with the relatively close proximity of the two cells one cannot be sure that the GLM data is incorrect, but with the GLM returns showing up on the sub array boundary this does increase uncertainty around this portion of the GLM flash extent density data.

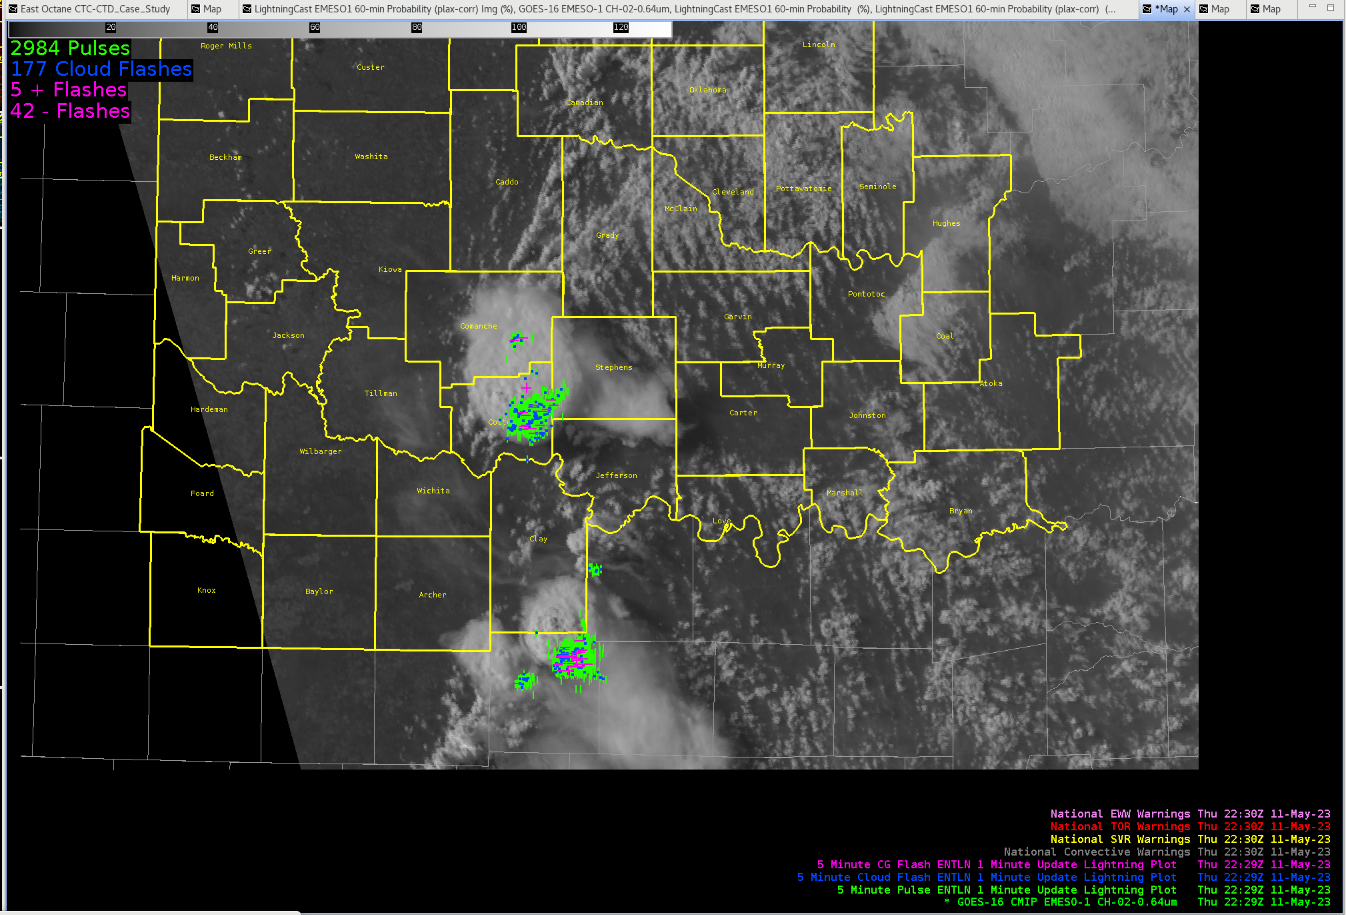
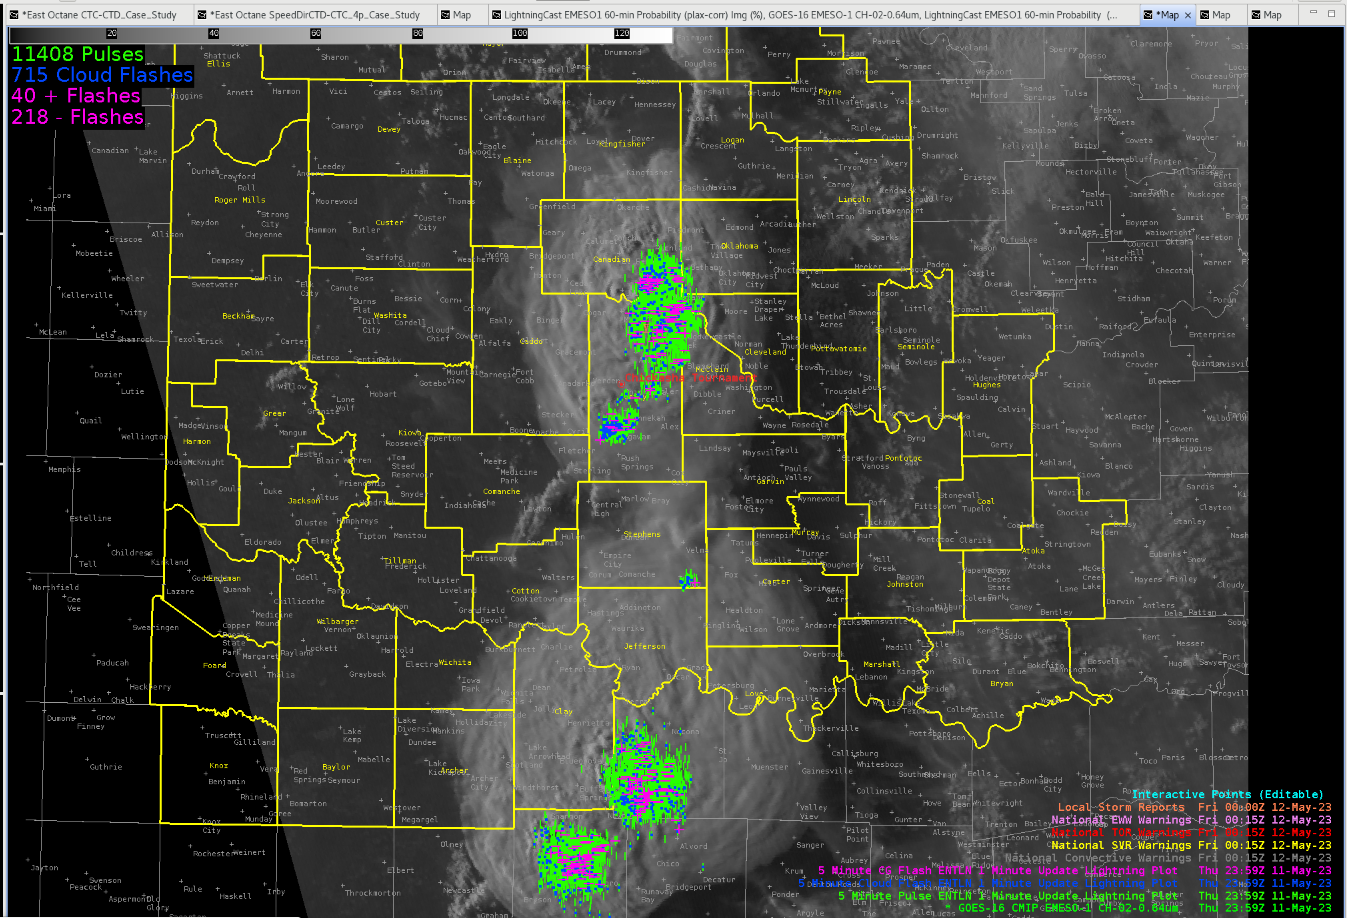
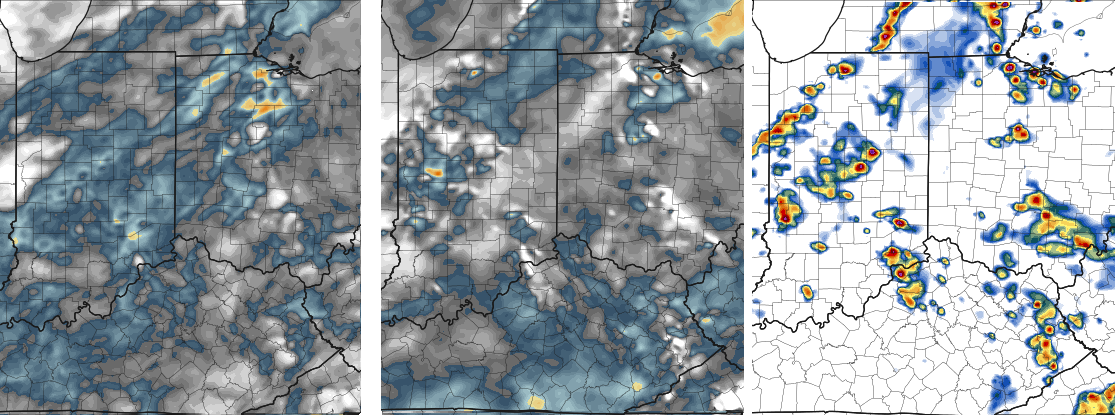
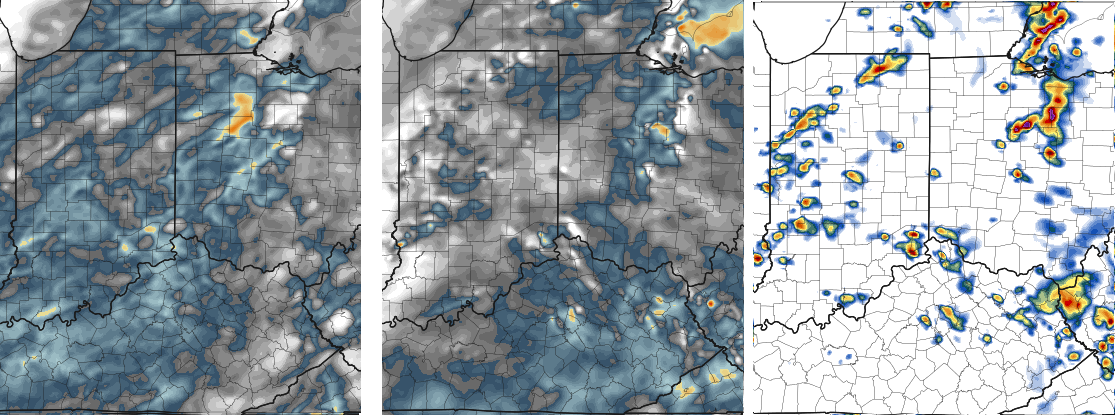
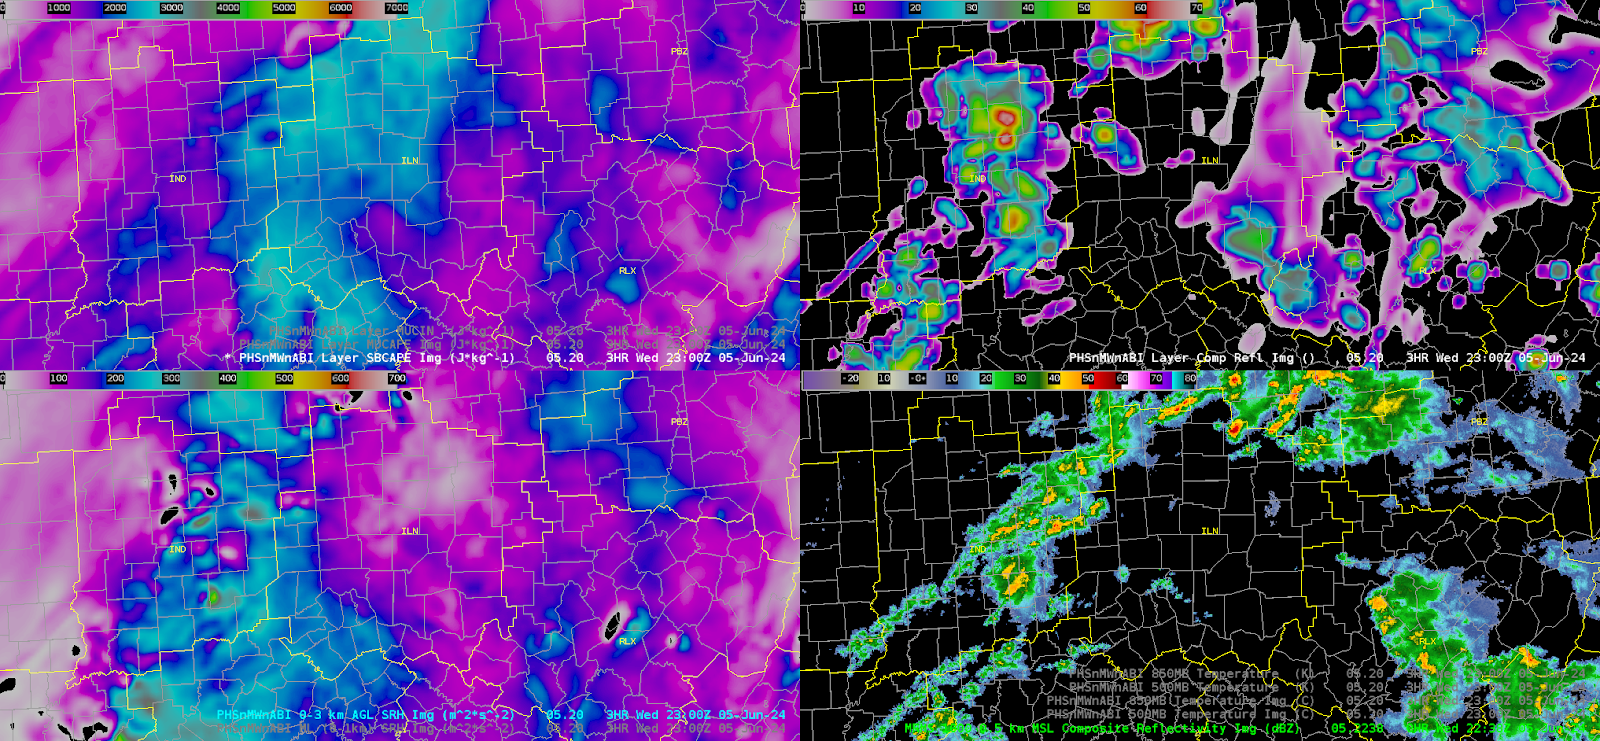
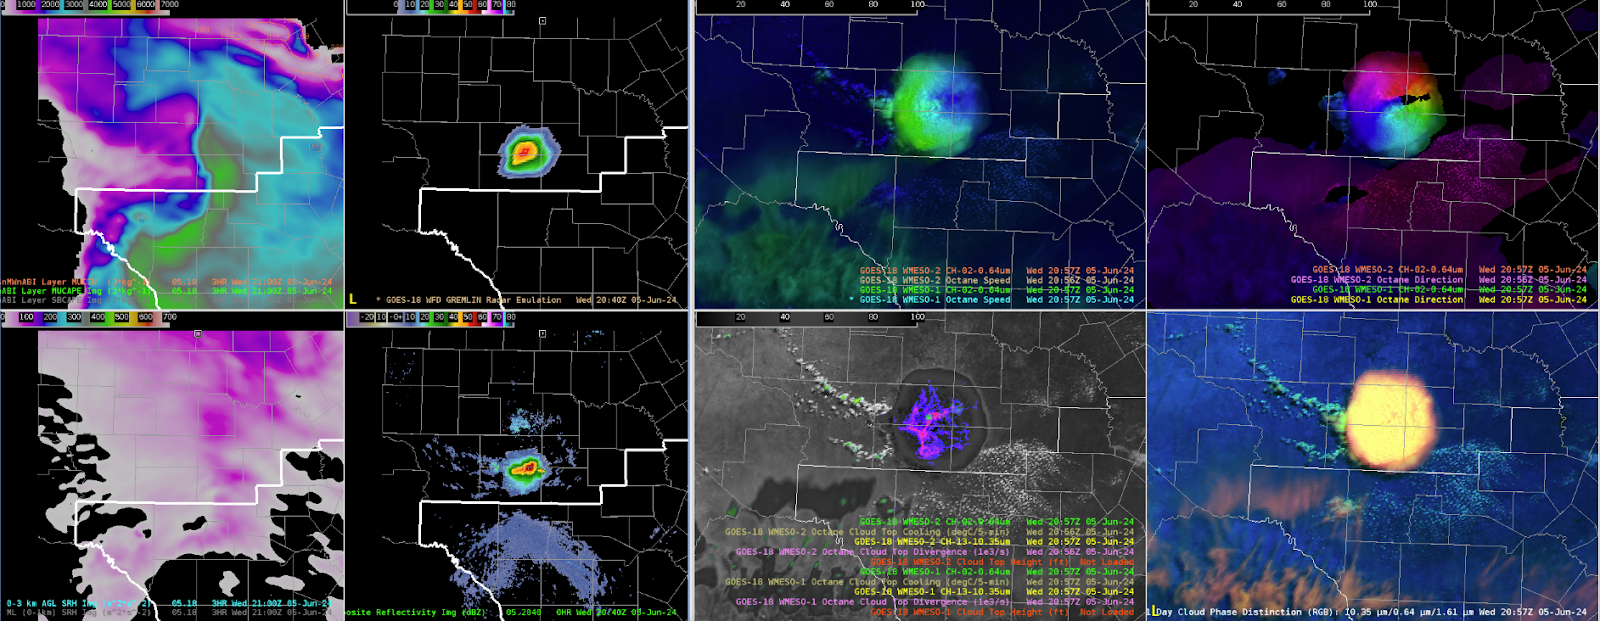
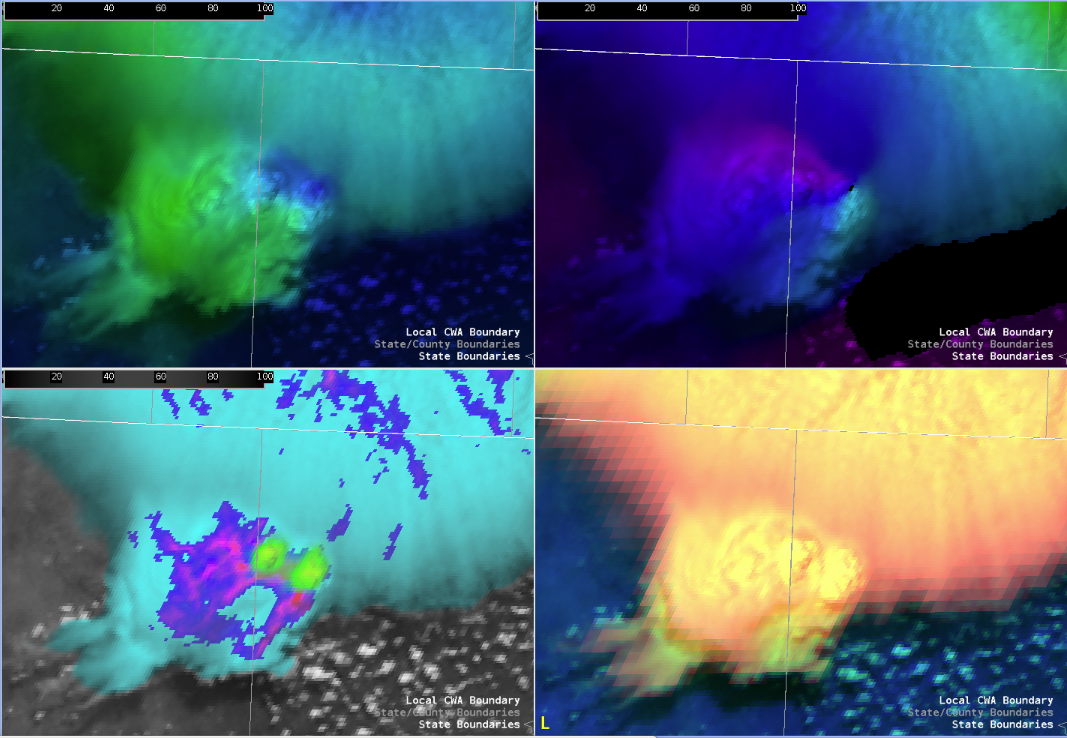
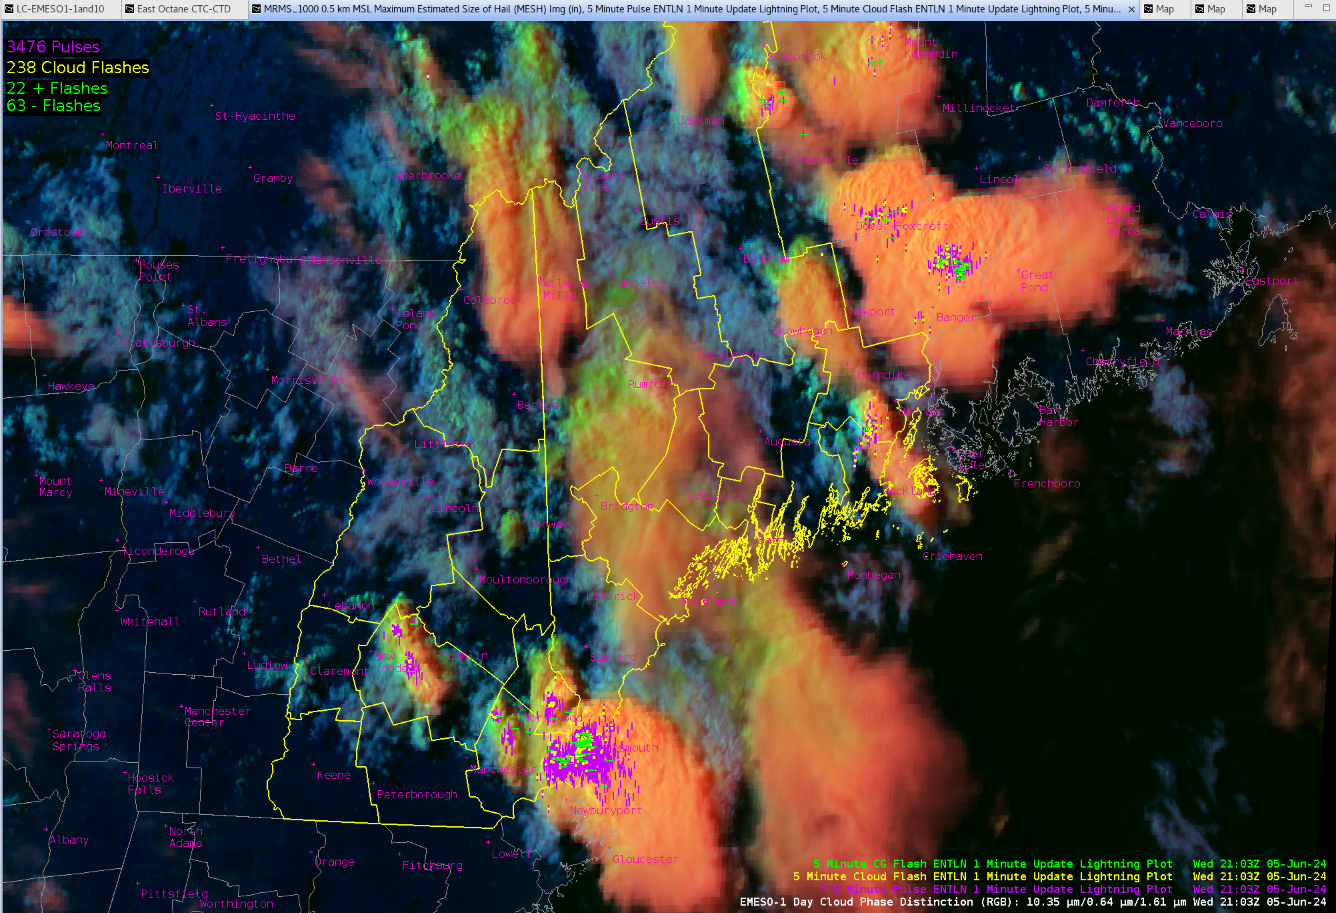
Below is the same four panel, but with the ground based earth lightning detection network showing as verification for lightning.

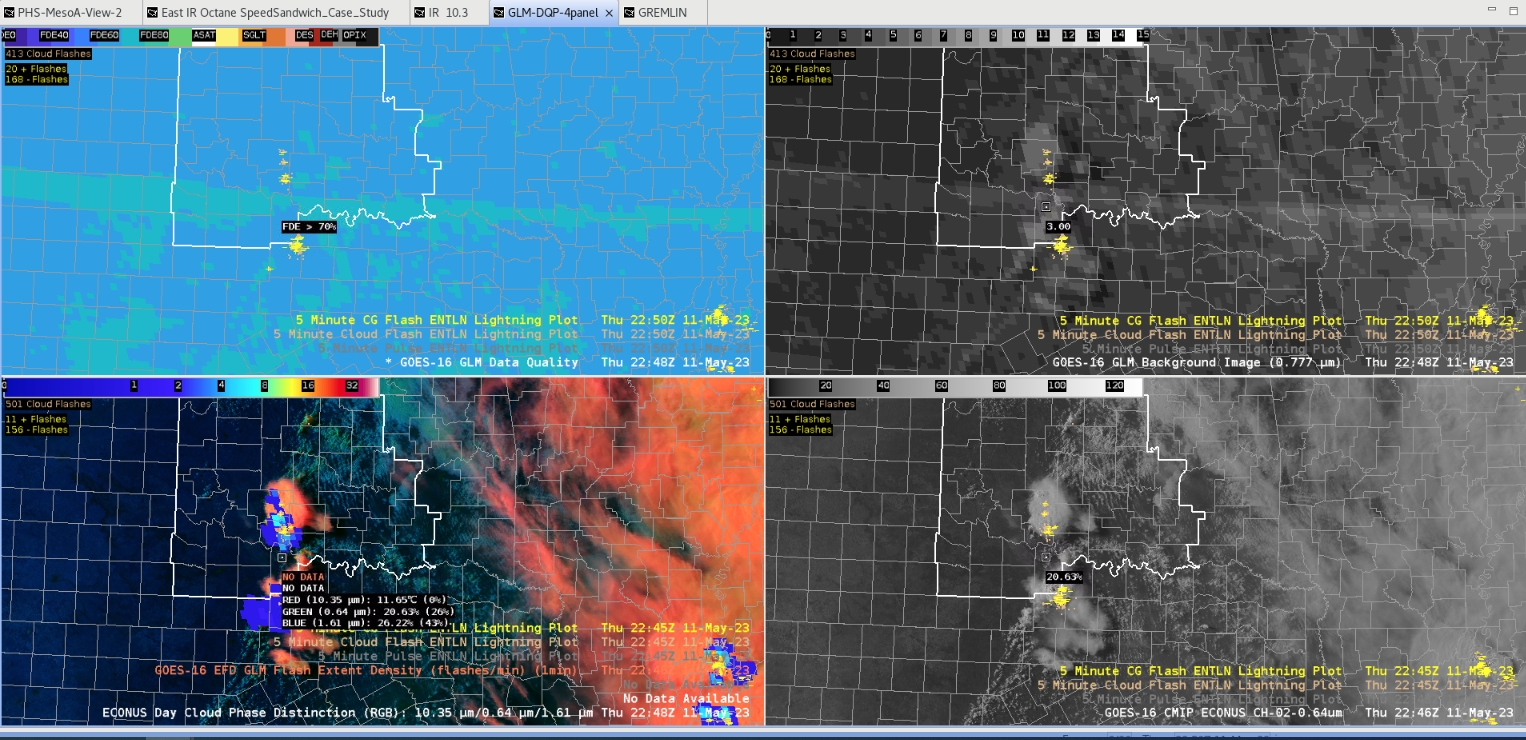
Notice how there is a weaker return with the GLM flash extent density on the southern portion of the northern cell, but the detection (lower right panel displays best) shows the lightning verification within the convective cloud shield and not past the southern portion of the northern cell like in the GLM FED (bottom left panel).  This demonstrates that one should question a portion of the GLM flash extent density output. By using the GLM data quality and background products one can get a better feel for where the GLM FED data may not be reliable.  If something doesn’t make sense with regard to GLM output then this product can verify that suspicion.

– 5454wx

Storm-Scale Environmental Analysis of Early Convective Development

This case at WFO OUN brought forth a challenging situation monitoring developing severe weather with no available radar data, and only relying on satellite products for storm interrogation and convective warning decisions. This analysis will primarily focus on the evolution of early convective development and how satellite products/PSH data helped gain a better understanding of the environment.

My role in the team monitoring/analyzing the environment was focused on issuing warnings and having the Mesoanalyst(s) relay satellite, PSH and GREMLIN information to support warning decisions. To prepare and gather a greater situational awareness of the environment and what satellite was observing, I loaded in RAP13 Right/Left Bunkers vectors which would aid me in effective polygon design. Given the orientation of the hodograph per observed soundings earlier, storms would support the potential for left/right splitters meaning proper storm motion/polygon flare is very important.

Convective initiation began around 21-22Z with noticeable towering Cu across Cotton County, OK, prompting the first issuance of a SVR at 21:56Z given cooling cloud tops/increasing storm top divergence.

Towards the end of the loop above, observation was made that the overshooting tops were turning more ENE biasing closer to the bunkers right, implying the likelihood of the storm developing a mesocyclone. Not shown here, but a useful trick of enhancing the contrast of the Day Cloud Phase RGB became extremely useful in tracking overshooting top motion and intensity, along with other satellite products diagnosing an intense updraft in progress.

The pre-storm environment was analyzed using PHS data, highlight ample MUCAPE on the order of 3500-4500J/kg around the area of CI,  and large-scale 0-3km SRH ranging around 250-350m2/s2, bringing support for stronger/severe storms to attain rotation in a volatile, highly unstable/moderately sheared environment.

WIth the storm obtaining a developing/intensifying left splitting  updraft (later in the first loop), confidence of a strengthening mid-level mesocyclone increased leading to a transition to a base TOR warning, with polygon design mainly following the bunkers right motion vector to imply near-term motion to continue ENE.

Modifying the OCTANE speed product by decreasing the max observed values downward and min values upwards helped diagnose a more eye turning signature to storm top divergence. Additionally, modifying the direction scale, albeit took some work, came out with a product that illustrates (in red) backed sfc winds <`180 degrees which existed well ahead of it, inferring the likelihood of larger curved hodographs and greater attendant estimated low-level SRH.

However, one item that was not noticed until after the TOR warning was the winds being ingested into the storm (shown in green) averaged around 210-230. This appeared very accurate looking at feeder cumulus ingesting into the inflow region of the cell just to the SSW. Less backing of the surface winds yields much less available streamwise vorticity (in fact is mainly crosswise) leading to the likely reason the storms rotation did not strengthen, and ultimately collapsed 30 minutes after the image above and the left-turning supercell became the dominant storm.

Overall, OCTANE exhibited great, practical uses to understanding not just the storm intensity/trends but the environment explaining why the storm was behaving the way it did.

– RED11248

Comparing GREMLIN and LightningCast to actual Reflectivity and ENTLN Lightning Plots

Radar is an essential tool used across all CWA’s daily. What would you do if your CWA had the potential for severe weather but you did not have radar or MRMS? Well that is something I was able to experience today across KOUN’s CWA. Satellite convective products such as GREMLIN and LightningCast were crucial in being able to determine storm location and intensity. GREMLIN was helpful in being able to get an idea of the location of storms along with their intensity even though the range of reflectivity with GREMLIN is limited. The general idea was to see if there were any areas with high end reflectivity near 50 dbz as that usually indicated an area of stronger storms. If there were any areas with lesser values this may mean developing storms that could be checked with LightningCast data to see if it believes storm development is likely to occur there. Speaking of LightningCast it was very useful in determining locations of possible future storm development. Using the >1 strikes within the next 60 mins really helps highlight areas of potential storm development and motion. When comparing these products to actual reflectivity there are a few things that stand out. The first being a good ability to get a general idea of potential strong storms and future storm development. Both products highlighted about the same area where the actual reflectivity was located and where lightning clusters developed.

\

These products were then able to do a good job in picking up the intensifying storms and their likely future location. This was shown from data taken at around 23Z.

Overall, both of these products were extremely useful and successful when it came to forecasting severe thunderstorms in a scenario where radar was not available. I can most definitely see these products being applied to everyday convective ops at CWA’s across the CONUS. The last two images show the 00Z comparison between GREMLIN and actual radar reflectivity.

– Sven The Puffin

OCTANE in a Pulse Environment

The environment across the ILN CWA this afternoon was one which favored pulse convection as deep layer shear was fairly weak. At around 4:45, we began watching a storm in the northern portion of the CWA that seemed to be strengthening quickly. Unfortunately, the OCTANE data was coming in around 30 minutes late at this point, so we had to rely on traditional methods to assess storm strength. We decided to put out a Severe Thunderstorm Warning on the storm as radar indicated that it was capable of producing 1” hail. Luckily, the OCTANE data caught up not long after and I was able to analyze it as well.

This first image is from around the time that the warning was issued. Looking at the speed and direction products, we see that the gradients are rather diffuse. This is indicative of the weak deep layer shear. However, looking at the cloud top cooling, we see cooling of around 3°C which implies that the updraft was strengthening at the time the warning was issued.

This next image is from 4 minutes later. The speed and direction products still show a diffuse gradient, but the cloud top divergence product really stands out. This lines up with when the storm appeared strongest on radar.

This final image is from around the time that the warning expired. The cloud top divergence is considerably weaker than it had been and radar also indicated that the storm was weaker. We were comfortable with letting the warning expire.

This storm made me think about the utility of OCTANE products in a pulse severe environment. It seems that the cloud top cooling and cloud top divergence products would be significantly more useful than the speed and direction products as you can use them to quickly infer changes in the severity of the storm based on updraft strength.

-EI2018

LightningCast Miscellany over Ohio

The scenario for the Ohio/Indiana area today is pop-up convection ahead of a cold front, with a gap, followed by the front itself. The pop-up convection was already getting going when we began ops for the day, but a few cells were able to be observed in the developing stages. The main convection with the front was just starting to enter our CWA when HWT ops ended for the day.

Troy Strawberry Festival

The festival was in the lull environment between the pre-frontal convection and the convection associated with the front itself for the majority of ops today, though a couple cells did approach the festival area early on in our shift. We were still getting spun up for the day when those cells developed. It was technically a missed DSS event, but I utilized the on-demand LightningCast dashboard to retroactively look at the situation and see how the LC performed and the utility of the dashboard itself. With this event, LightningCast performed fairly well, giving an approximately 10 minute lead time between the peak lightning probability within the following hour and the first GLM flash. A few minutes of additional lead time could be tacked on if you go back to when the probabilities began to spike. I believe this rapid rise in probabilities to be enough time to quickly give the festival a call, alerting them to the likelihood of lightning within the next hour. However, not sure if we’d be able to tell them it would occur in the next 10-15 minutes.

Darke County LightningCast Progression

LightningCast dashboard plot showing the time and probability value of the peak.
LightningCast dashboard plot showing the time of the first GLM lightning flash observation.
– Loki

PHS/HRRR/SPC Meso Comparative Analysis

Overview:

For this event over the ILN CWA, we will focus on 3hr forecast verification from hourly runs of the PHS and HRRR starting at 17Z, ending at 20Z. Each models 3hr forecast will be compared with SPC mesoanalysis data for verification/comparative analysis.

PHS & HRRR 3hr Forecast Comparison & SPC Meso Verification [20-23Z]

PHS 17:00Z valid for 20:00Z

SBCAPE [J/kg, top left], Layer Comp Ref [top right], 0-3km SRH [m2/s2, bottom left], MRMS Comp Ref [dBZ, bottom right]

1700Z HRRR valid for 20:00Z

SB CAPE [J/kg, left], 0-3km SRH [m2/s2, middle], Sim Comp Ref [dBZ, right]

20:00Z SPC Mesoanalysis

SB CAPE/CIN [J/kg, left] & 0-3km SRH [m2/s2 + Storm Motion, right]

20:00Z Summary:

Lingering convection was observed around the area, but diminishing in intensity/coverage. PHS identifies a bullseye of higher 0-3km SRH to the south/west around the order of 150-250 m2/s2, while the HRRR has much lower values around 50-100m2/s2 which verified closer to SPC Mesoanalysis.
Instability was much greater per SPC mesoanalysis upwards of 2000-2500 J/kg, where both the PHS and HRRR were forecasting much lower values.
Convection would be slightly overdone in intensity/coverage from both the HRRR and PHS.

PHS 18:00Z valid for 21:00Z

SBCAPE [J/kg, top left], Layer Comp Ref [top right], 0-3km SRH [m2/s2, bottom left], MRMS Comp Ref [dBZ, bottom right]

1800Z HRRR Valid for 21:00Z

SB CAPE [J/kg, left], 0-3km SRH [m2/s2, middle], Sim Comp Ref [dBZ, right]

21:00Z SPC Mesoanalysis.

SB CAPE/CIN [J/kg, left] & 0-3km SRH [m2/s2 + Storm Motion, right]

21:00Z Summary:

By this time frame, we entered a lull in the activity as convection pushed off to the northeast. PHS and HRRR kept some lingering activity across the area. Instability varied between the PHS showing a continued higher corridor to the west, with the HRRR that had overall lower values on the order of 1000-1500 J/kg while SPC Mesoanalysis kept higher values above 2000 J/kg.
Convection was slightly overdone by both models by this point.

PHS 19:00Z valid for 22:00Z

SBCAPE [J/kg, top left], Layer Comp Ref [top right], 0-3km SRH [m2/s2, bottom left], MRMS Comp Ref [dBZ, bottom right]

1900Z HRRR Valid for 22:00Z

SB CAPE [J/kg, left], 0-3km SRH [m2/s2, middle], Sim Comp Ref [dBZ, right]

22:00Z SPC Mesoanalysis.

SB CAPE/CIN [J/kg, left] & 0-3km SRH [m2/s2 + Storm Motion, right]

22:00Z Summary:

Started seeing both the PHS and HRRR catch up with diminishing trends in convection. SB CAPE lowered per SPC Meso, closer to HRRR/PHS suggested forecast values but the PHS remained consistently high at estimated 0-3km SRH to the SW of the CWA that did not match SPC mesoanalysis values.

PHS 20:00Z valid for 23:00Z

SBCAPE [J/kg, top left], Layer Comp Ref [top right], 0-3km SRH [m2/s2, bottom left], MRMS Comp Ref [dBZ, bottom right]

2000Z HRRR Valid for 23:00Z

SB CAPE [J/kg, left], 0-3km SRH [m2/s2, middle], Sim Comp Ref [dBZ, right]

22:00Z SPC Mesoanalysis.

SB CAPE/CIN [J/kg, left] & 0-3km SRH [m2/s2 + Storm Motion, right]

23:00Z Summary:

Activity started to perk ip along the front to the west, associated with greater forcing while both models hinted at this temporary lull persisting (HRRR being slightly more aggressive with convective coverage). The HRRR started to pinpoint a steady increase in 0-3km SRH to the south reaching around 200-250 m2/s2 but still was shy of PHS forecast values around 250-350 m2/s2. SPC Mesoanalysis continued to show much lower 0-3km SRH.

Total Event Summary

  • Both the HRRR and PHS forecasted lower SBCAPE values than SPC Mesoanalysis data depicted. The HRRR being the lowest on the order of 1000-1500 J/kg. The PHS constantly pinpointed a greater axis of instability to the west reaching 1500-2000 J/Kg while SPC Meso illustrated much more widespread areas of 2000-2500J/kg of SBCAPE.
  • The PHS was much more aggressive with predicting an increase of 0-3km SRH from the southwest with values reaching 250-350m2/s2. The HRRR illustrated this increase, but position was displaced more east and magnitude was much lower in the 100-200m2/s2 range. Both models were considered aggressive compared to SPC mesoanalysis trends showing values ranging mainly around the 100 m2/s2 range.
  • In reality, per SPC Mesoanalysis hourly trends, the lull of activity between 21-23Z could be due to lack of large-scale forcing regardless of the widespread areal coverage of available instability coincided with low values of shear. Greatest forcing was along the approaching front, which increased going into the later hours.
  • Both the PHS and HRRR trends depicted overall slightly greater convective coverage throughout compared to observed, with noticeable differences between the two compared to SPC meso data.
– RED11248

San Antonio Waiting Game

San Antonio: broad cu field is still fighting substantial dry aloft despite extreme instability in the Great Bend region. No notable cooling or anything of note in the OCTANE data. Residual outflow boundary from earlier MCS is acting as a mechanism for a lone strong-severe thunderstorm just north of our CWA. Strong OCTANE divergence and cooling seen along the nose of PHS instability gradient with 3500+ CAPE; shear is essentially zero across this region. PHS composite reflectivity clearly did not forecast this outflow and thus the convection.

2100z: Strong-severe lone thunderstorm with very clear and strong divergence signal in both divergence field and speed fields. Rainbow signal seen in the direction field due to the very limited shear.

Orphaning anvils in the cooling OCTANE fields to the west of the primary convection suggest the PSH fields for instability are just displaced to the east at 2100z.

Nice depiction of the PHS being wrong but right at the same time. Clearly slightly displaced with instability gradient to the east, but accurately showed the single cell or two behavior that we have seen.

Impressive single cell continues as of 2130z, and some notable cloud top cooling and divergence is now seen in the cell to the southeast. Instability axis is clearly ~50 miles to the north of the PHS.


Lightningcast is bullish on both the southeast and south newly developing convection. Very broad contours however, possibly too much false alarm area here (?).

Broad persistent divergence in OCTANE fields in the southern cell. DHX radar shows 50 dbZ core over 30k feet within an extreme instability zone of 4000+ j/kg. Issued a severe

Large jump in cooling seen above the divergence field in OCTANE, expecting further intensification shortly in the next.

DHX Radar Divergence maxing out around ~90-100 knots as of 2150z. OCTANE cloud top divergence is generally sitting between 25-40 knots.

Double Rainbow!

Deep persistent OCTANE divergence in speed and direction, core weakening slightly based on DHX radar but still likely warranted a second warning. No signs of real weakening in any of the satellite products, but radar not quite as tall with 50 dbZ core.

-Hellothere

Application of Octane, LightningCast and GREMLIN across western Maine

Maine has an overall weaker radar coverage compared to many other CWA’s across the CONUS. This made it a great place to test out some satellite convective products such as Octane, LightningCast, and GREMLIN. The first image shows the confidence of LightningCast in the development of thunderstorms across parts of north central Maine. Shading shows >75% confidence of seeing 1 or more lightning strikes within the next hour. This was supported by Octane, which showed increased cloud cooling occurring over this area along with large areas of cloud top divergence. What happened nearly an hour later was for the most part on point. GREMLIN and reflectivity showed patchy storms developing across the region; this was also shown on ENTLN lightning plots. GREMLIN did a great job of highlighting the stronger storms with higher reflectivity although those were lower than the actual reflectivity. The lightning plots showed large clusters of lightning, which was nearly identical to where LightningCast had drawn contours nearly an hour before. Overall, the use of all these products together in my opinion would greatly improve convective forecasting as I feel they work great together. This was once again shown today across Maine by highlighting areas with potential convective development and eventual patches of high density lightning strikes.

-Sven The Puffin

OCTANE CAN ENHANCE SITUATIONAL AWARENESS

 Thunderstorms formed over portions of New England (Maine and New Hampshire) along the periphery of an exiting upper level low. This convection was primarily diurnally driven with a lack of forcing.

With marginal storms that developed I wanted to take the approach that I was without certain data, like some radar tools and probsevere.  There were two storms that were showing a little promise of getting near Severe limits. One storm developed south of Portland in which we warned on which was very close to the radar cone of silence.  A second cell developed further to the west with some dialesing and some poorer radar quality.  When going through the various experimental data since the storms were marginal I attempted to see if I could qualify relative storm intensity with the use of OCTANE.

Below you can make out the first cell which weakened towards Portland, however a second cell has ticked up showing 60 dbz reflectivity for this scan at 21:18z.

I began examining this second cell a few minutes earlier with satellite products.  I noticed earlier with visible satellite data and along with the CTC (Cloud Top Cooling OCTANE product) that there was convective initiation.  But then use of the CTD (Cloud Top Divergence -see purple shading in OCTANE bottom left of 4 panel below) also indicated divergence aloft, and in subsequent scans speed divergence was increasing (upper left panel).  You can make out on the upper left panel the Octane Speed which shows a second area of speed divergence with activity off to the west. I played with the color table to draw out this feature a touch just as the cloud top divergence indication began to increase in order to attempt to see a visual trend.

This was a storm that ticked up briefly.  I pretended that I did not have probsevere, along with radar reflectivity and velocity.  As it turns out ProbSevere did tick up to 20 percent around 21:18z

The decision was made not to warn on this cell.  It turned out to be a good thing as afterwards I inspected various radar features and MESH did not indicate a severe hail threat as it only ticked up to under a half inch.  And radar reflectivity briefly ticked up to 60 dbz but with no velocity core and thus no severe hazard threat.

What OCTANE provided here was a guide as to where to look next.  OCTANE can be helpful, at least it was in this case in terms of where to look next, especially when you get the speed divergence and cloud top divergence (CTD) signatures.  IF speed divergence signatures values decreased (lower down the color curve) on the upshear side of the cell, then perhaps that may have been a signal to warn, but they did not increase and this was the proper decision as available radar tools suggested not to warn on this cell.

– 5454wx

Monitoring Convective Trends across WFO MPX

This scenario began at WFO MPX with a broken line of strong thunderstorms approaching from the west. Many small-scale features were identified using OCTANE and radar trends, with focus on a DSS event ongoing “Fishing Derby” in Wright County, MS.

Doppler radar and Day Cloud Phase Distinction both illustrate new development ahead of the main activity to the west, ahead of an eastward surging outflow boundary. This led to the first DSS notification giving the event a heads up for >30mph winds and lightning in the next 1 to 2 hours. LightningCast was helpful showing probabilities increasing from the west.

One specific updraft noticed around 20:00Z, with the decision for a warning to follow along with 40dbz around 40,000ft ARL. OCTANE products were specifically helpful, especially by modifying the colorbar settings for OCTANE Speed. Decreasing the MAX from 200 to 100 and increasing the MIN from 0 to 15 gave a greater contrast and “bullseye” to help diagnose strengthening divergence.

Several additional DSS notifications were sent to the site to alert them of not only the approaching activity, but how long the activity might last over the next following hour.

A TSTM Wind Dmg LSR followed with this storm that led to an injury.

LSR:  *** 1 INJ *** Corrects previous tstm wnd dmg report from 7 N Hutchinson. Relayed report from sheriffs office of a shed with roof blown off and sides collapsed

Again, OCTANE gave great situational awareness to support alongside with radar to lead to proactive warning decision.

– RED11248