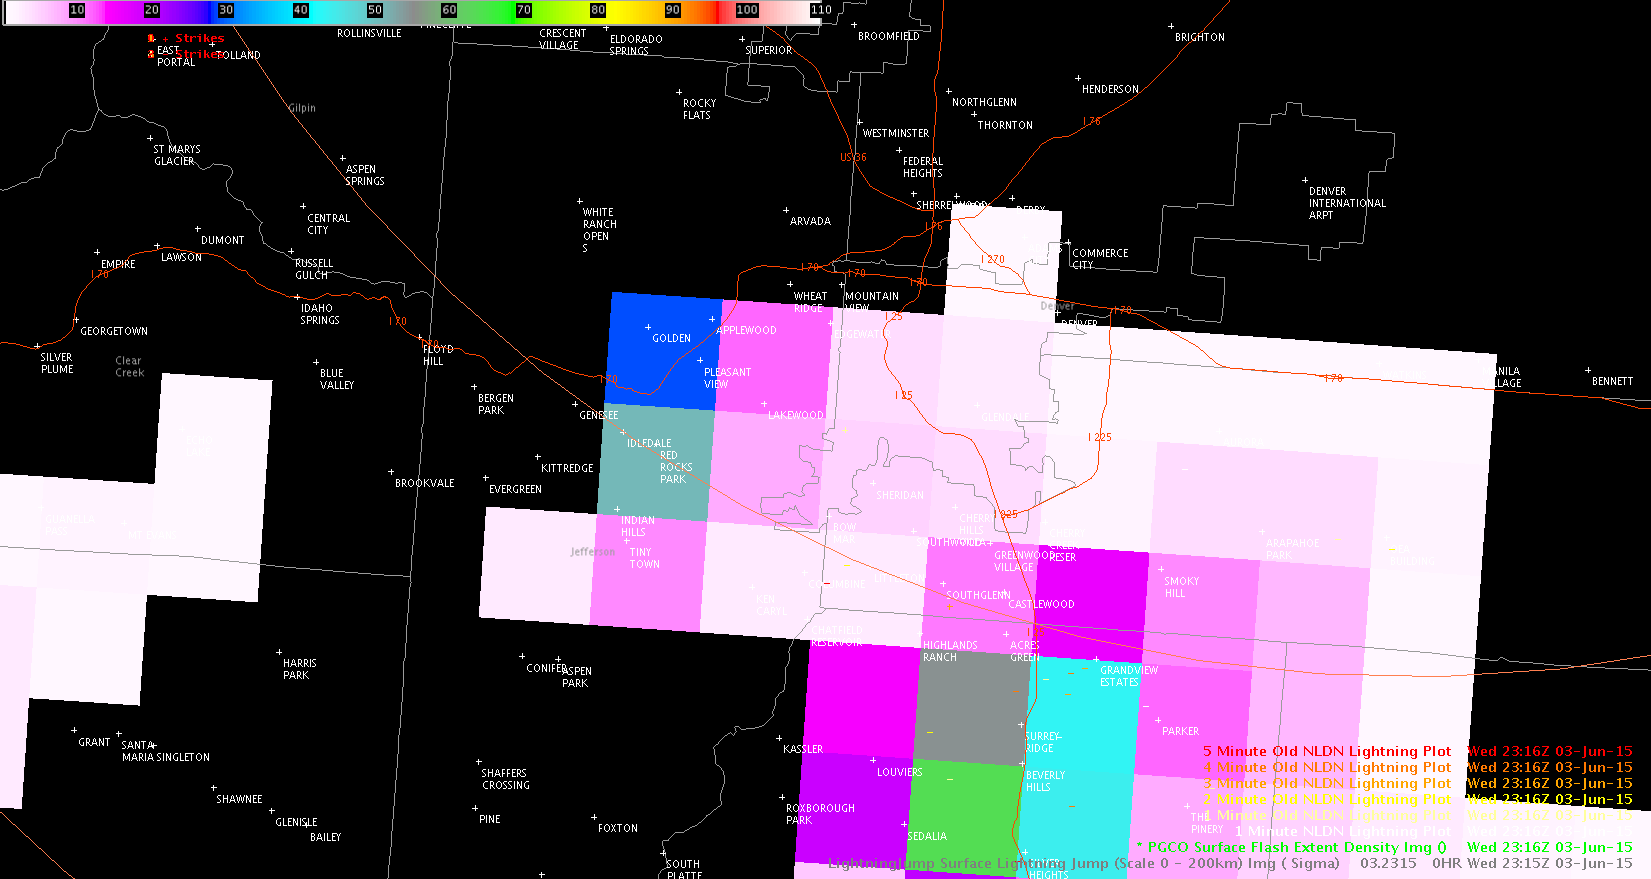
 2317z radar2316z PGLM
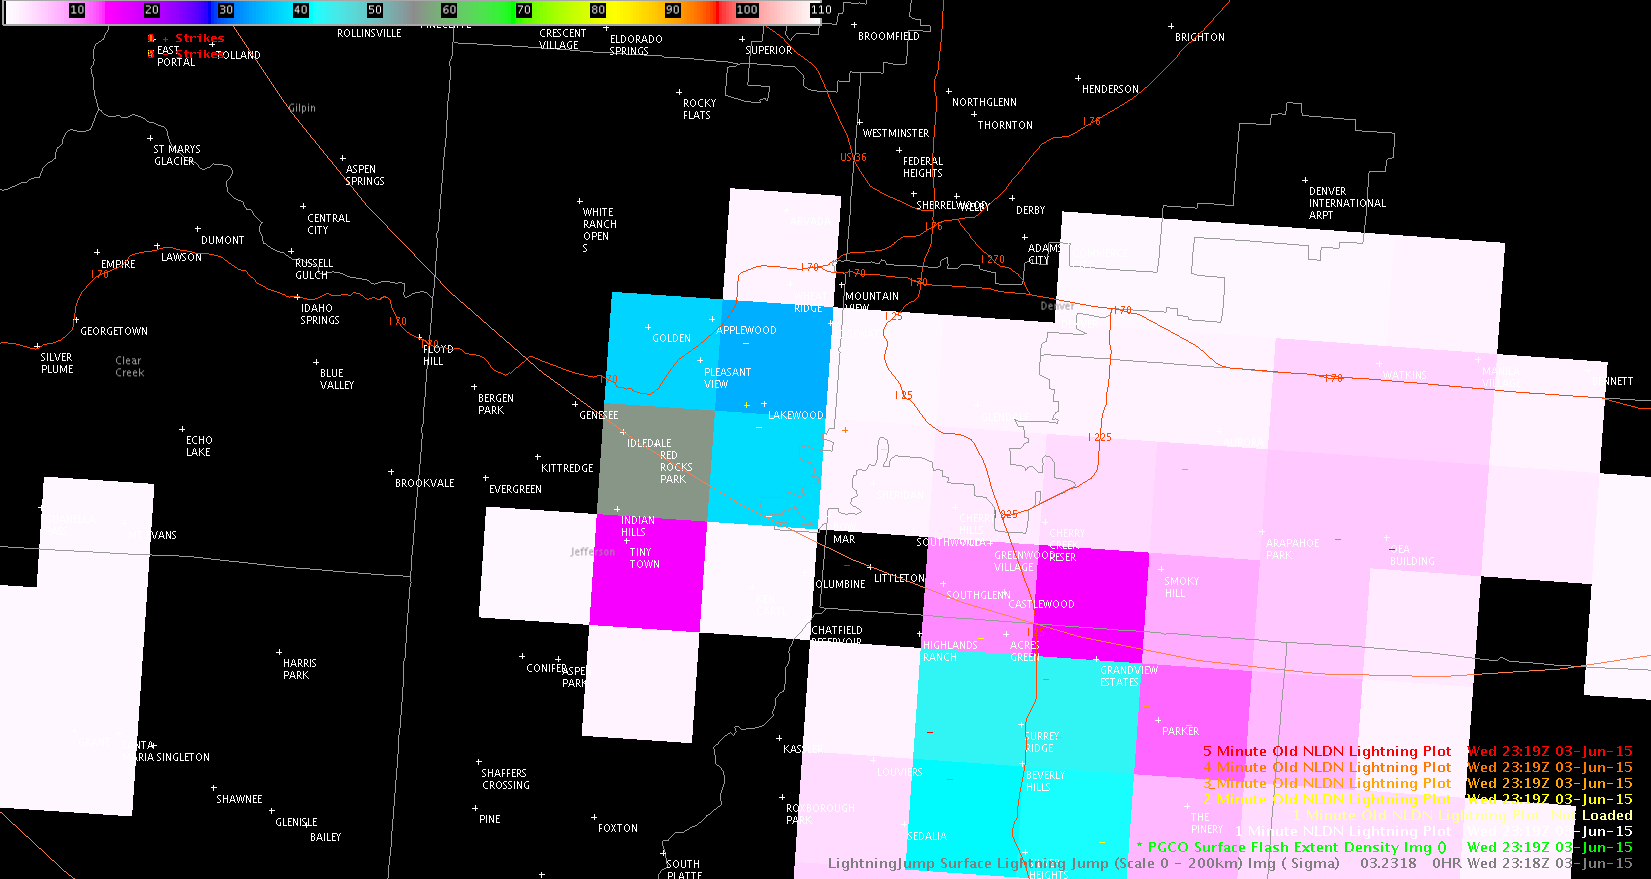 2319z PGLM
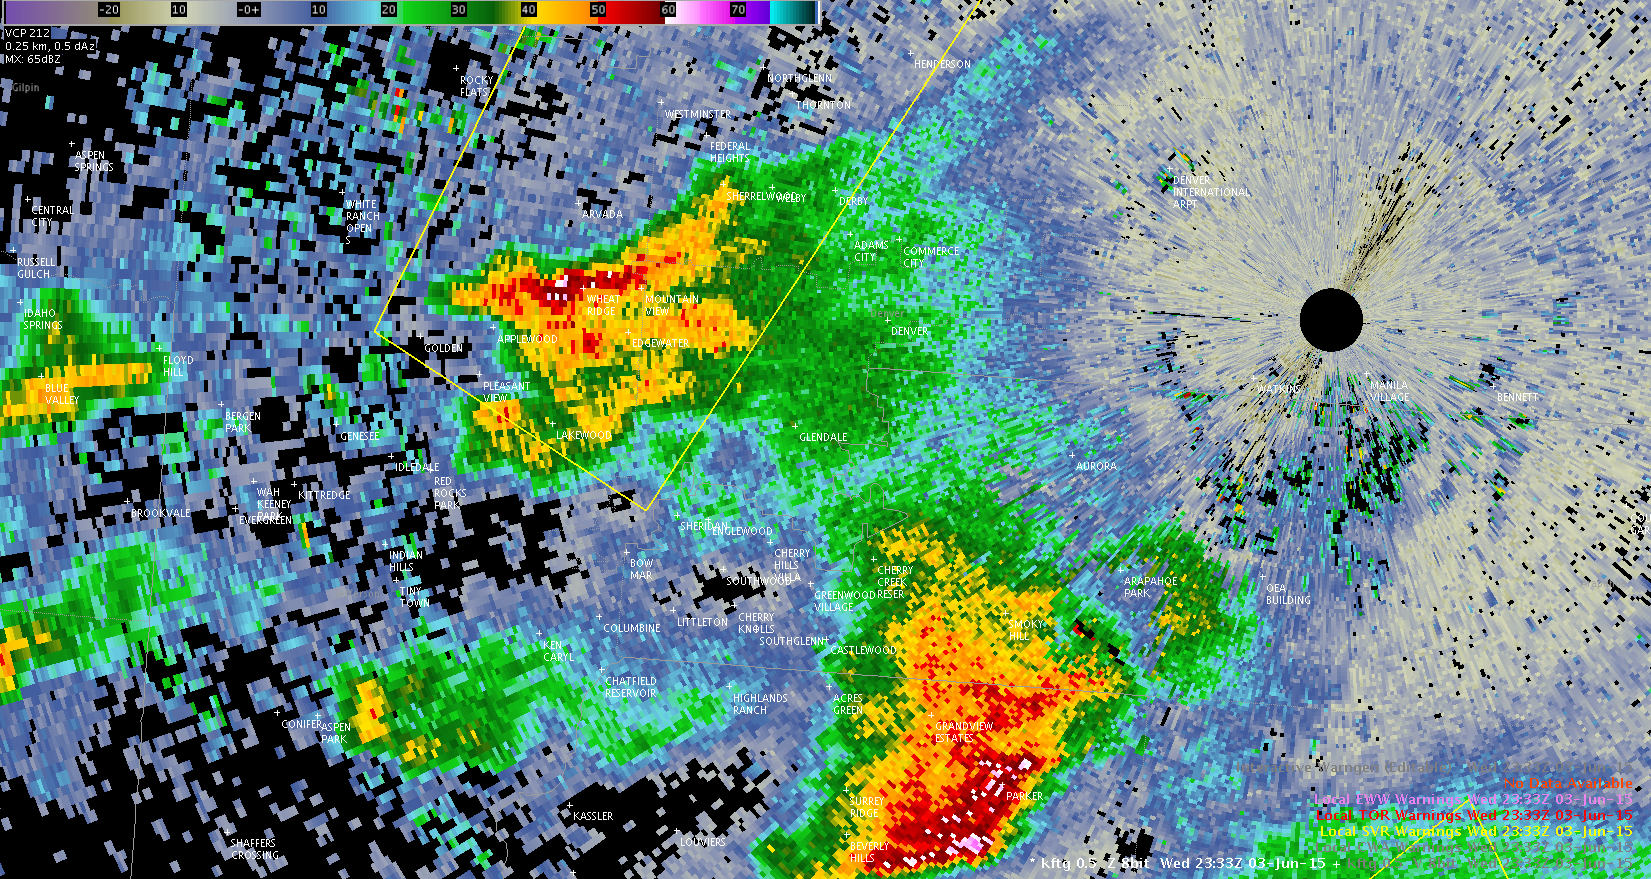 2333z radar
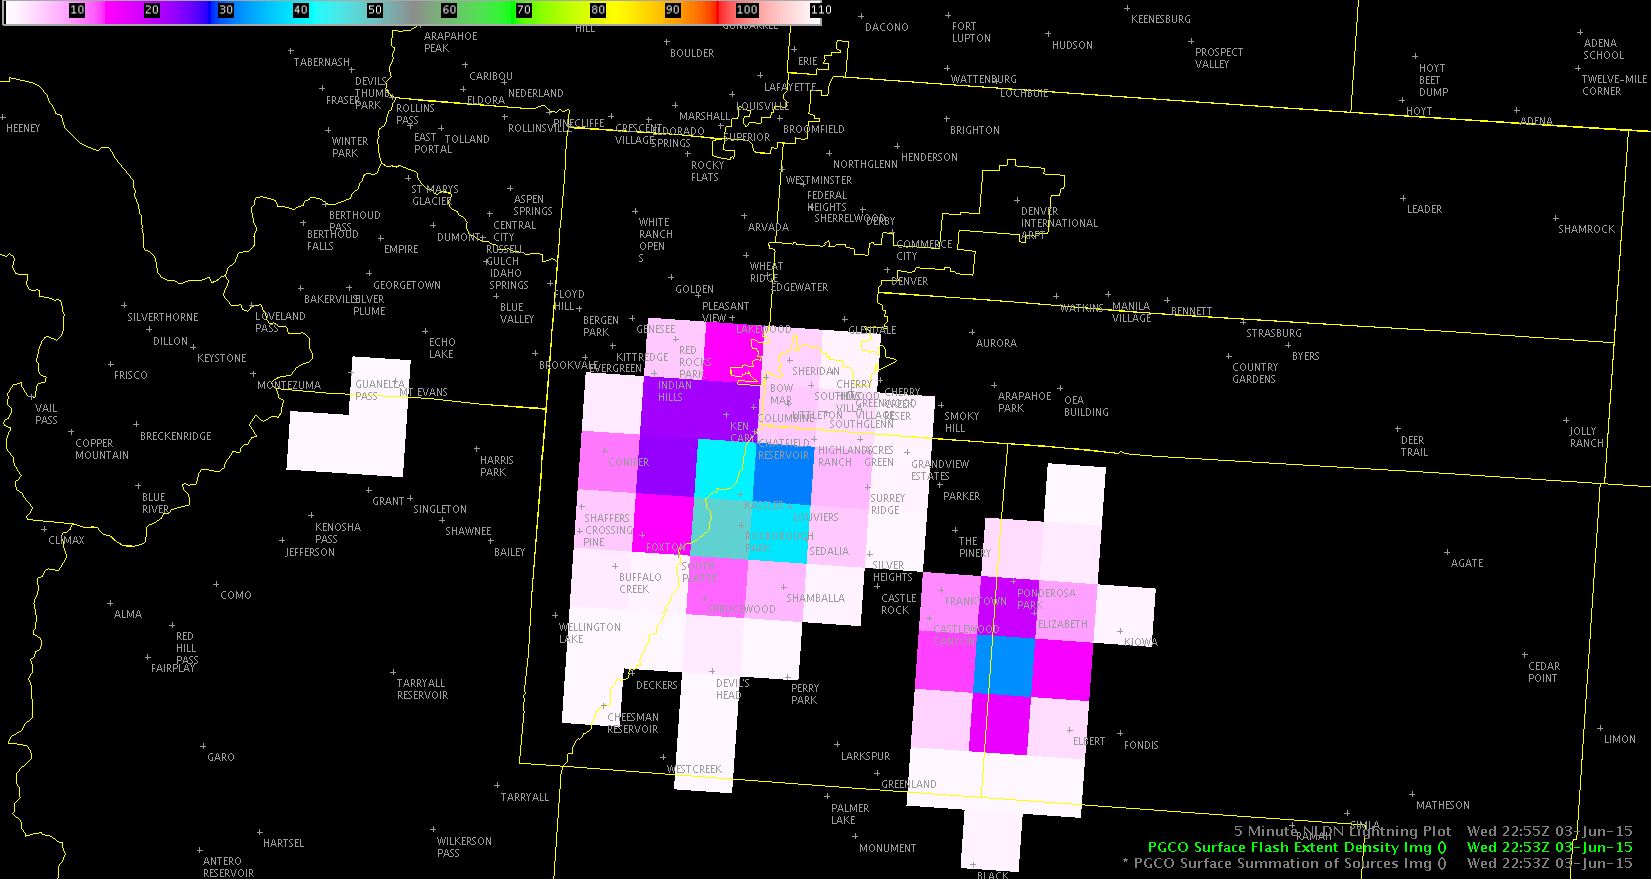
Time series of the northern cell. PGLM had a sharp increase in total lightning over three minutes, strongly boosting confidence to reissue SVR.
Jason Williams
Official websites use .gov
A
.gov website belongs to an official government
organization in the United States.
Secure .gov websites use HTTPS
A
lock (
) or https:// means you’ve safely connected to
the .gov website. Share sensitive information only on official,
secure websites.

2317z radar2316z PGLM2319z PGLM2333z radar
Time series of the northern cell. PGLM had a sharp increase in total lightning over three minutes, strongly boosting confidence to reissue SVR.
Jason Williams
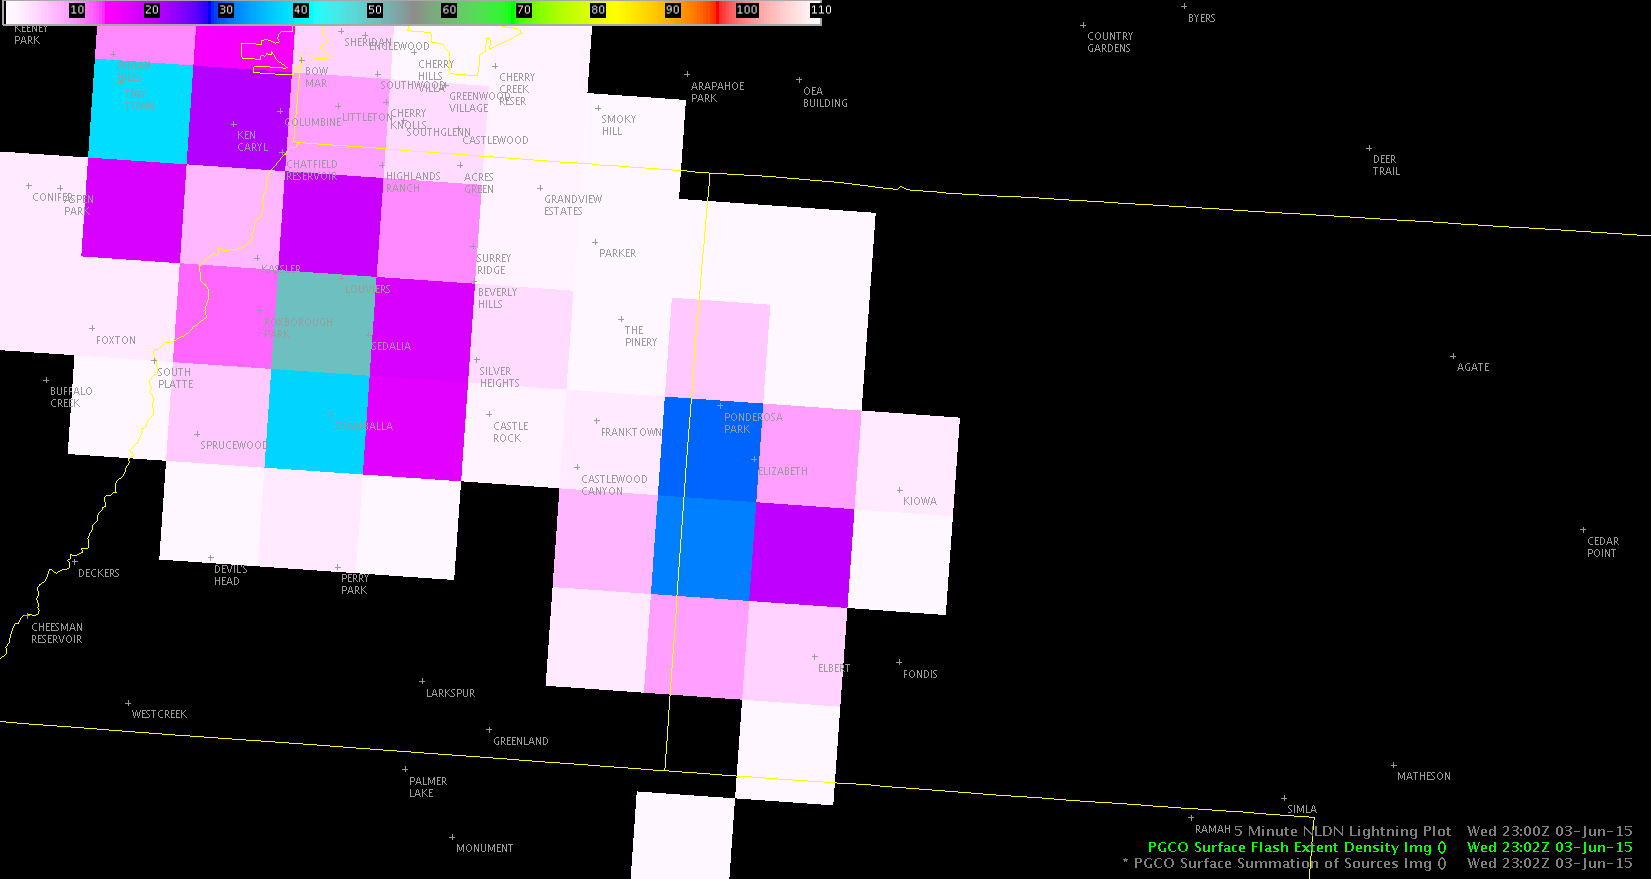
Cell south of Denver had an increase in total lightning (20 to 44). Still waiting for an LSR to see if that intensification resulted in hail reports (there have been a handful from storms thus far). That southern storm had not looked particularly great for a little while but the increase in lightning caught our eye.
Jason Williams
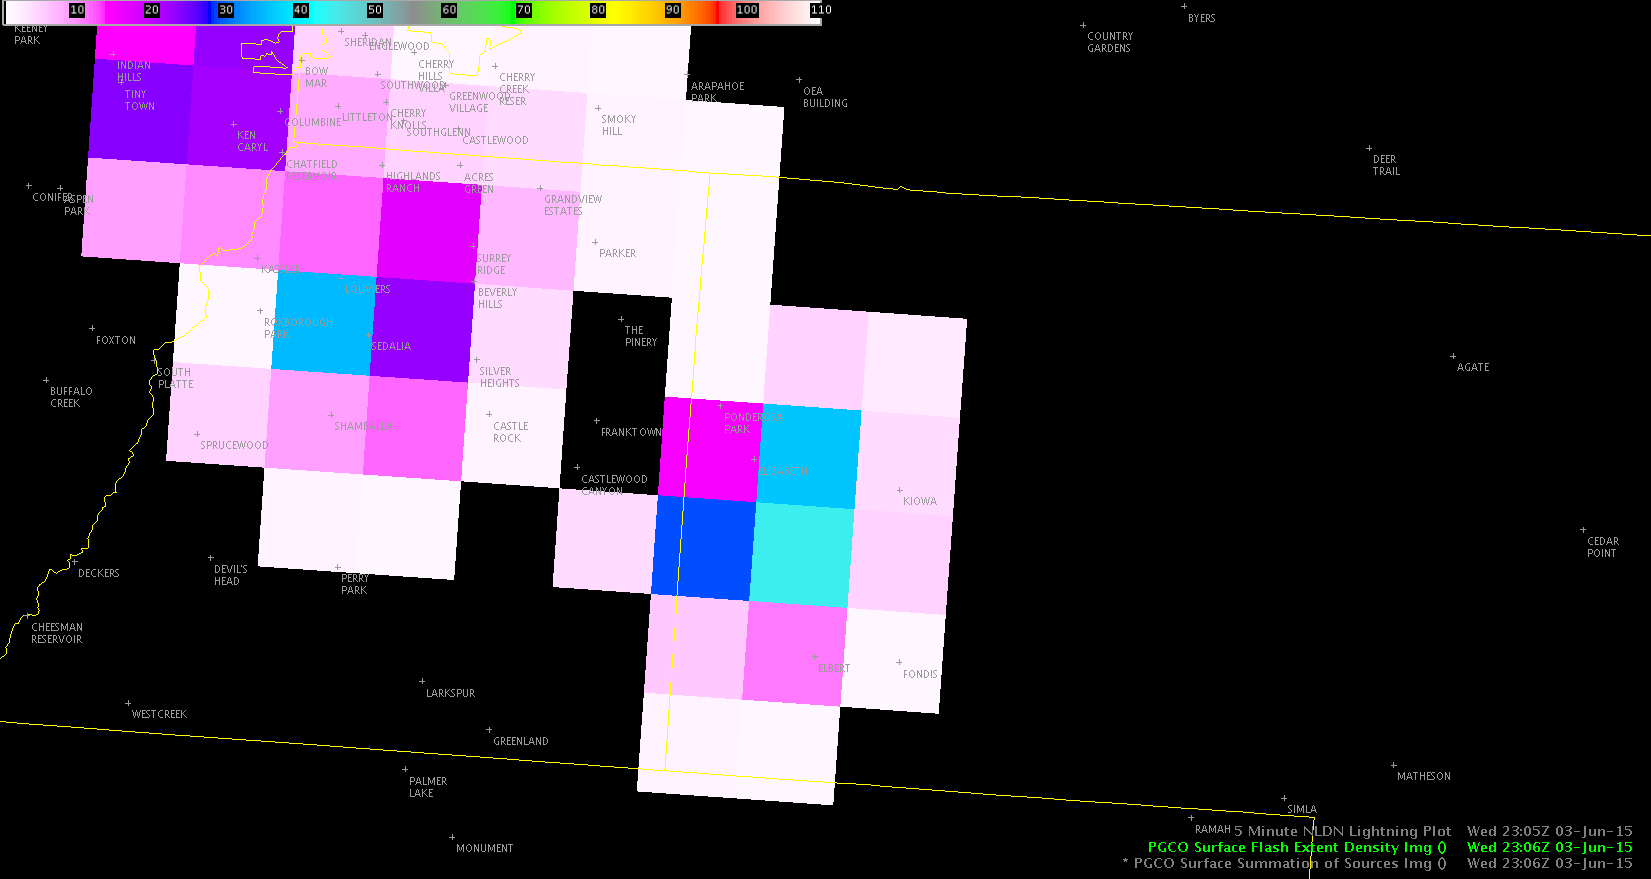
Had a cell split SW of Denver (the larger mass of total lightning; SE of Denver is a separate cell entirely); the northern one had initially had more total lightning, but the southern storm ended up becoming the stronger one. The total lightning dropped in the northern cell while it quickly increased in the southern one. About five minutes later, reflectivity really began to show the intensity increase. Storm chaser video also showed a possible funnel cloud.
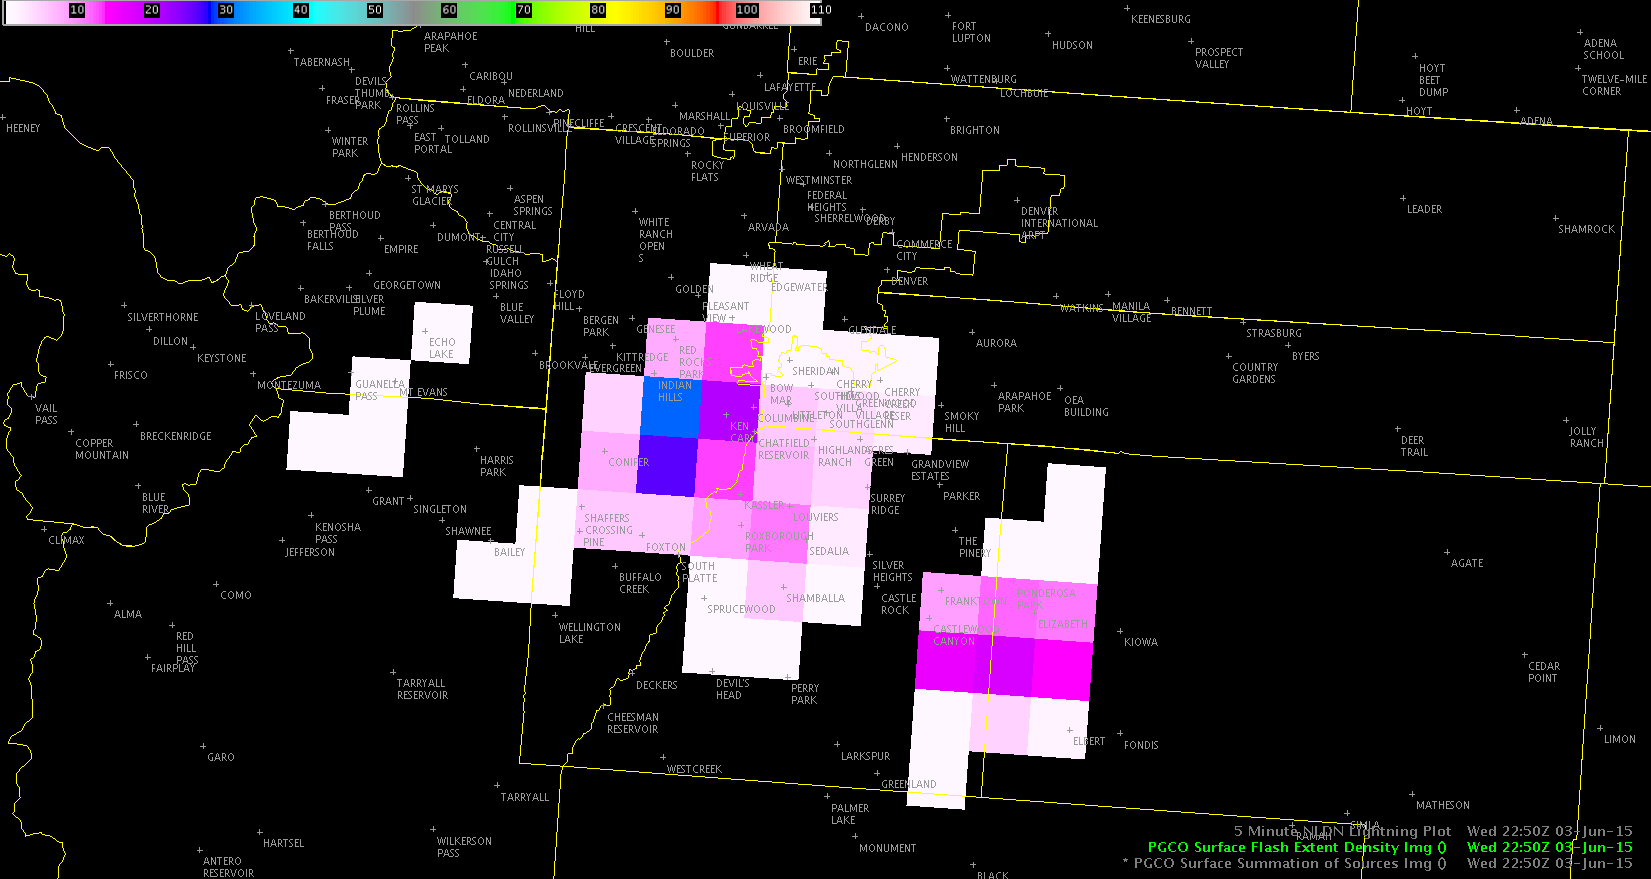
West side of northern storm had new growth that occurred coincident with an increase in the total lightning on the PGLM.
If an area had an absence of 1 min vis imagery, the total lightning data still gives an alert that growth is (re)occurring.
Jason Williams
Click for loop. You can see updrafts go up and goes along with the increase in lightning on the PGLM.
Jason Williams
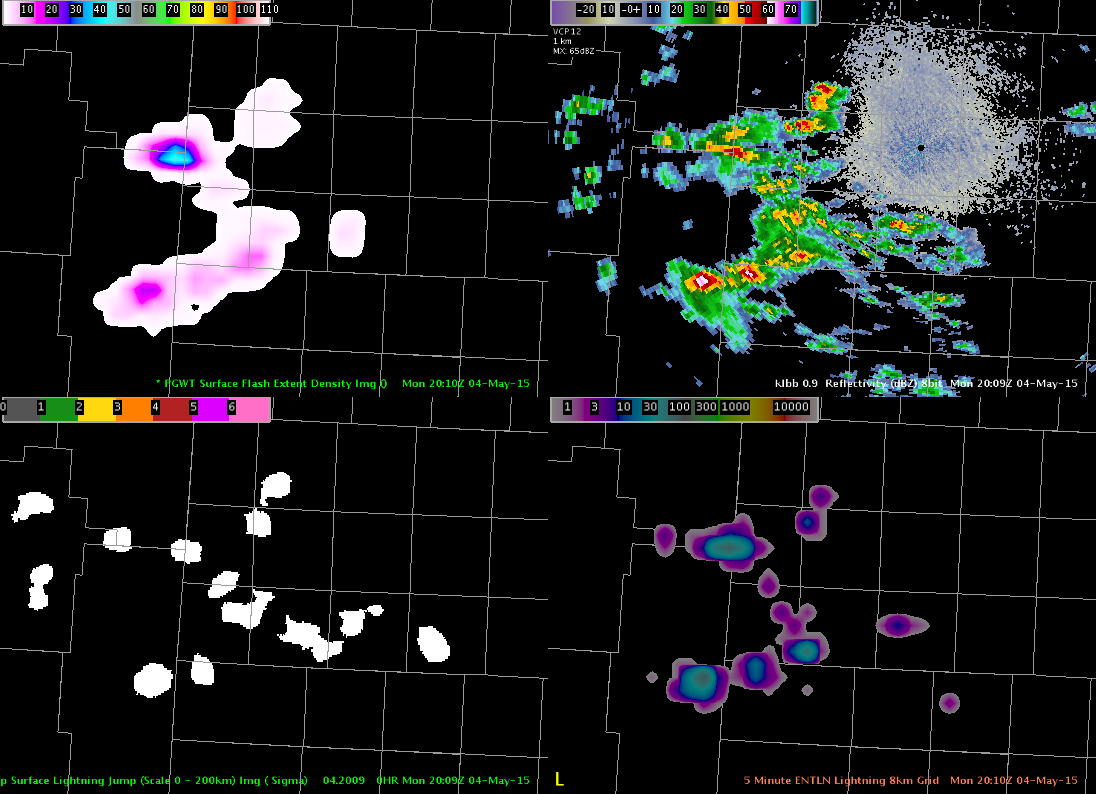
Total lightning has a large role in the Experimental Warning Program this year. We are on day 1 of the first week and everyone is familiarizing themselves with the various products. I have shown an quick comparison of some of the products that we will be evaluating throughout the week.
The storms cooperated by moving into the West Texas LMA domain (Lubbock county warning area) allowing for the first views of the NASA SPoRT pseud-geostationary lightning mapper (PGLM) this year. The image shows the PGLM (upper left), radar reflectivity (upper right), the lightning jump showing the sigma level change using Earth Networks data (lower left), and the Earth Networks total lightning over a 5 min summation and put on an 8 km grid.
The PGLM is showing a maximum value of 41 flashes over a 2 min window with the Earth Networks showing ~40 flashes over a 5 min window. The lightning jump indicated the storm in the north as having a 1-sigma change, which is not enough to indicate severe weather is imminent. The PGLM gives another view of spatial extent of the lightning, which is particularly evident in the northernmost section. The main advantage of Earth Networks is the coverage, unlike the small domains from the lightning mapping arrays that are used to derive the PGLM.