Loaded the one minute SPoRT Flash Extent Density product and used the editable Moving Trace tool. The moving trace circle had to be expanded for each frame; forecasters won’t like this because it doesn’t have a “apply to all” feature for this. It is also not intuitively obvious to forecasters that have been using other tools such as the warngen pathcast tool and distance/speed tool in AWIPS. The trace tool makes a graph showing “Flash Extent Density”, which showed trends in lightning for the selected storm.
 1914 UTC Flash Extent Density. This product could be useful for NWS event support to describe specific lightning threats to outdoor activities. It could also be useful to identify strengthening updrafts that could produce large hail. One storm that showed a quick spike in Flash Extent Density above 50 Lma at 1912 UTC went on to drop 1 inch hail at 1926 UTC, for a 14 minute lead time. See Becca’s blog entry on this storm.
There were several bad one-minute data samples caused by loss of input data into the Oklahoma LMA. Two of them are illustrated below.

 One minute Flash Extent Density showing the sharp drop that was apparently the result of a temporary loss of input data into the Oklahoma LMA. This occurred again at 1948 UTC see the trace graph below.
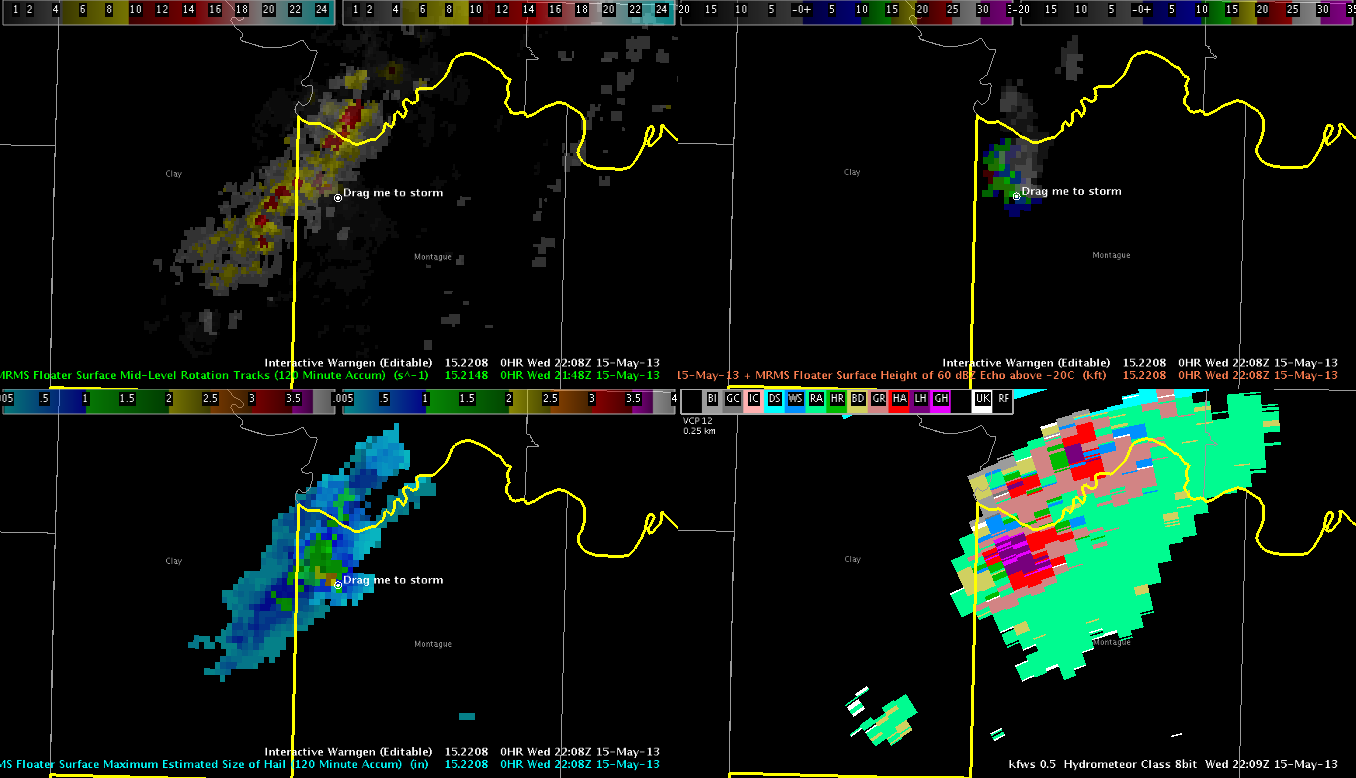
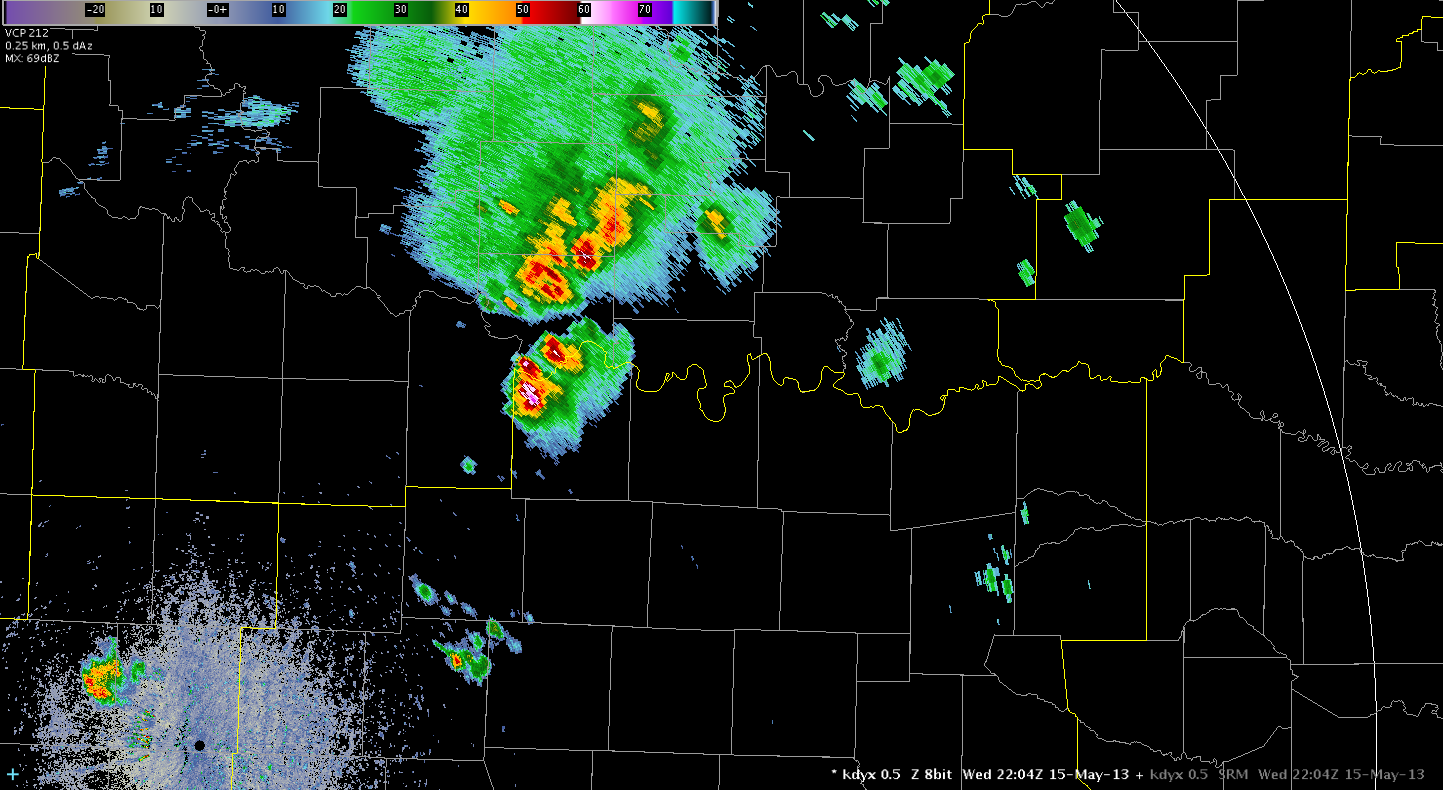
 Warning operations began with a series of small mesocyclones, the first of which had a small hook echo. Tornado warnings were issued for three storms. A 0.5 slice of the OUN R/SRM was primarily used for storm interrogation and the 30 minute Oklahoma Surface and Mid-Level Rotation Tracks were used to see the right-turning trend for meso paths.


Top image showing OUN reflectivity of the first tornado-warned storm. Bottom image is OUN SRM showing another tornado-warned storm’s meso circulation.
The trends shown on the rotational track products helped in narrowing the tornado warning polygons and thus minimizing the false alarm area for the tornado warnings. The surface rotation track was also used for evaluating whether a tornado warning would be needed for southern Jefferson County as a tornadic supercell moved parallel to the Red River. It also was a great way to show the cyclic nature of this meso.
 MRMS Sfc Rotation track showing the redevelopment of the mesocyclone further east. The loop of this product helped save a false alarm tornado warning for Jefferson County. The rotations along the line of storms were also shown, but the entire line was plotted in sequence, which avoids a noisier picture of the track. See image below.

Another interesting thing noted with the rotational track algorithm was the inclusion of a rotation signature with range folded/improperly dealiased velocity data.

 These images are from around 0050 UTC 16 May, showing an area of range folding and bad velocity data that was plotted as an area of rotation by the SRT.
– Ostuno


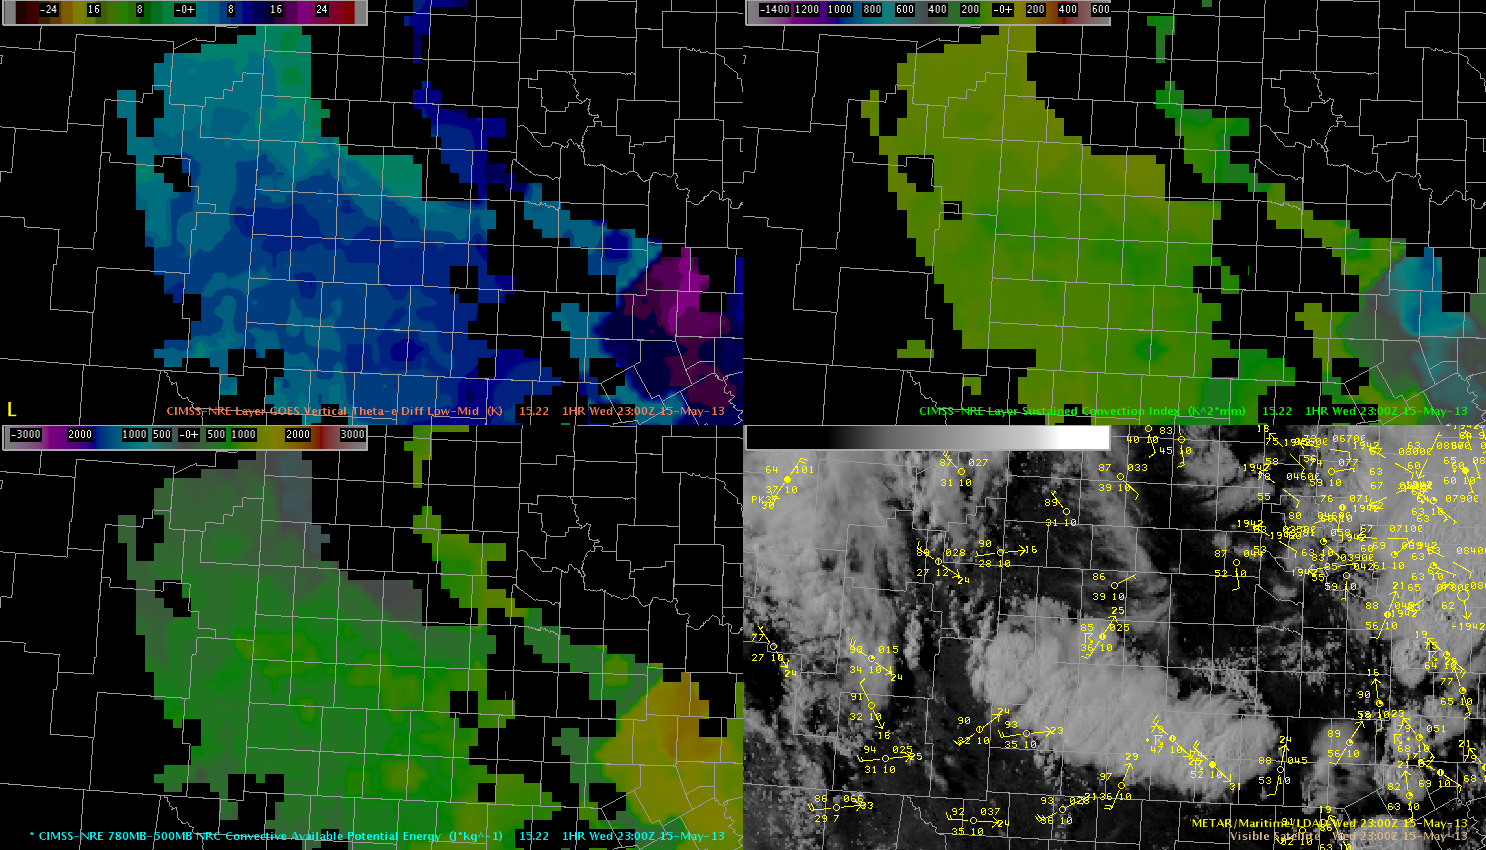
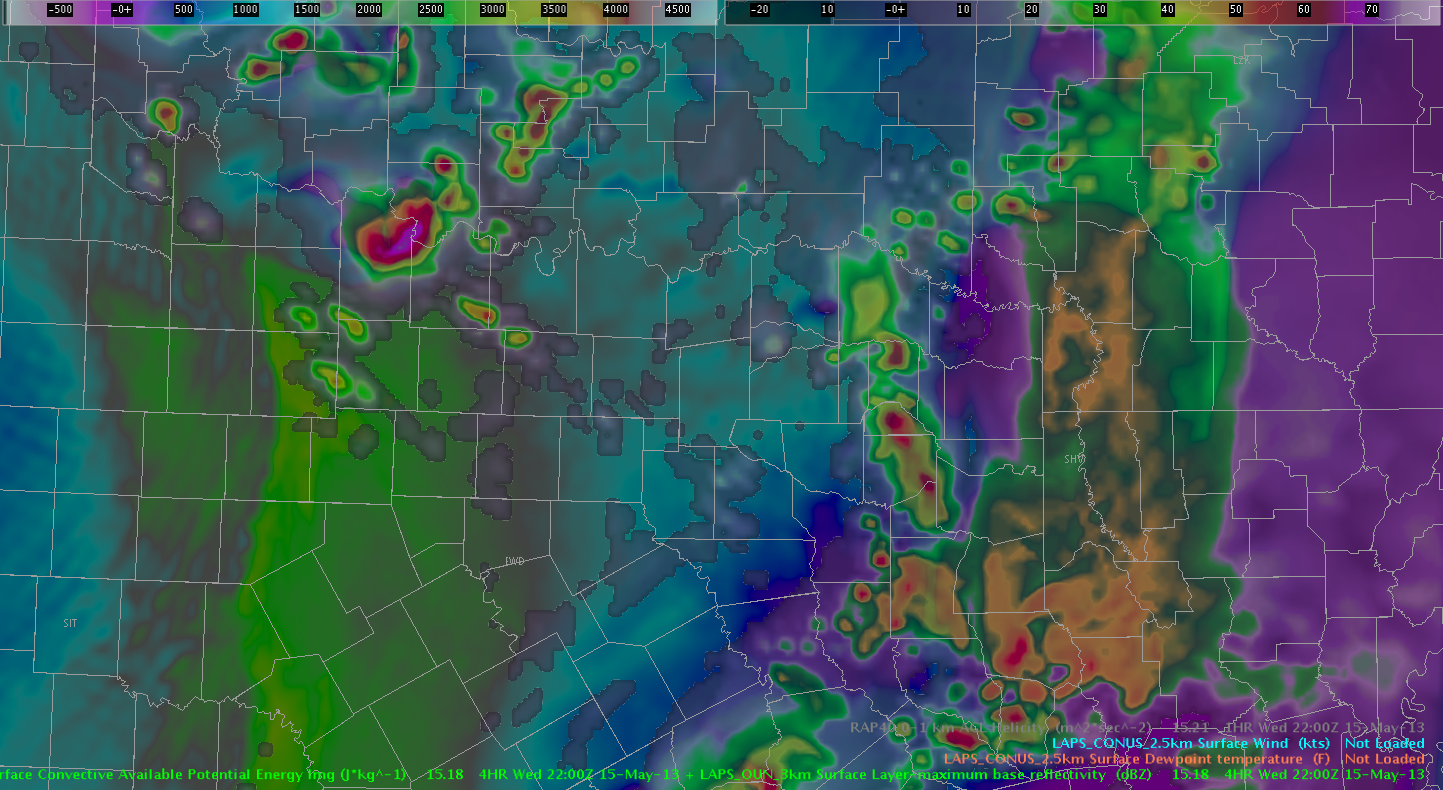
 Isolated thunderstorms have developed in the Vertical Theta-E Difference Low-Mid maximum, east of the dryline, across the north half of Texas, just west of I-35 around 23 UT.C This product may be a better indicator of moist convection east of the dryline then the dryline itself.
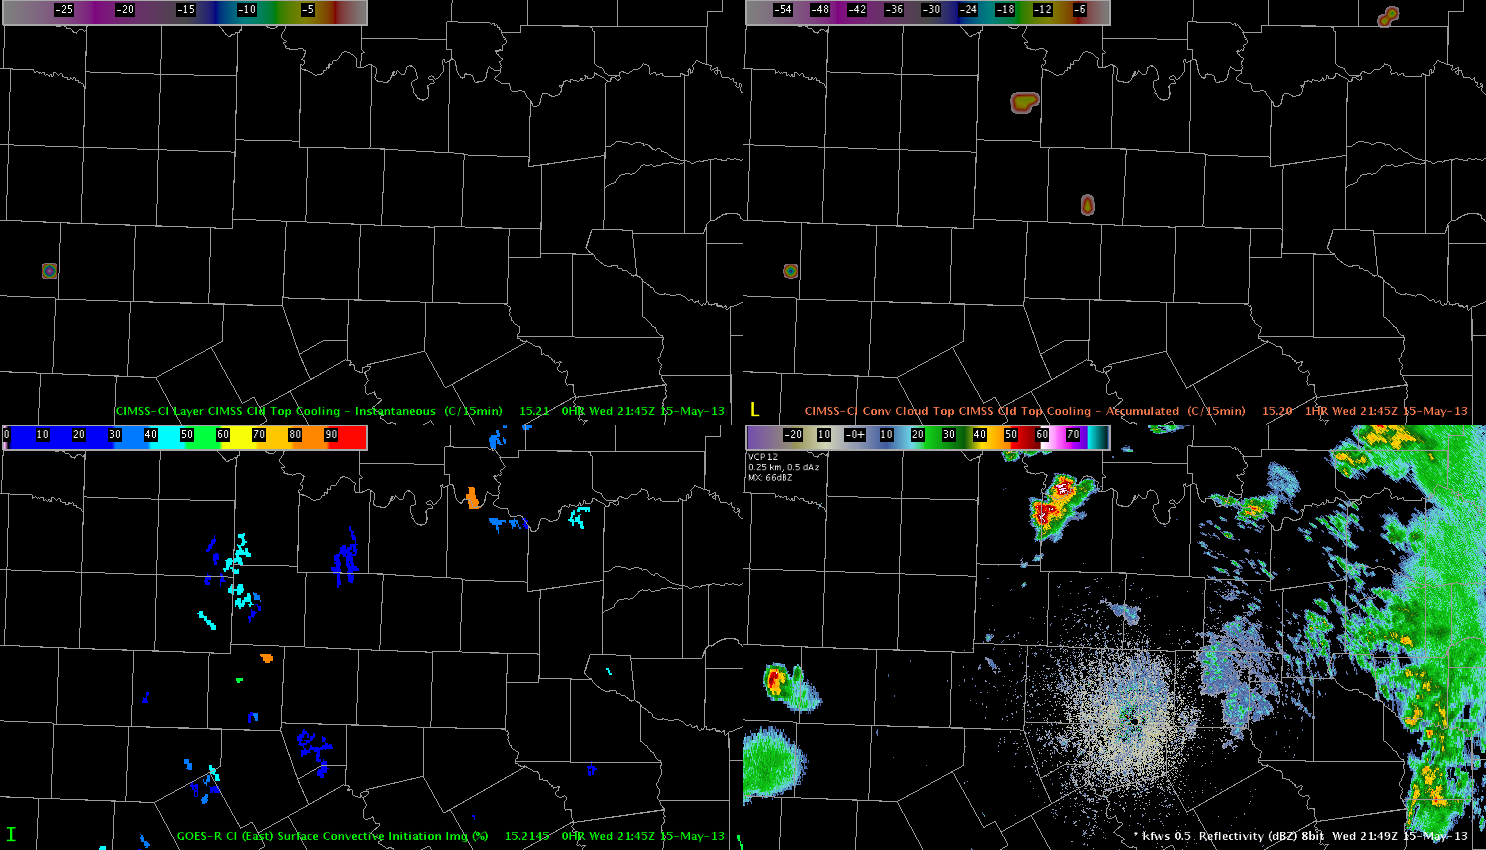
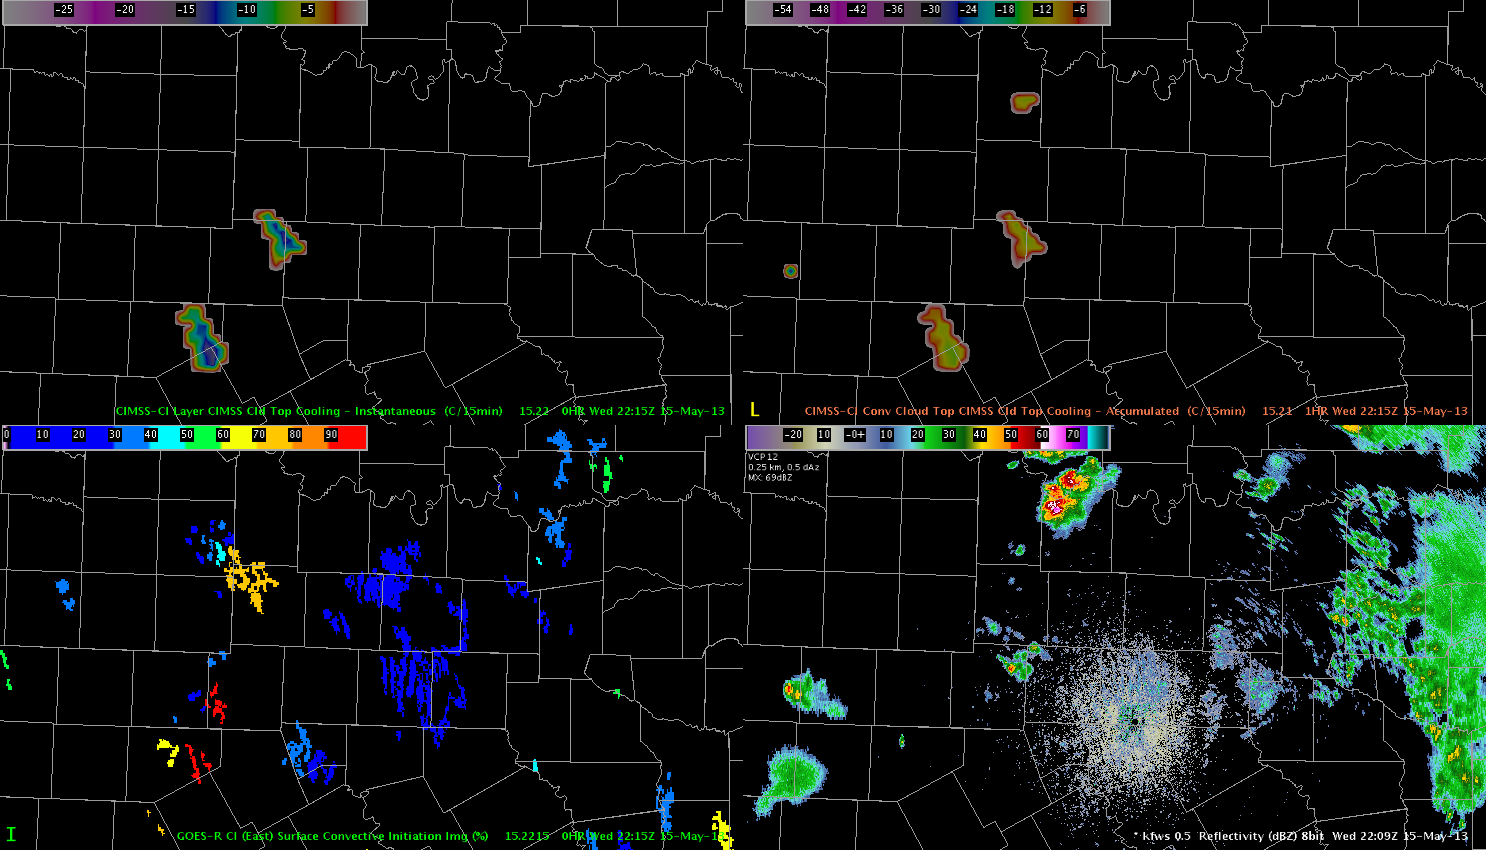
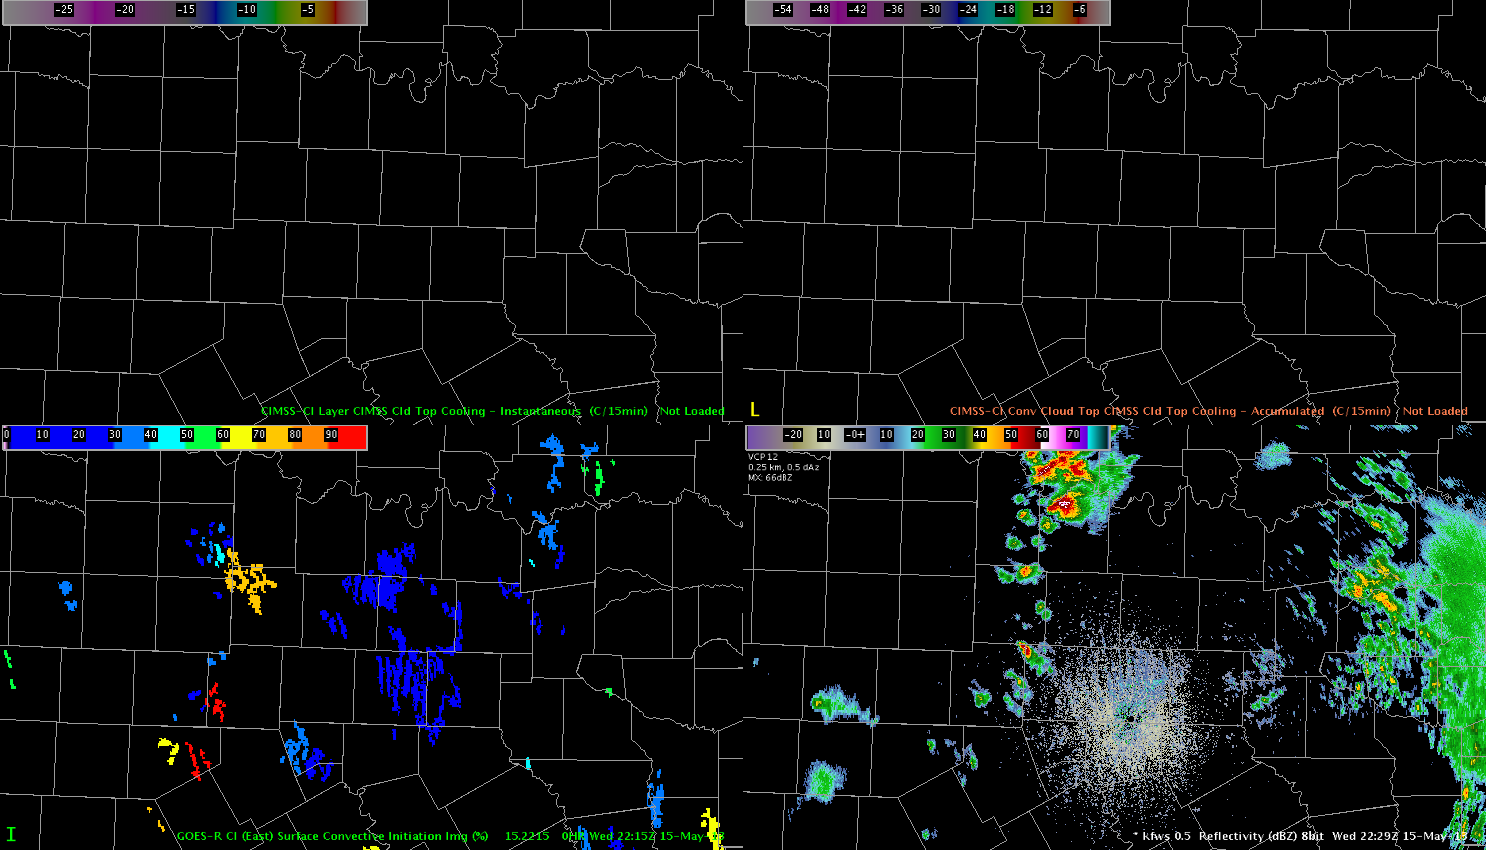
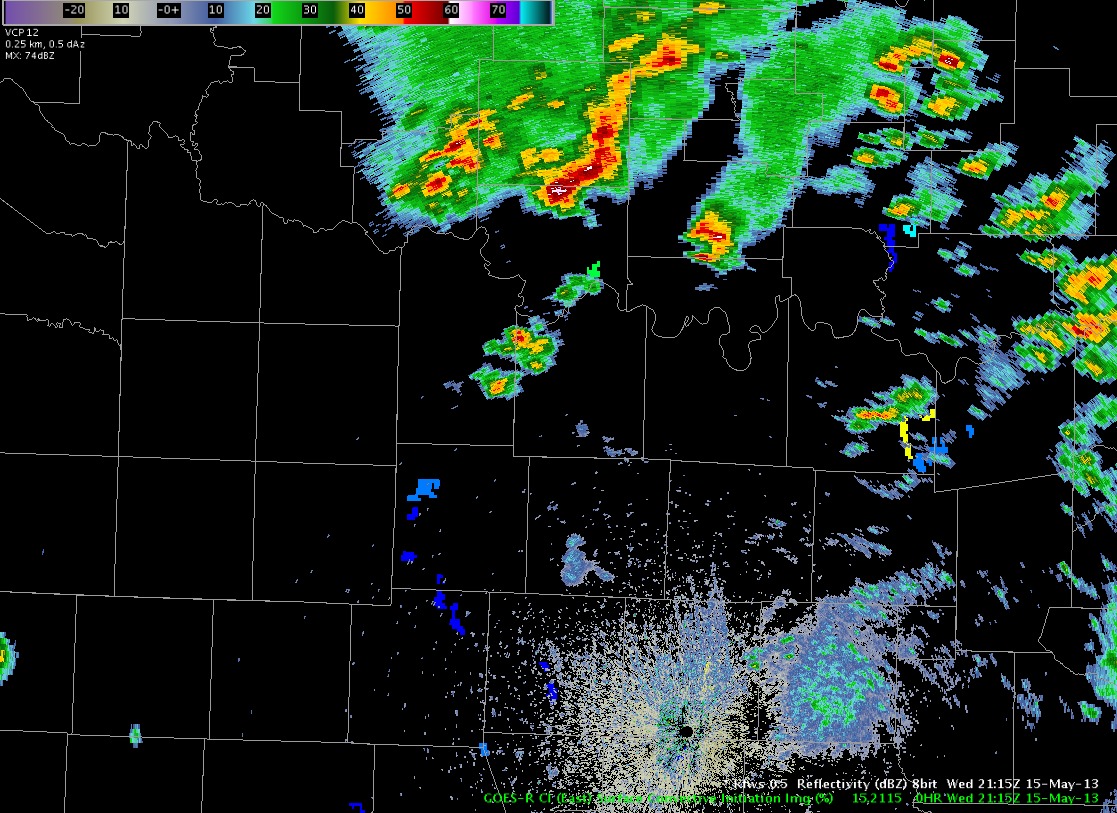
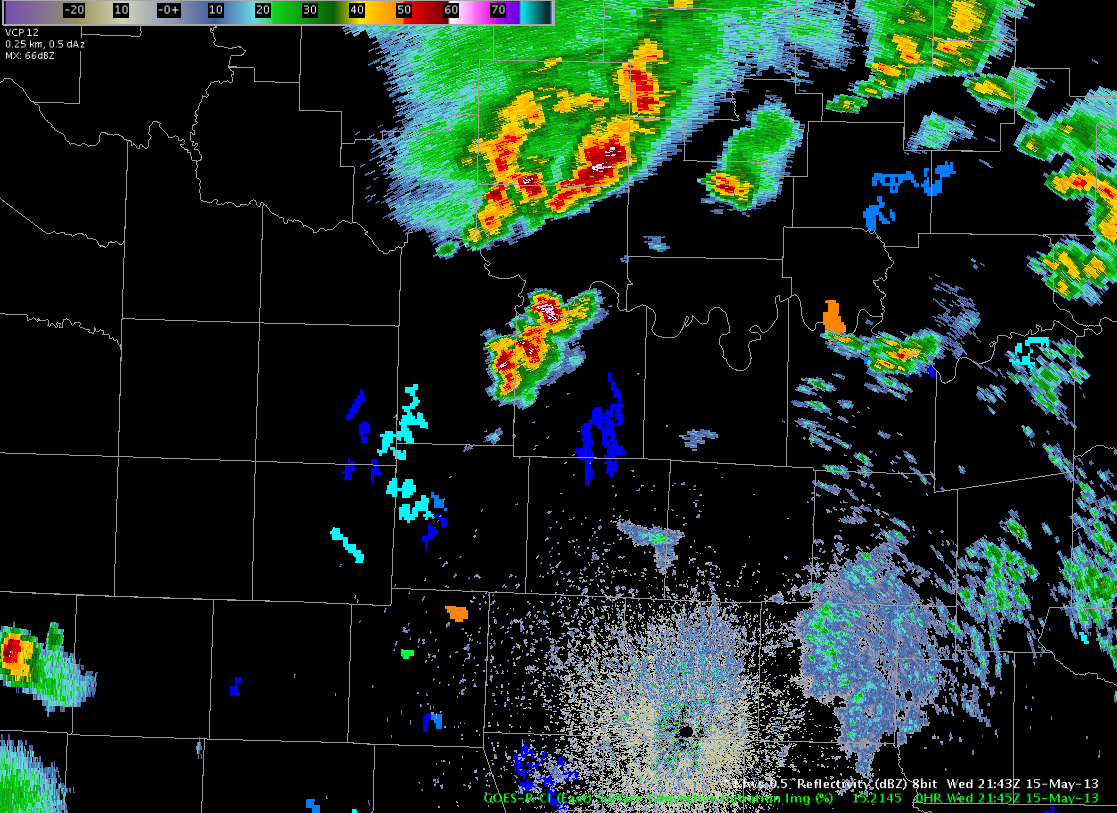
 The GOES CI product detected a 60% yellow area at 2045 UTC. By 2115 UTC, a thunderstorm had developed in this yellow area. This storm strengthened and prompted the issuance of a Severe Thunderstorm Warning by 2205 UTC. Baseball hail was reported by this storm at 2212 UTC, and a tornado was observed around 2242 UTC. The CI product gave about 20-30 minute lead time for storm development, 75-90 minute for severe weather, and nearly 120 minutes of lead time for the weak tornado.