Flash rate jump and high reflectivity/TBSS in Montana

lightning_radar_2218z lightning_plot

Our (likely) hailer in the southern BYZ CWA had a pretty big jump in flash rate. Big TBSS showed up at 2206z as the first climb in lightning rate occurred – although maybe this first climb was an artifact of the dubious lack of lightning noted in my previous post. That said, I don’t think it accounts for all of the increase – the updraft really cranking up is evident on NEXRAD, too. The two in tandem were good for increasing confidence in a warning.

Jason Williams


Tags: None

ENI lightning in southeast Montana

eni_2201z radar_2159z

We have a high reflectivity thunderstorm southeast of Fort Smith, MT, but the ENI data is at a Thunderstorm Alert. There’s almost certainly more lightning occurring with this storm (it has 60dbz at 22,000 ft AGL), but the lightning detection efficiencies in this part of the country is down around 40-50%. Certainly a caveat to keep in mind – its helpfulness is somewhat in limbo in warn/no warn confidence in a sparsely populated area since the chances of a svr report are low. Positive thought: trends can be helpful when lightning is being detected, even if its value is lower than in reality.

Jason Williams

Tags: None

More thoughts on LAP CAPE in Montana

radar_LAPS_2035z radar_LAPS_2119z

Above are radar images from BYZ at 2035z and 2119z, on top of LAP-derived CAPE (valid at 2000z). Convection that began to develop in a local min of CAPE quickly intensified as it moved into a local max. Again, the LAP-derived CAPE seems to be doing very well in assisting with short-term trends.

Jason Williams & John Pendergrast

Tags: None

CI performs well on new Montana convection

CI_2020zradar_2027z

radar_2049z

CI product at 2020z climbed to 50% for the clouds south of BYZ. At 2027z, radar showed most of that zone had low reflectivity, with the exception of a northern cell that was resurrected from previous convection. However, by 2049z, much of the area that CI had indicated as a max had convection. Spatial area was very good!

Jason Williams

Tags: None

Low CI verifies

CI_2000z CI_2036z

What looked visually like a potential source of a future storm in the south-central BYZ CWA was pegged by CI at 17% at 2000z. It never went on to develop and totally lost a CI value by 2036z.

There are increasing values of CI to the west, however, where LAP also indicates higher instability.

Jason Williams

Tags: None

Radar evolution compared to LAP in Montana

LAPS1_1810z LAPS_1850z LAPS_1948z LAPS_2015z

The four images show the progression of the storm cluster in the BYZ CWA in relation to the GOES LAP CAPE (upper-left panel). The storms appear to have intensification as they move NE; while one could look at the better proximity to the radar for this, the increase in lightning would suggest that there was indeed intensification (see previous post on lightning rate).

The northern end of the line has become stratiform and has been completely without lightning since 2011z; the southern cell started losing lightning at about that time and has since had very little (if any) on the one-minute ENTLN data. The ENI DTA went away at 2023z and no alert boxes have been present since then.

It appears the LAP CAPE product performed well in relation to how the storms evolved as they moved NE.

Jason Williams


Tags: None

ENI lightning plot

d2_eni_4panel_1954

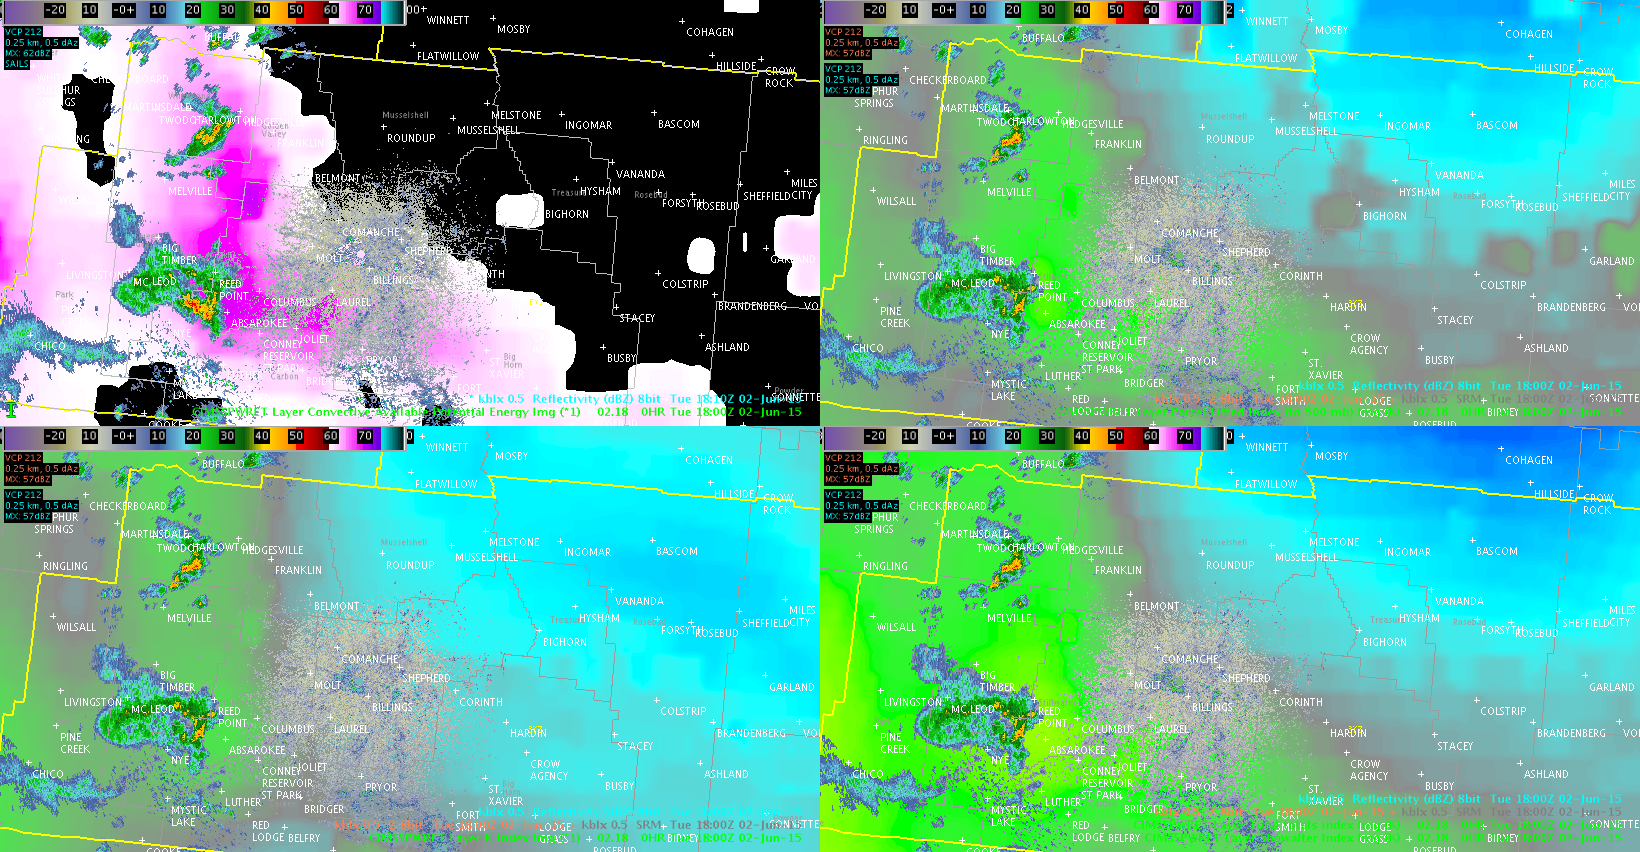
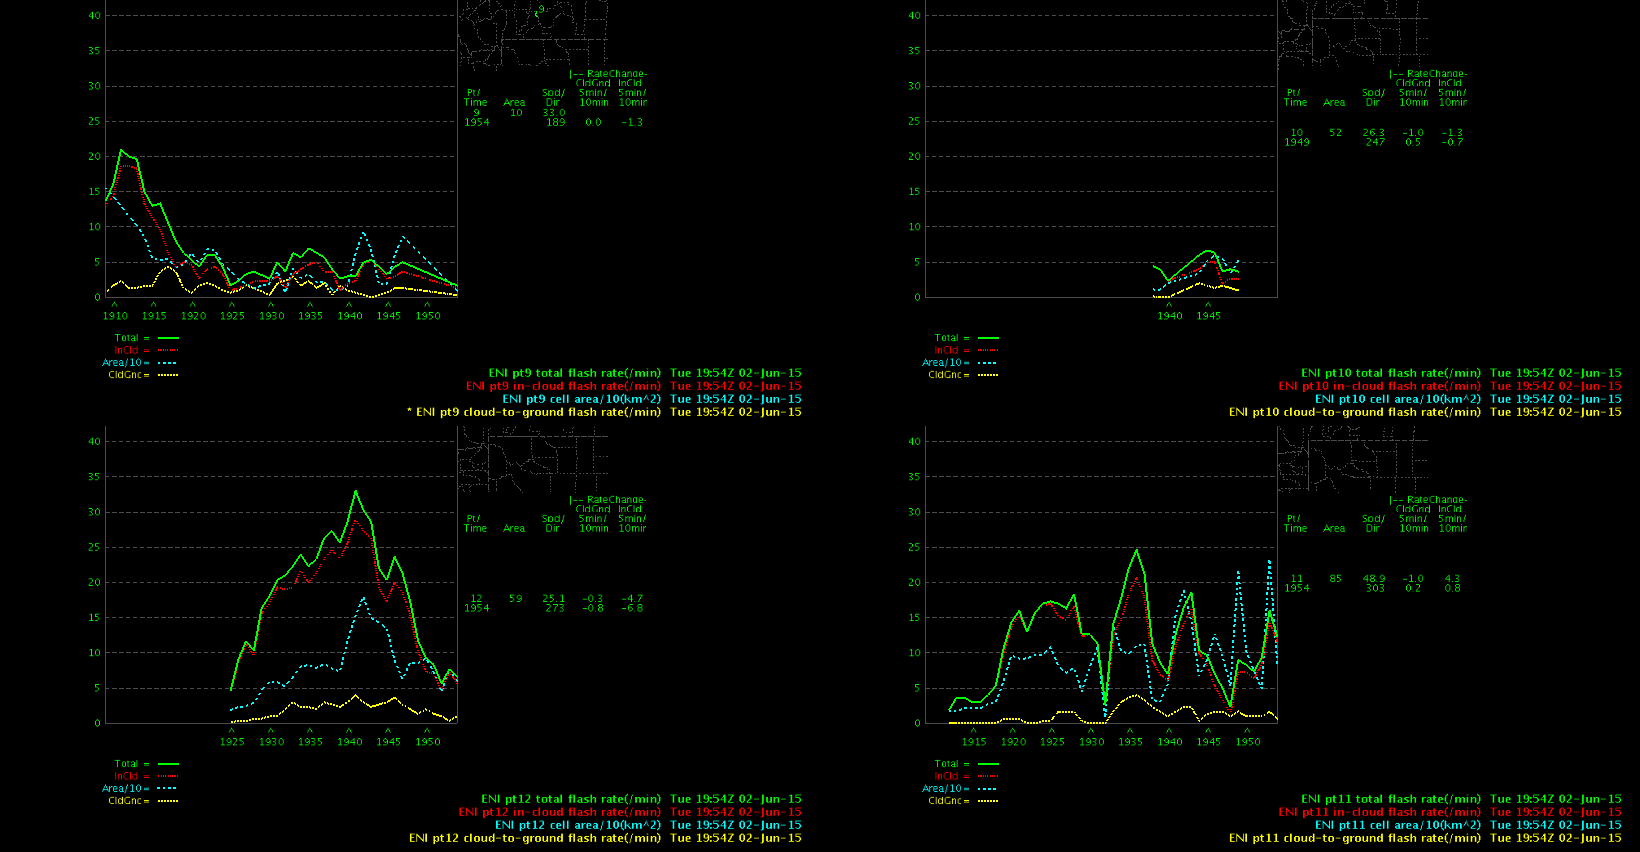
There were four ENI cells moving into the BYZ area, so I did a timeseries on each. The lower-left panel, #12, was on the southern part of the storm cluster. It went on to produce dime-sized hail at 1947z, while the northern parts of the cluster did not have any LSRs (as of 2000z).

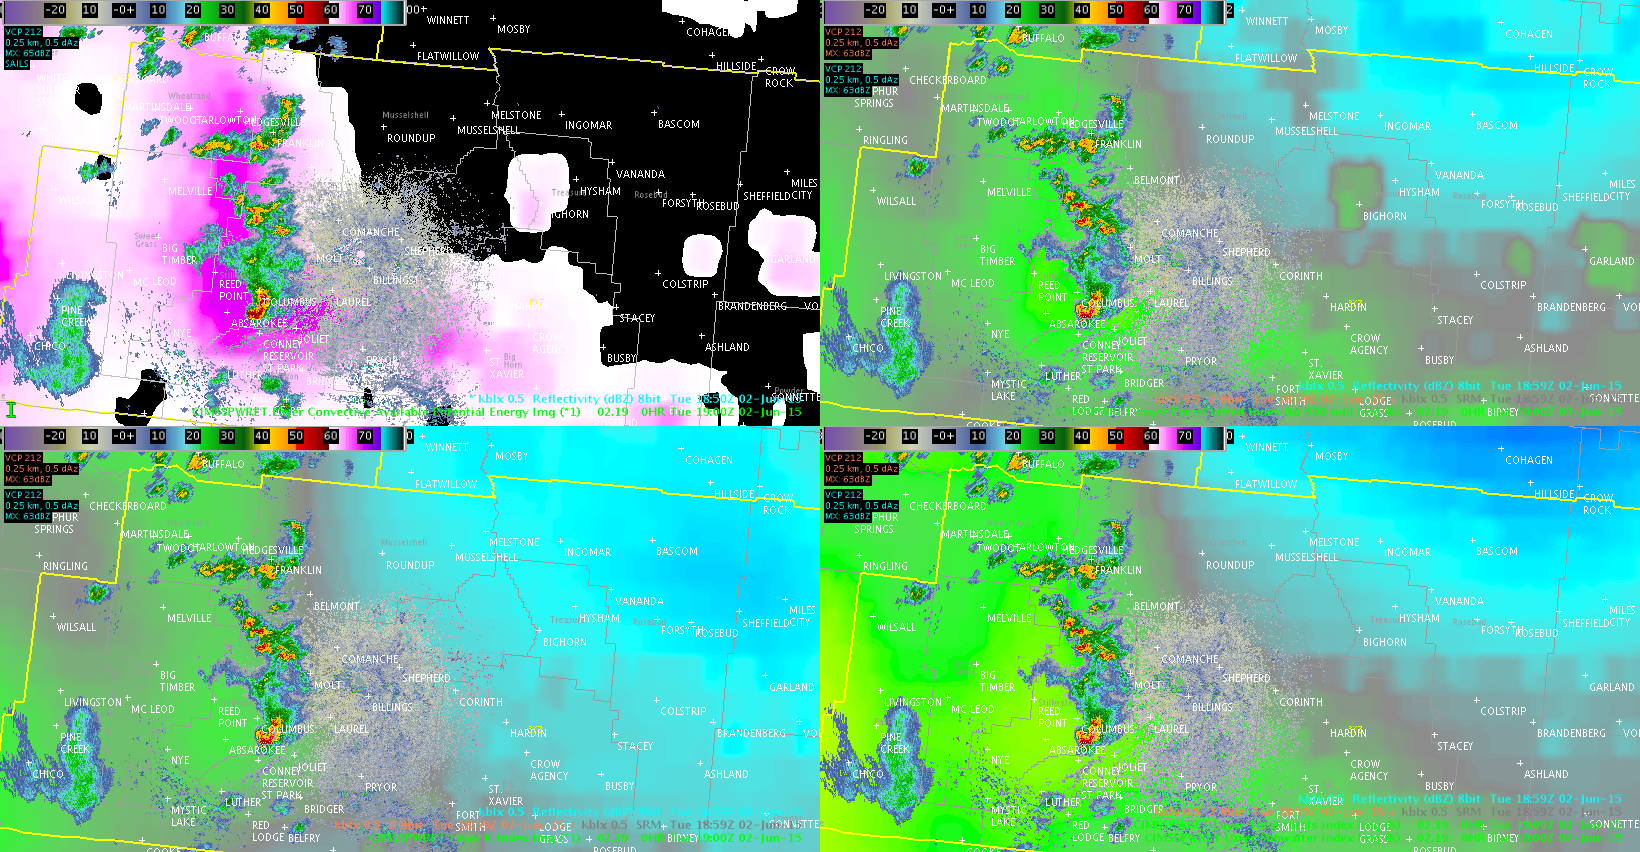
The flash rate of this southern storm really increased, peaking at about 1940z.

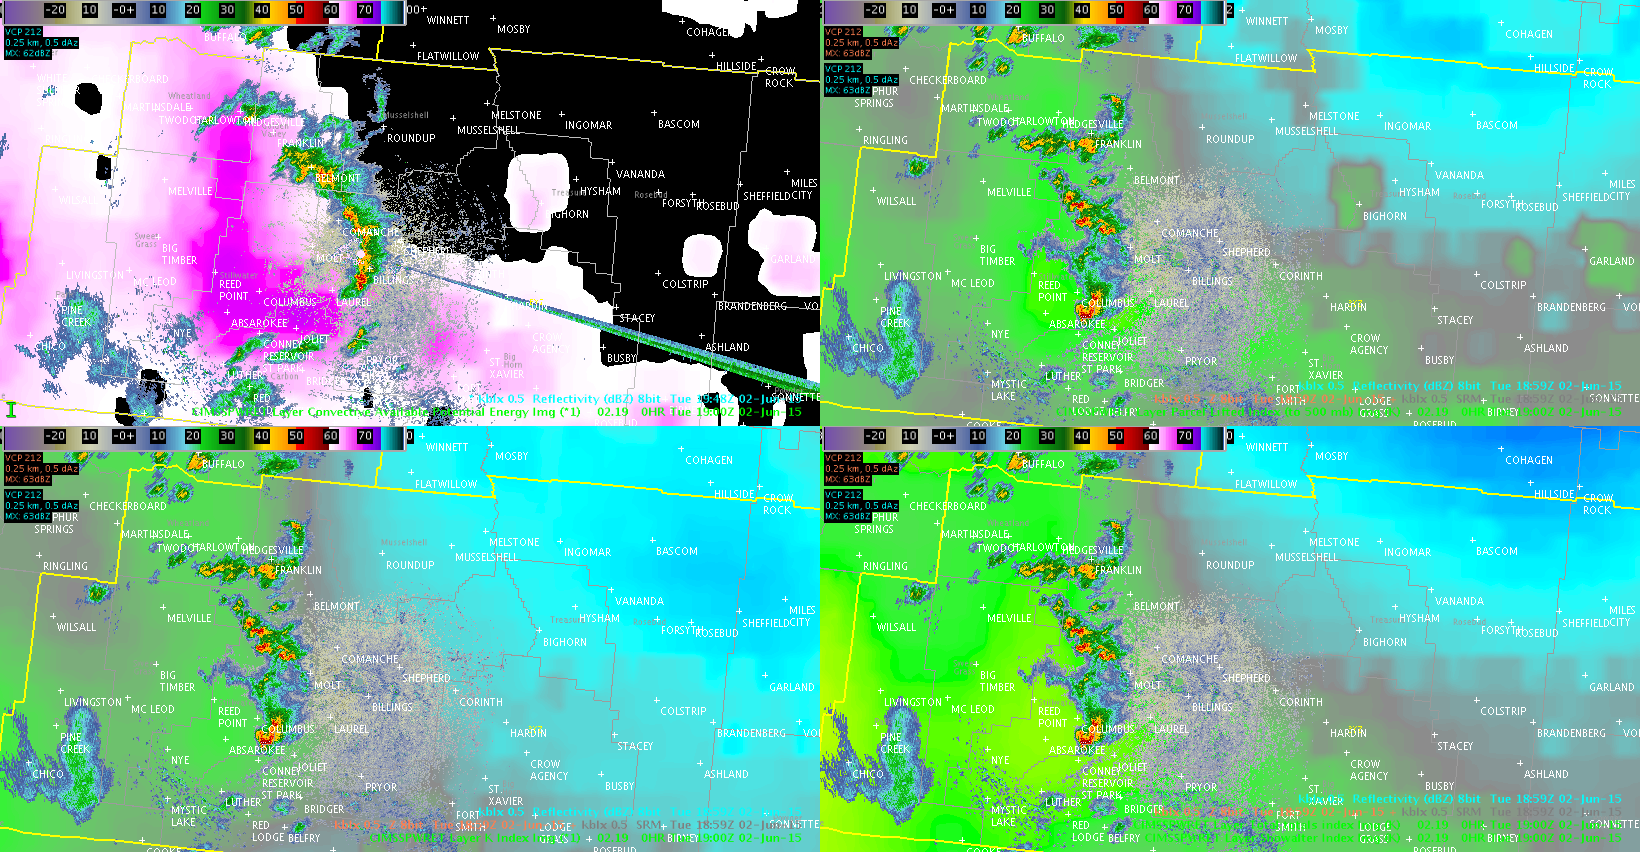
One thing that I’m not sure about is whether the large drop in lightning rate was real or if it was because I had neglected to move Point #12 in the AWIPS display as the storm continued to move east. I did move it, but the lightning rate didn’t pick back up noticeably. I wonder if, in warnings operation, the meteorologist may forget to move the point(s) and get a false idea of lightning rates. It would be incredibly helpful if, when a point is placed in an ENI polygon, that it would recognize that and continue to move with the polygon (weighted to the center of the polygon?) as long as that polygon existed.

Jason Williams

Tags: None

ProbSevere on BLX storm

d2_probsvr_1920

The ProbSevere algorithm had a notable jump on the convection NW of BLX, despite it moving into an area that may not be as hospitable for severe weather. There were two ProbSevere clusters at 1920z; the northern one had a value of 23% and the southern at 73%.


d2_probsvr_1926

At 1926z, the two were combined into one with a ProbSevere of 66%. Since it was maturing, ProbSevere may have moved past its prime usefulness.

Jason Williams

Tags: None

LAPS and Montana convection

d2_1800_instability

GOES-derived LAP products indicate a swath of higher instability across the southwestern part of the BYZ CWA. A storm cluster is moving northeast out of this zone of higher instability. Per the LAP products, I would expect the storms to diminish in intensity. Will provide an update on whether or not that occurs.

d2_1920_radar

Jason Williams

Tags: None

Thoughts on ENI cell area

We’re looking a multicellular situation in OR. We’ve had no lightning jumps show up in our area, so have been looking at the other lightning data available to us. Occasionally, an ENI cell will show up; however, we’re wondering how useful the cell area data is in a timeseries during a multicell event. A cell will be flagged and then its shape may change drastically as in the example below (upper-left panel). However, this change doesn’t appear to be tied to a drastic change in lightning or radar data – anything physical happening in the storm. Rather, it appears to be mostly due to how the clustering is determined.

Perhaps its value is greater in a more cellular storm mode. Perhaps the terrain is also causing a problem?

eni2304

Williams & MacGyver

Tags: None