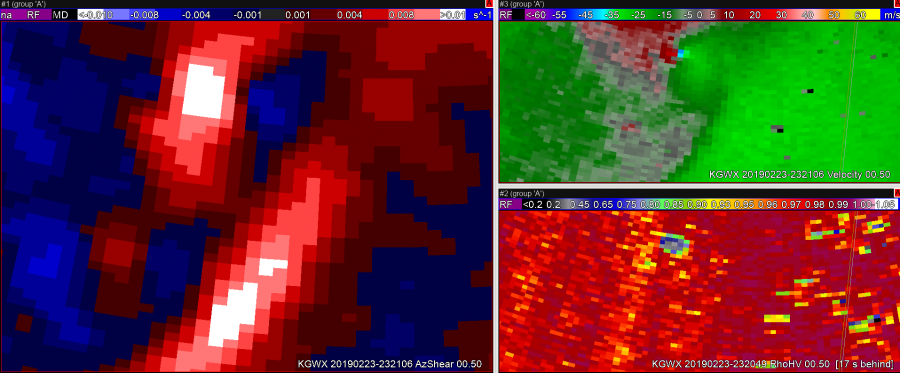
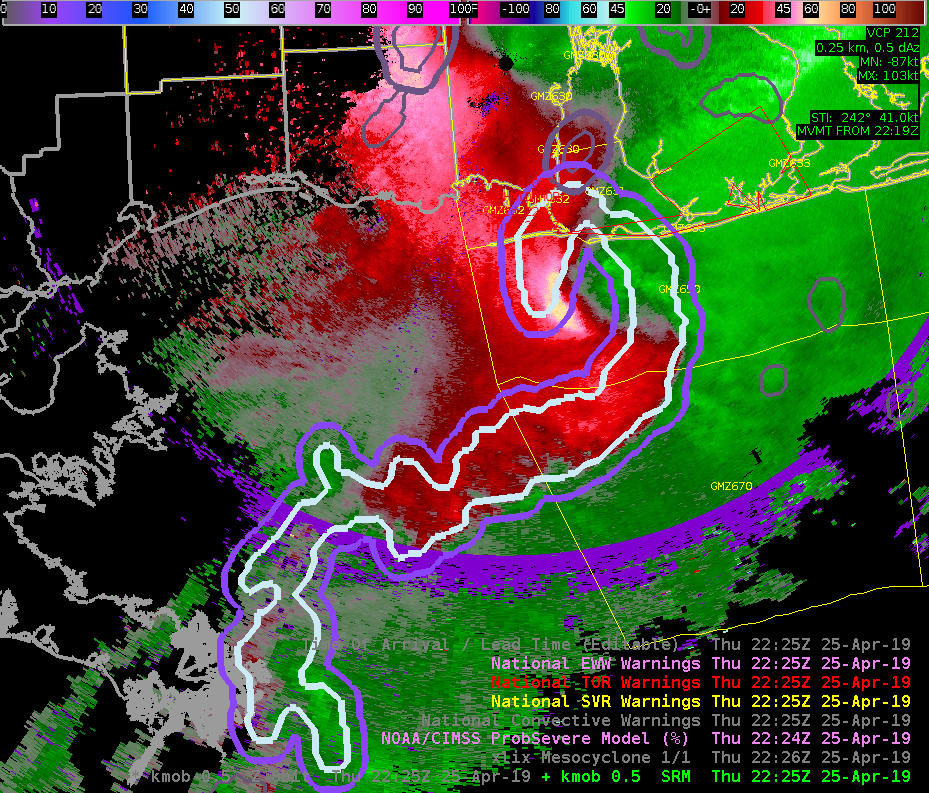
 Photo above shows a double maximum in AzShear. One of these is clearly colocated with a TOR on ground via CC. However, velocity shows two very different situations, possible strong tornado on ground versus convergence along the RFD gust front. If you were just looking at the AzShear product, both of these areas would be cause for concern, when in fact the impacts are extremely different. Would be nice to be able to differentiate between extreme high values of AzShear near a tornado versus more broad convergence on any wind shift area.
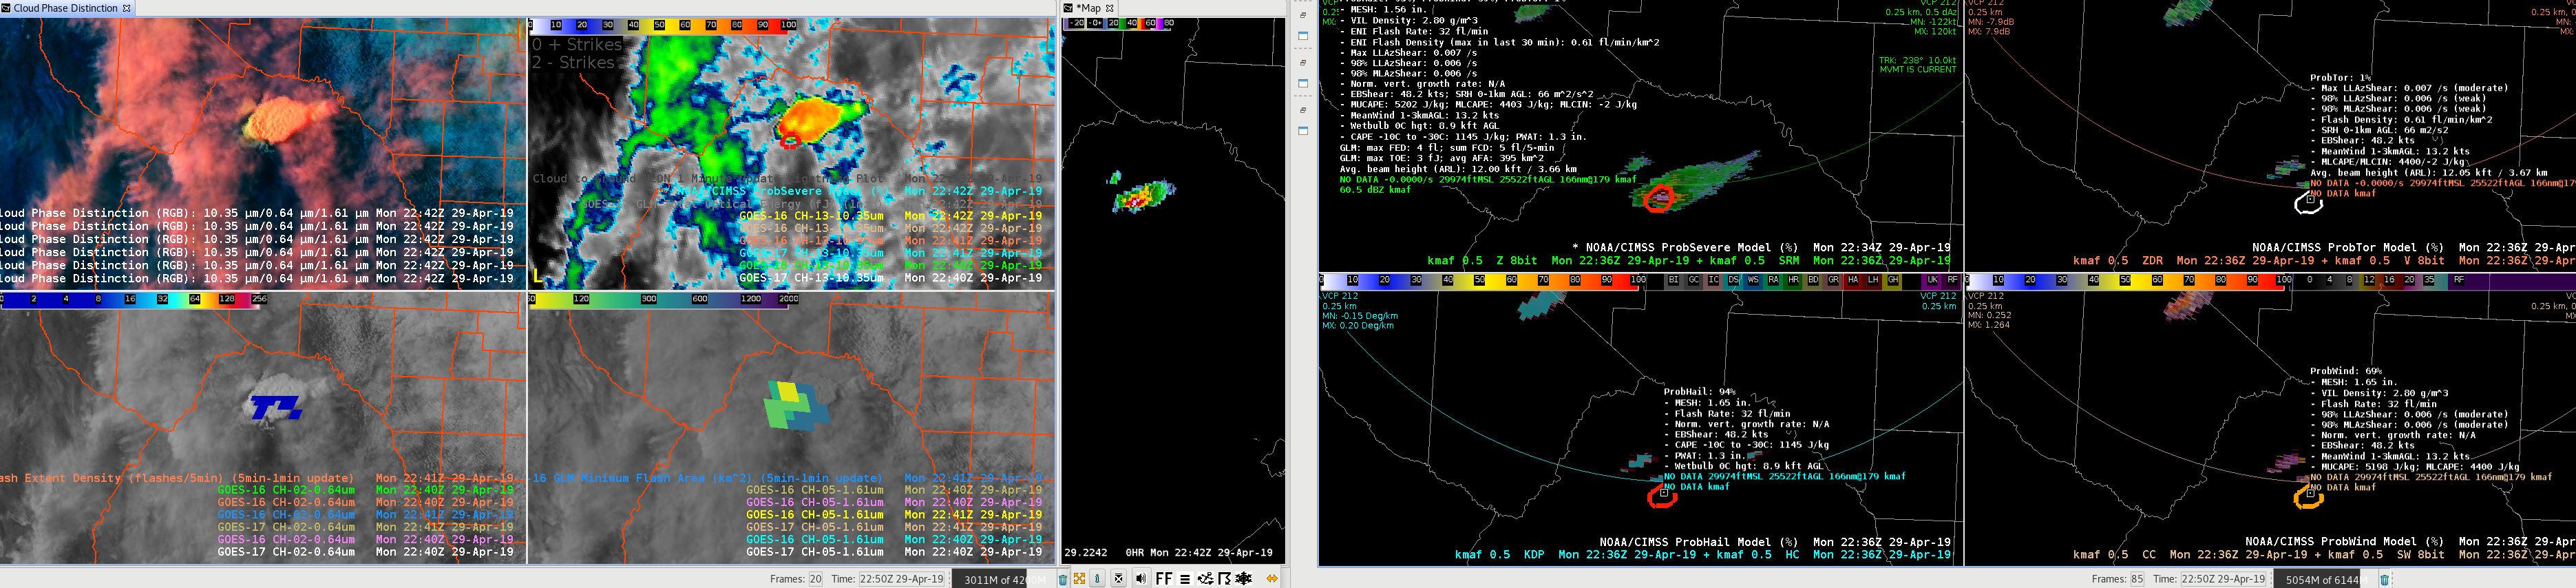
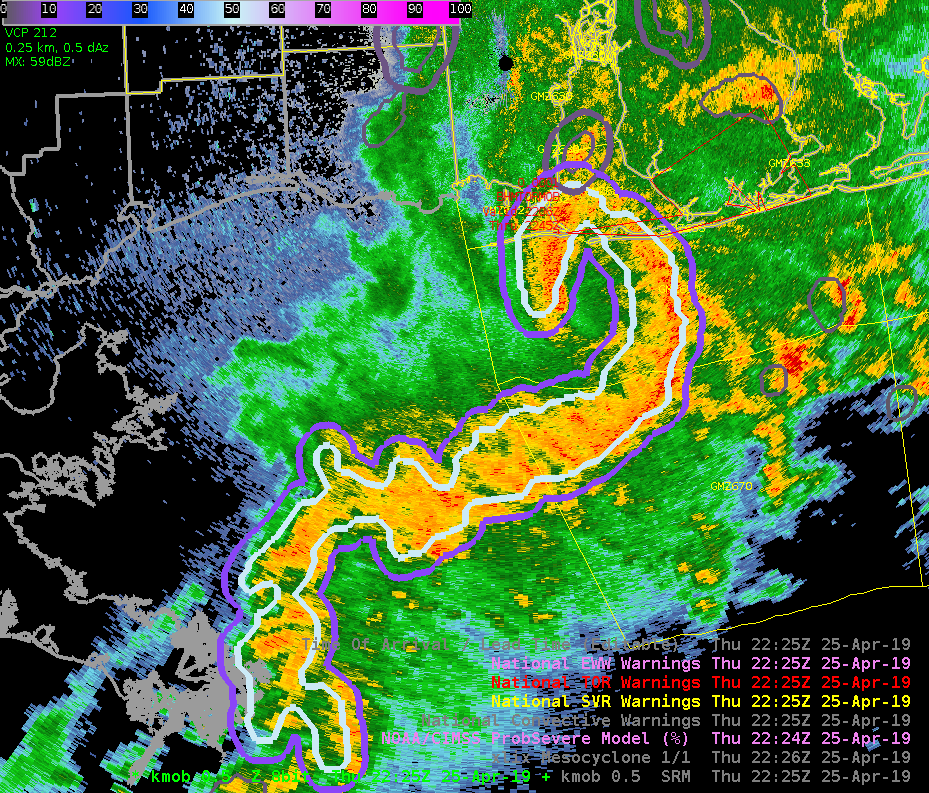
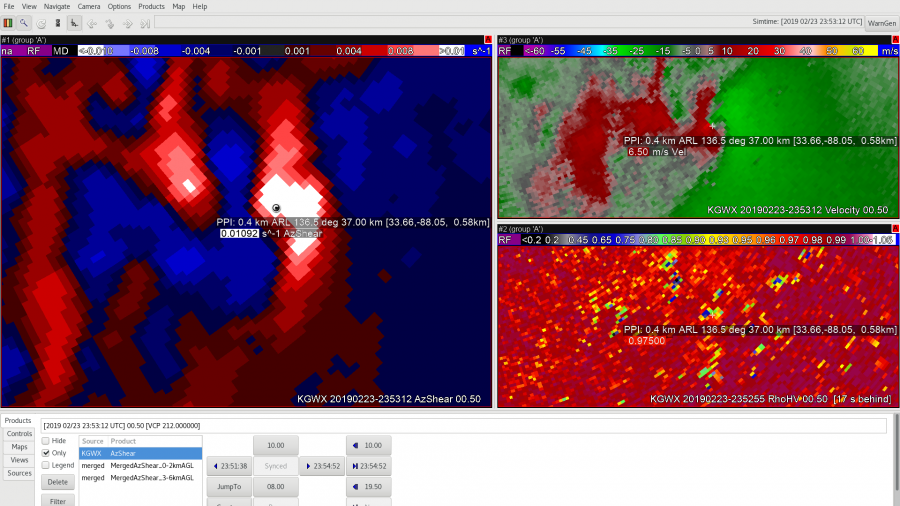 This next image shows a region where the AzShear maximum is too broad. This may simply be a color table issue, but clearly there is an area within the white region where a tornado is on the ground, and other regions within that max where only general convergence is occurring.
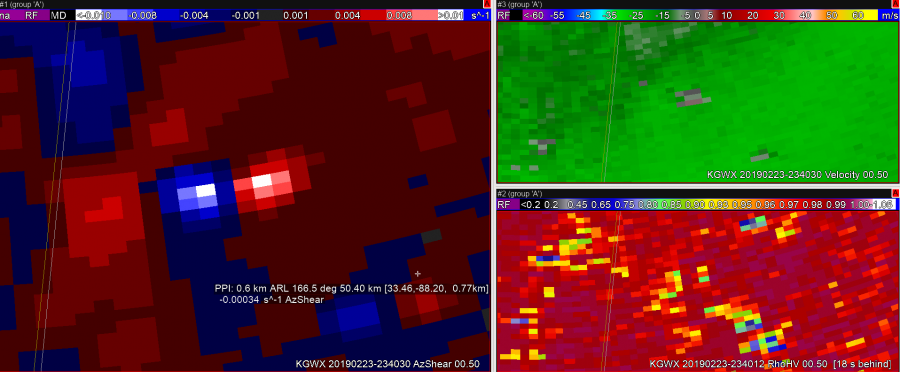 This image shows a location where some ground clutter is producing a false positive and negative AzShear couplet. Mathematically it makes sense to see this here given the V data, however to an untrained eye or someone just solely depending on AzShear you could be led astray.
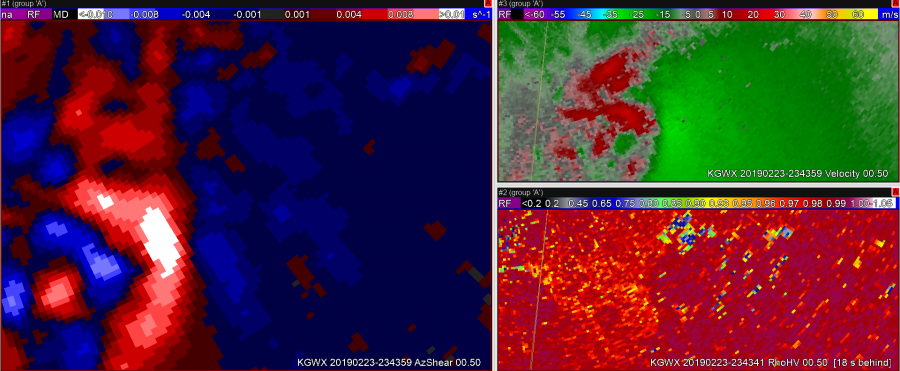
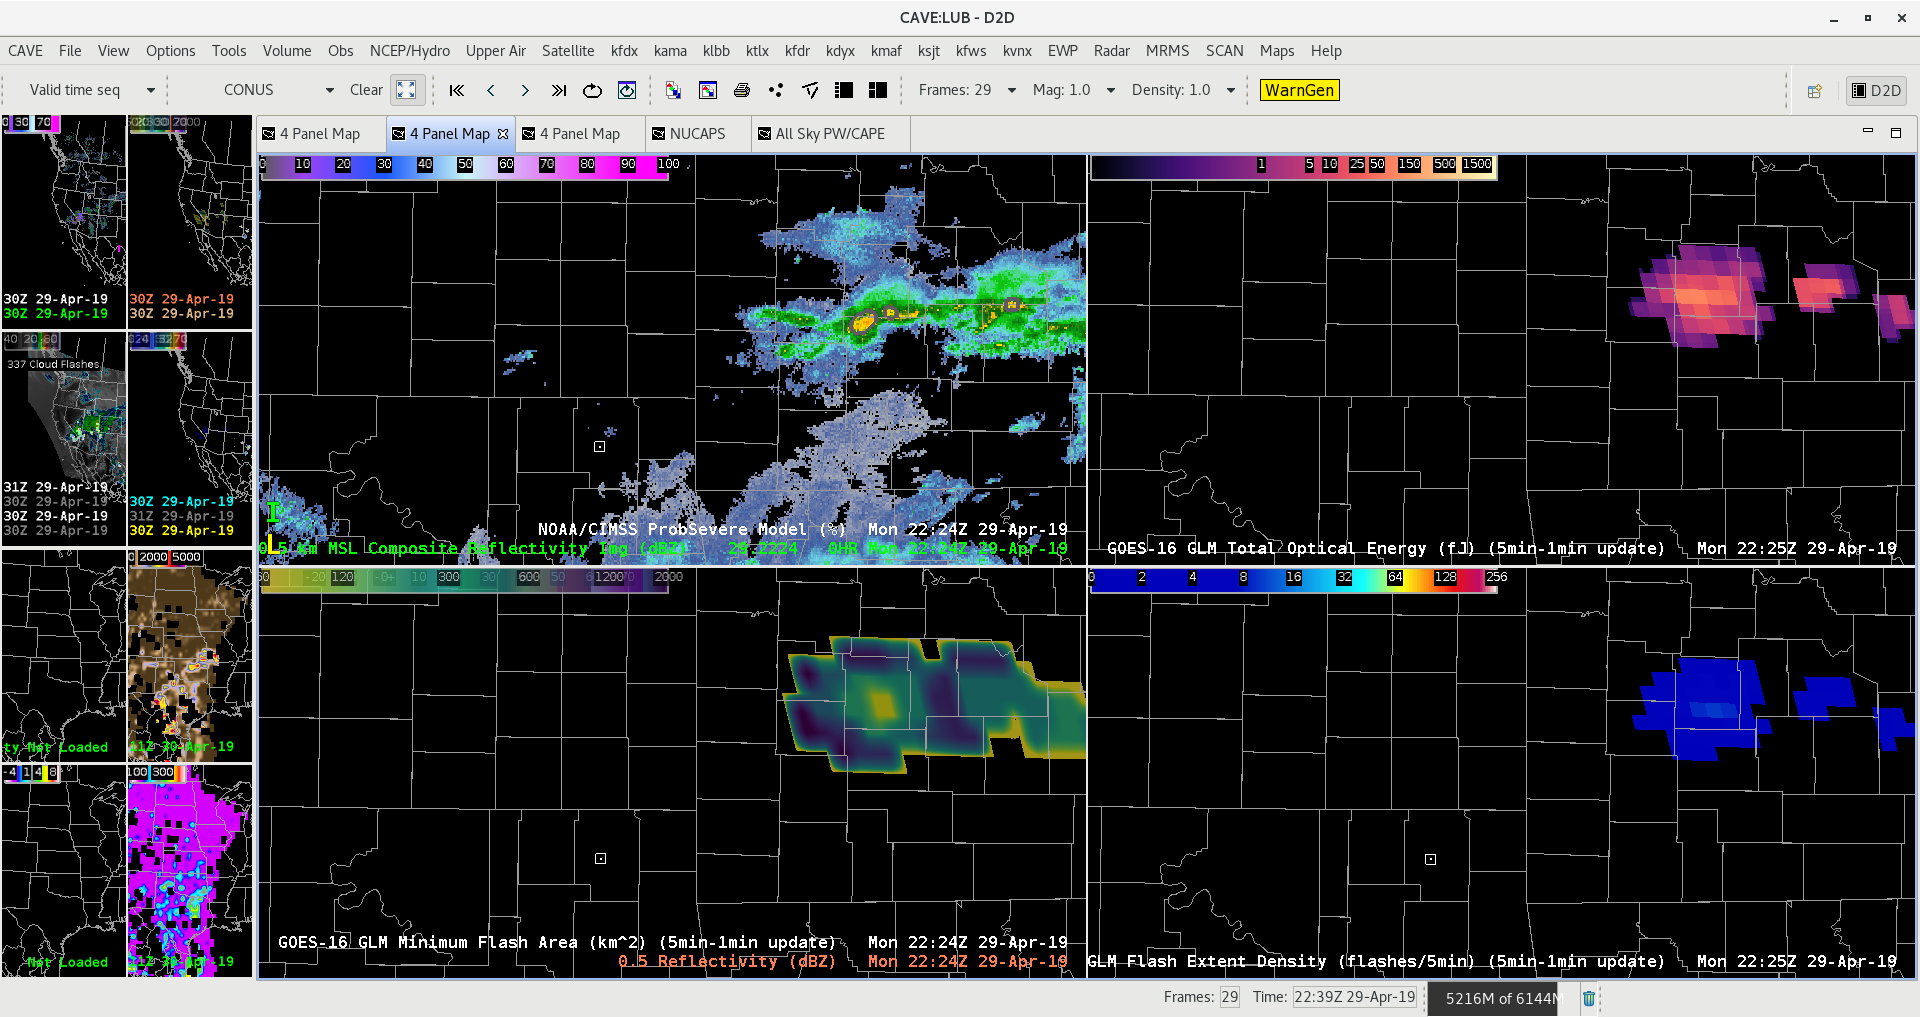
A positive of AzShear is that it can highlight areas of potential concern down the road. The above frame was just one of several frames showing strong convergence and high AzShear values preceding a second tornado from the main cell 10 minutes later. This could be particularly helpful in QLCS storm modes where convergence and shear increases in a broad sense along the main line prior to tornadogenesis. Also in this particular case, the V data was not entirely conclusive that convergence was increasing. AzShear was very conclusive here.
Dusty Davis


 South Beach
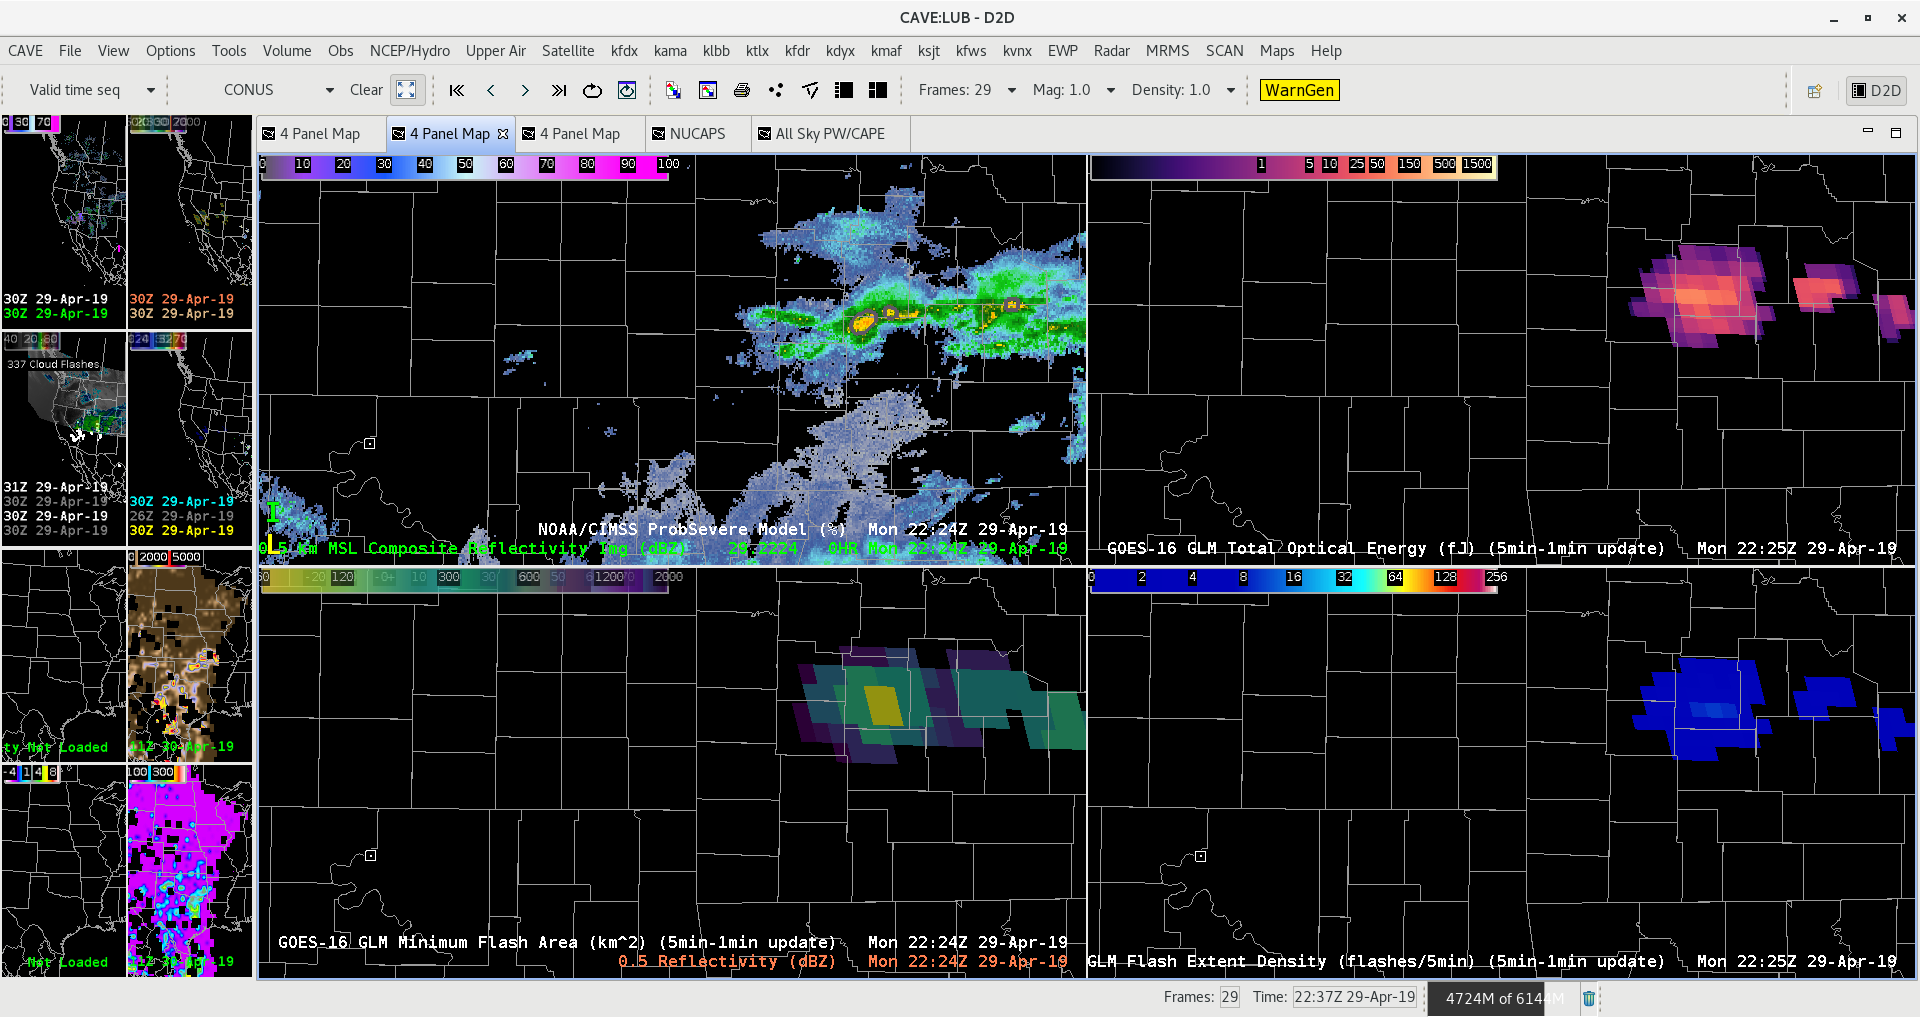
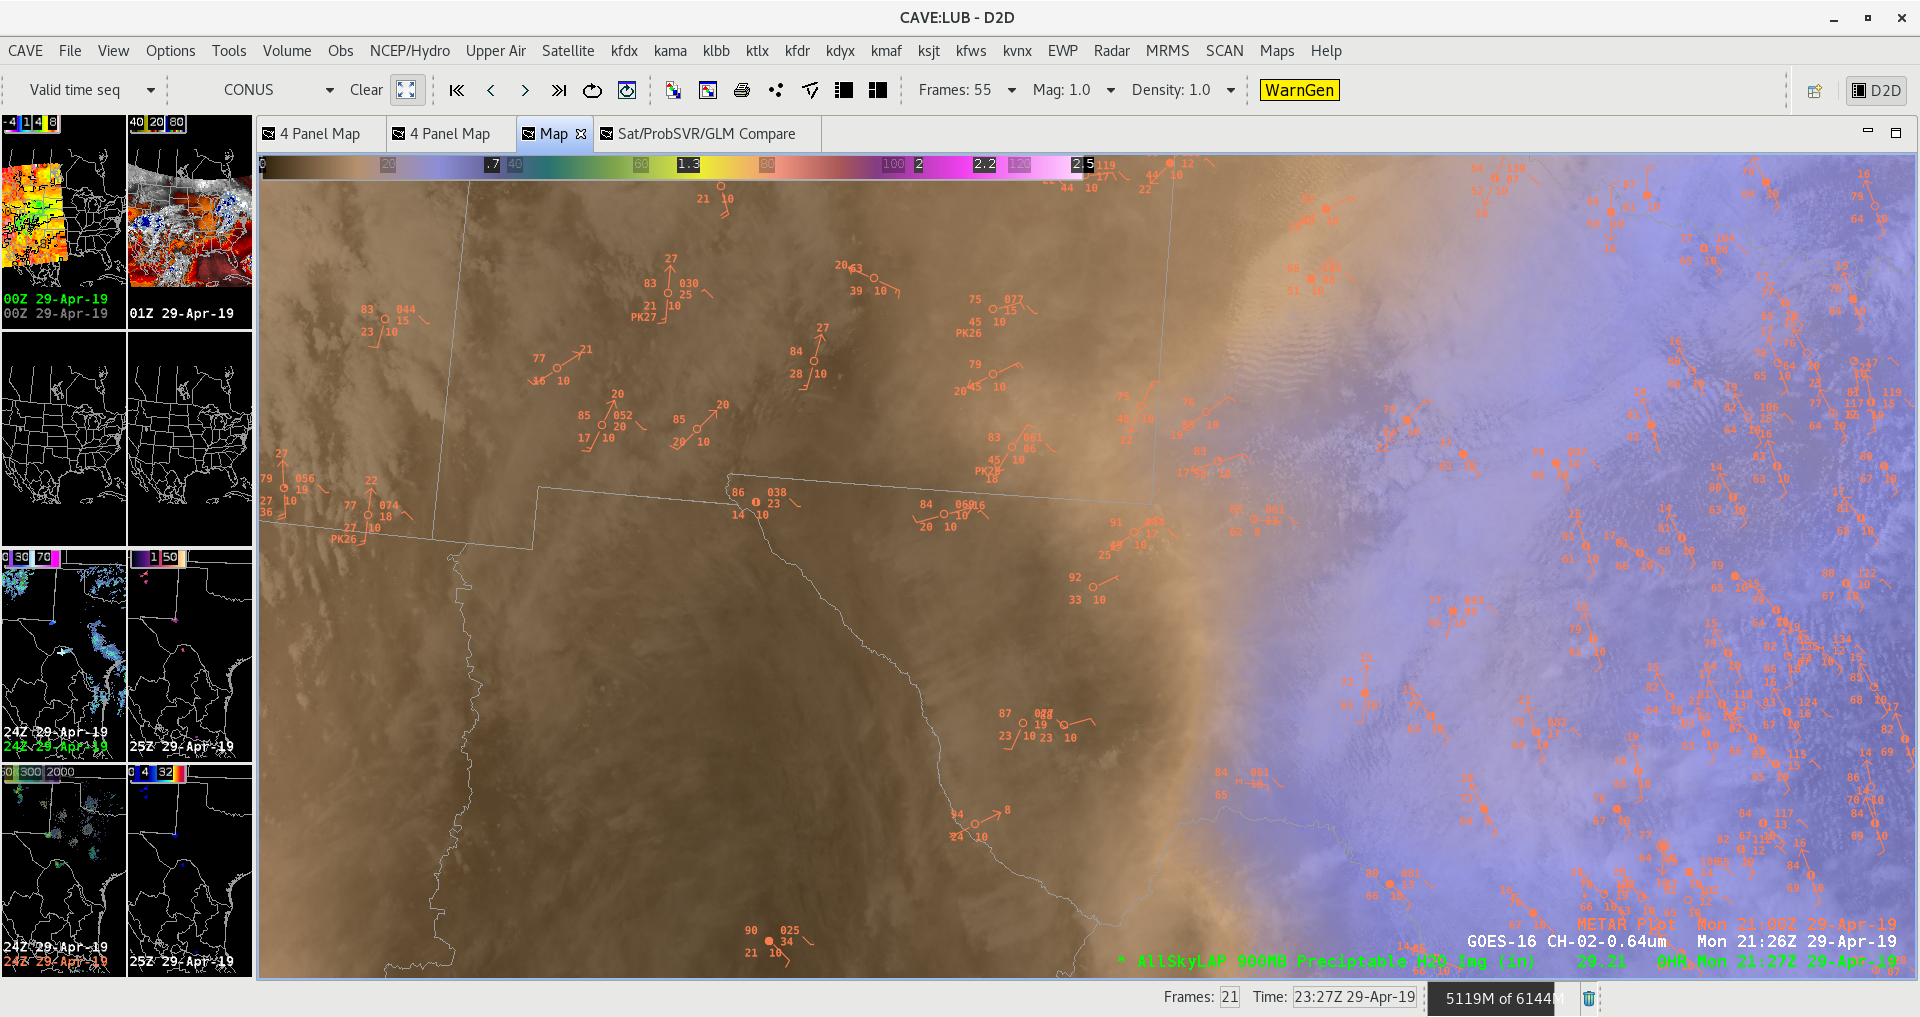
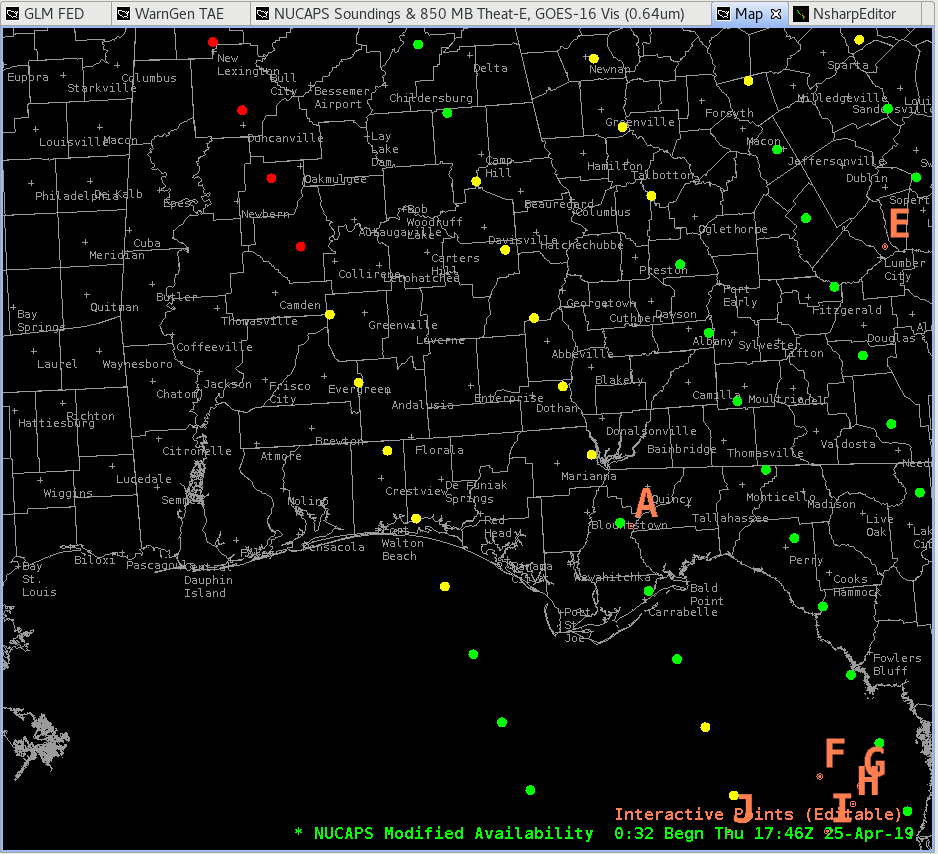
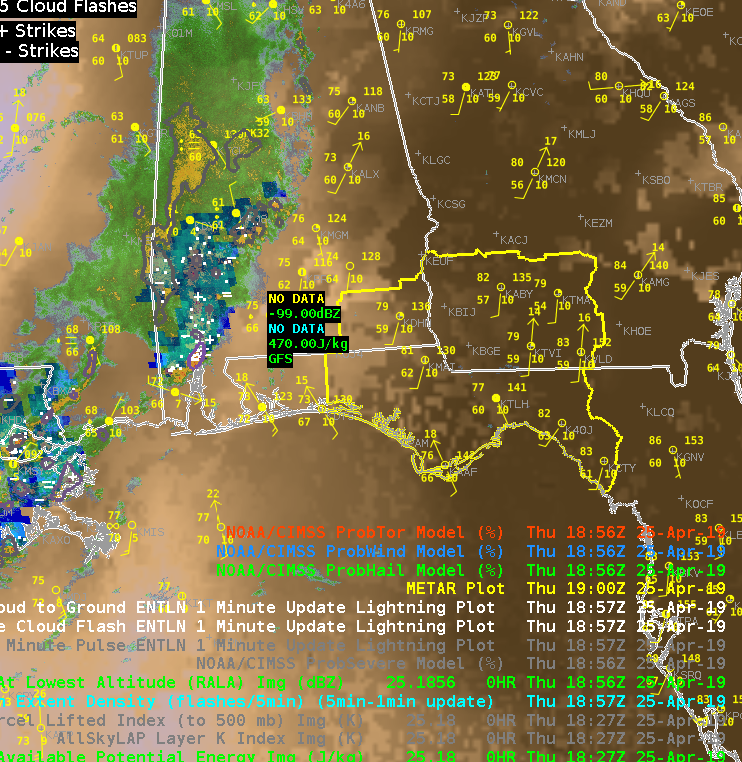 An 8 hour loop shows how the instability has built and gives more confidence that instability will continue to build ahead of the storms to our west.
  We did feel that LAPS CAPE seemed a bit underdone given the intensity of the downstream of the convection, so we took a look at the latest NUCAPS retrievals. We examined the point in the extreme SE of our CWA.
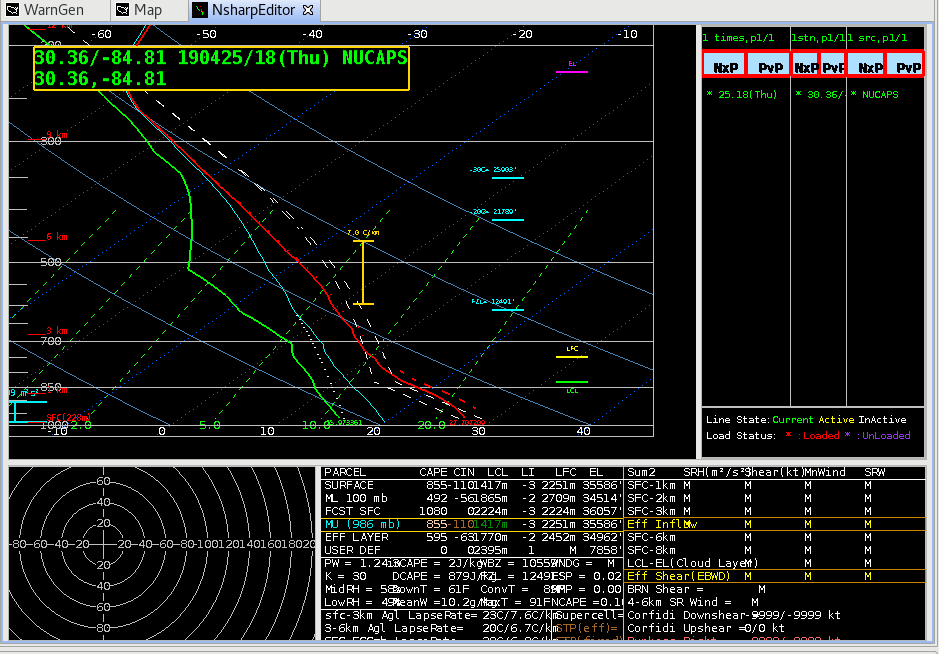
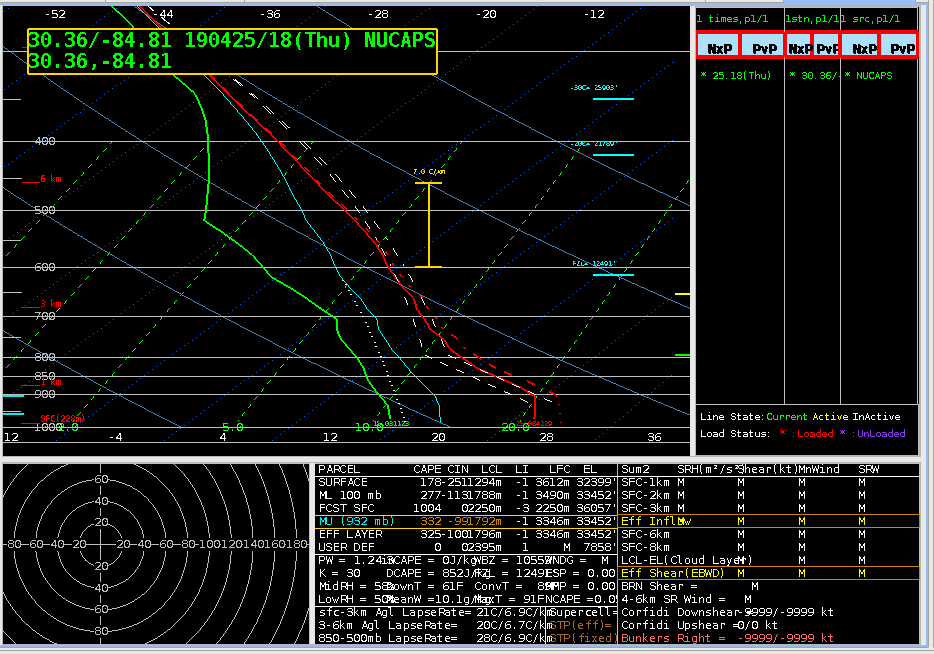
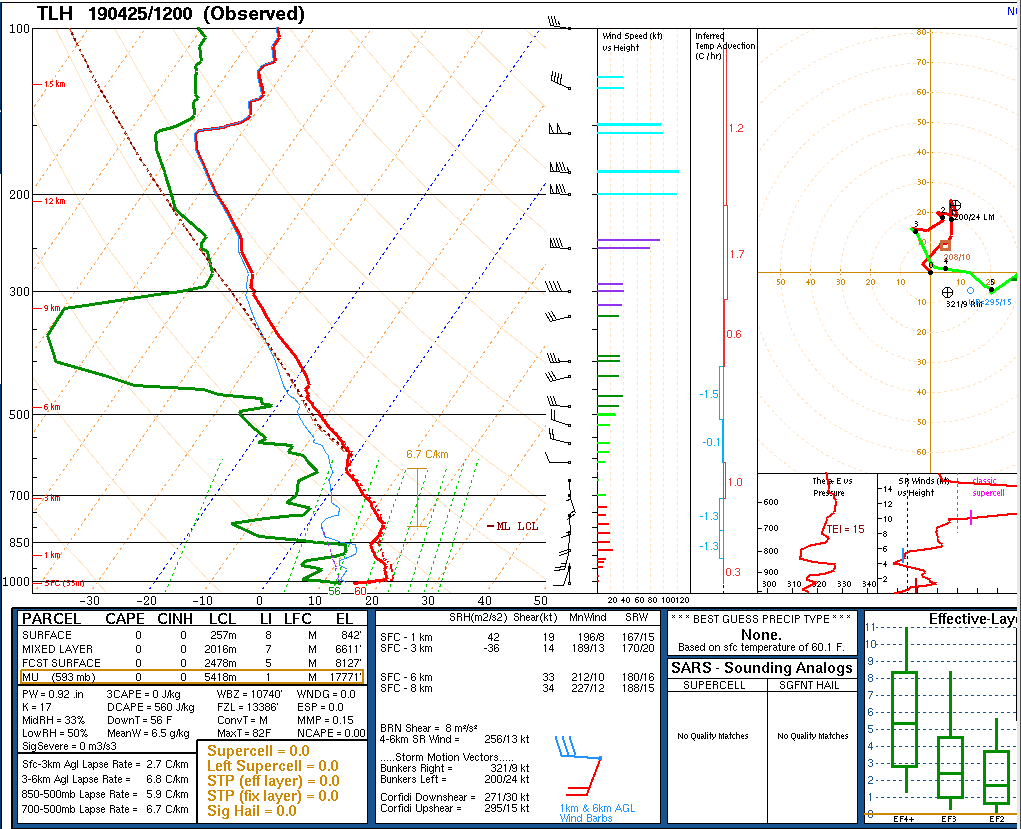
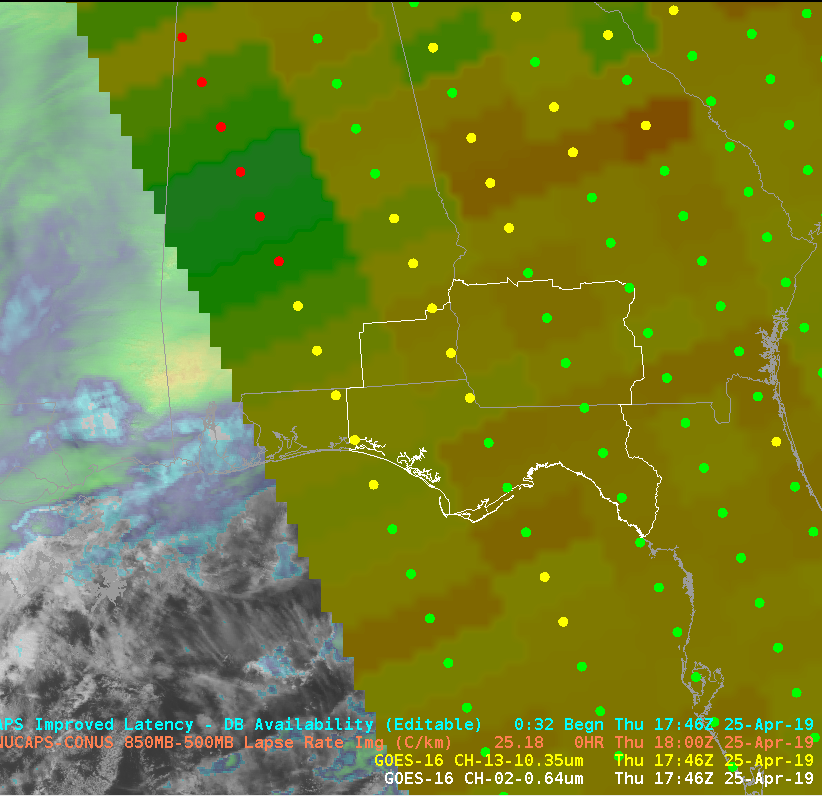 The boundary layer on the unadjusted sounding required some adjustment to match the nearest obs, but overall, seemed to capture the general profile well. I was initially skeptical about the warm nose just above 700mb, but a similar feature was evident on the 12z sounding from TAE. This feature may have an impact on storm intensity and potential hazards, and it would be particularly helpful to see how this feature changes over time.
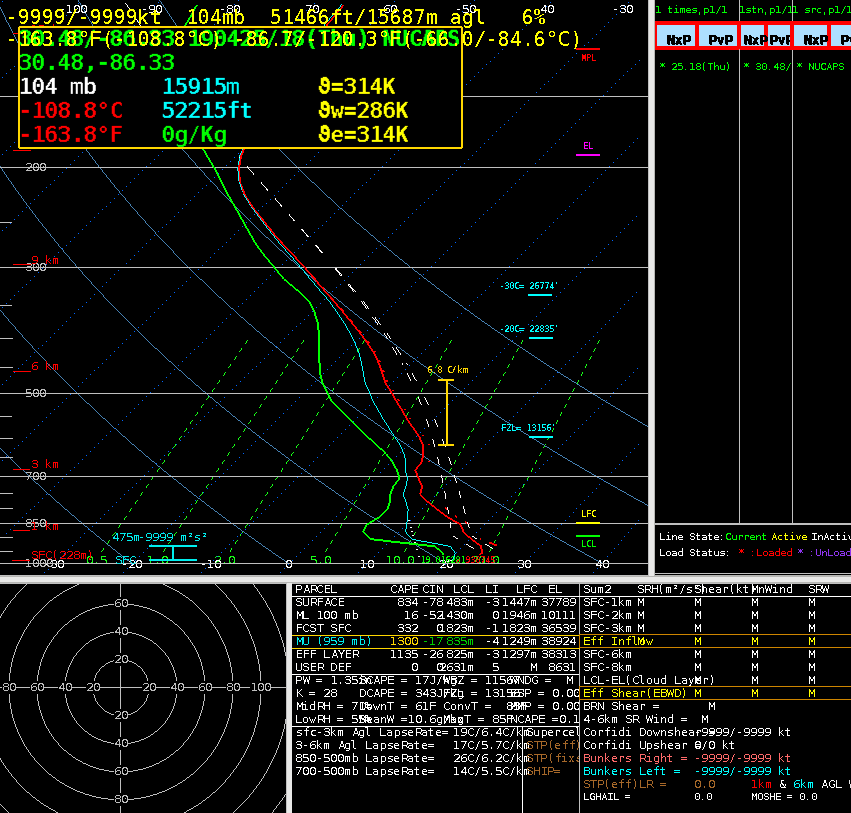
 Sandor Clegane

