
Favorite application of the LAP Precipitatable Water is the low level from the SFC to 900 MB as a good proxy to dryline evolution. It very clearly highlights how it developed through the day.
South Beach
Official websites use .gov
A
.gov website belongs to an official government
organization in the United States.
Secure .gov websites use HTTPS
A
lock (
) or https:// means you’ve safely connected to
the .gov website. Share sensitive information only on official,
secure websites.

Real-time posts made during testbed nowcast and warning operations.
Favorite application of the LAP Precipitatable Water is the low level from the SFC to 900 MB as a good proxy to dryline evolution. It very clearly highlights how it developed through the day.
South Beach
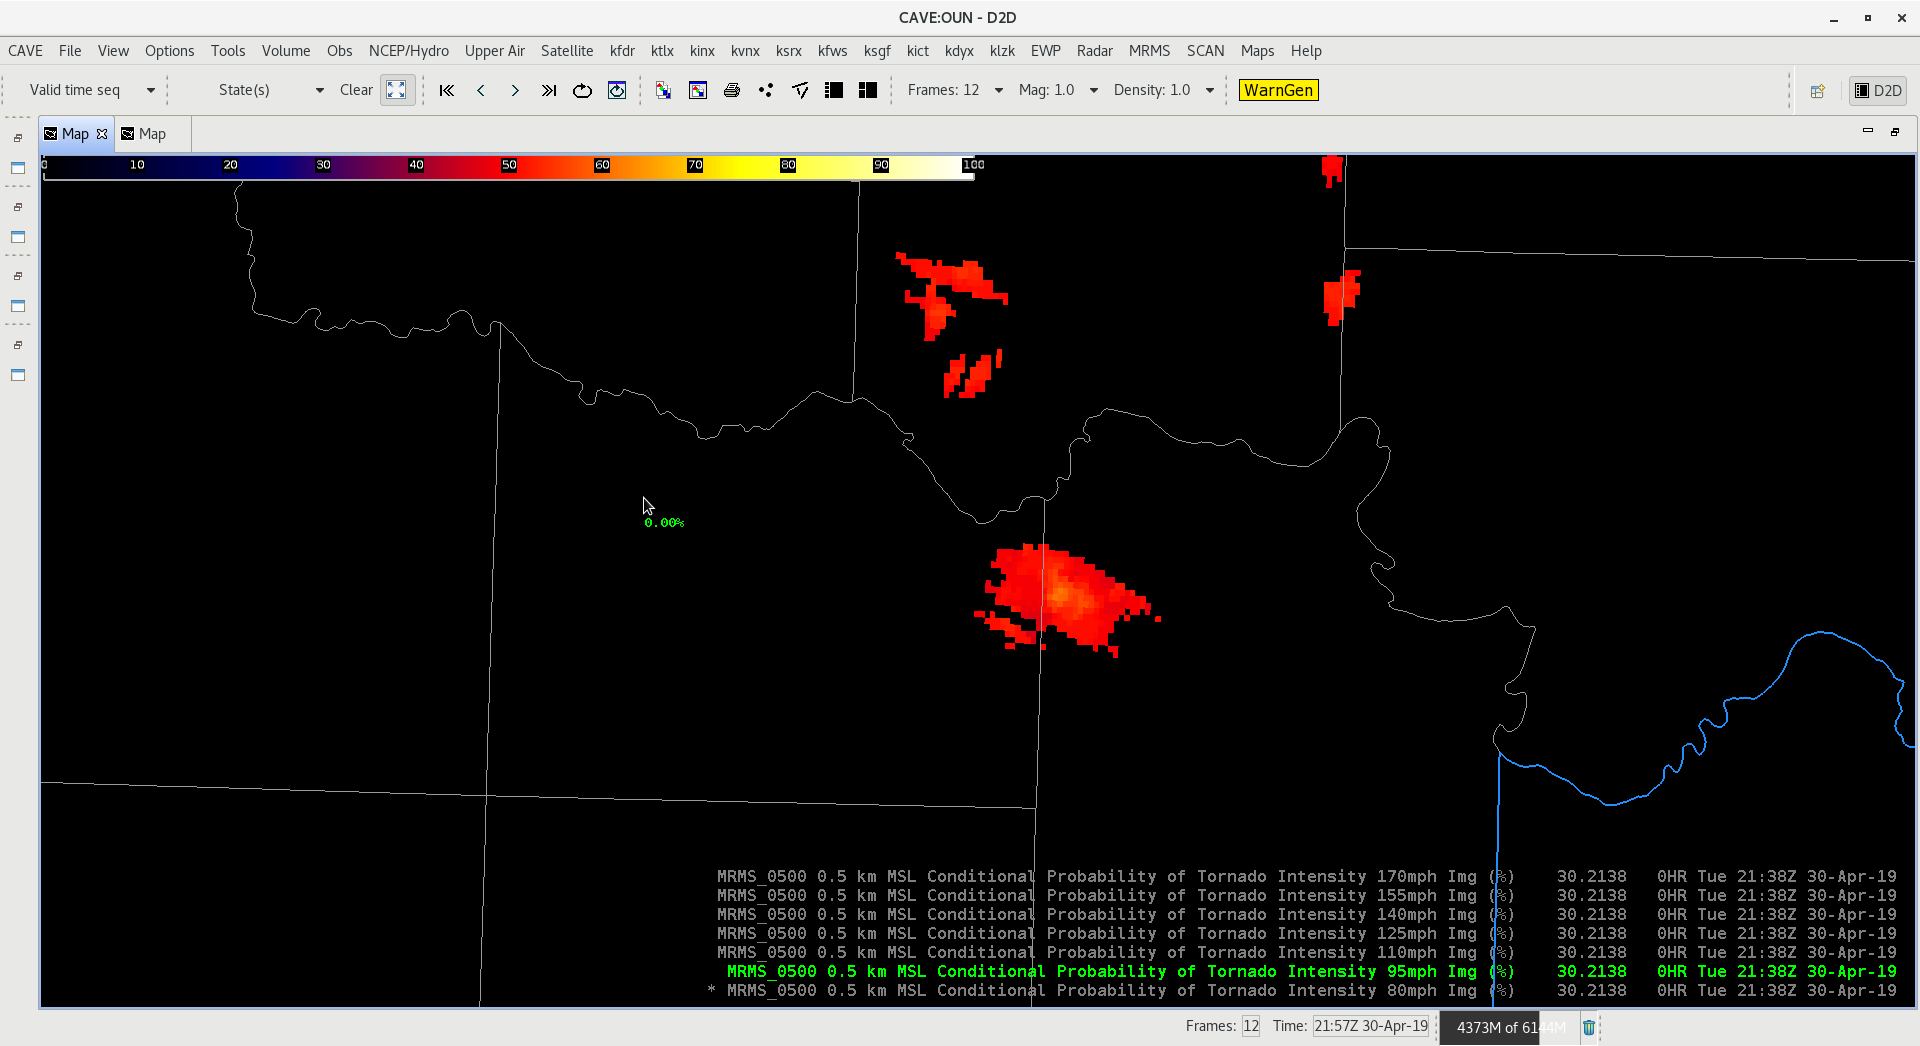


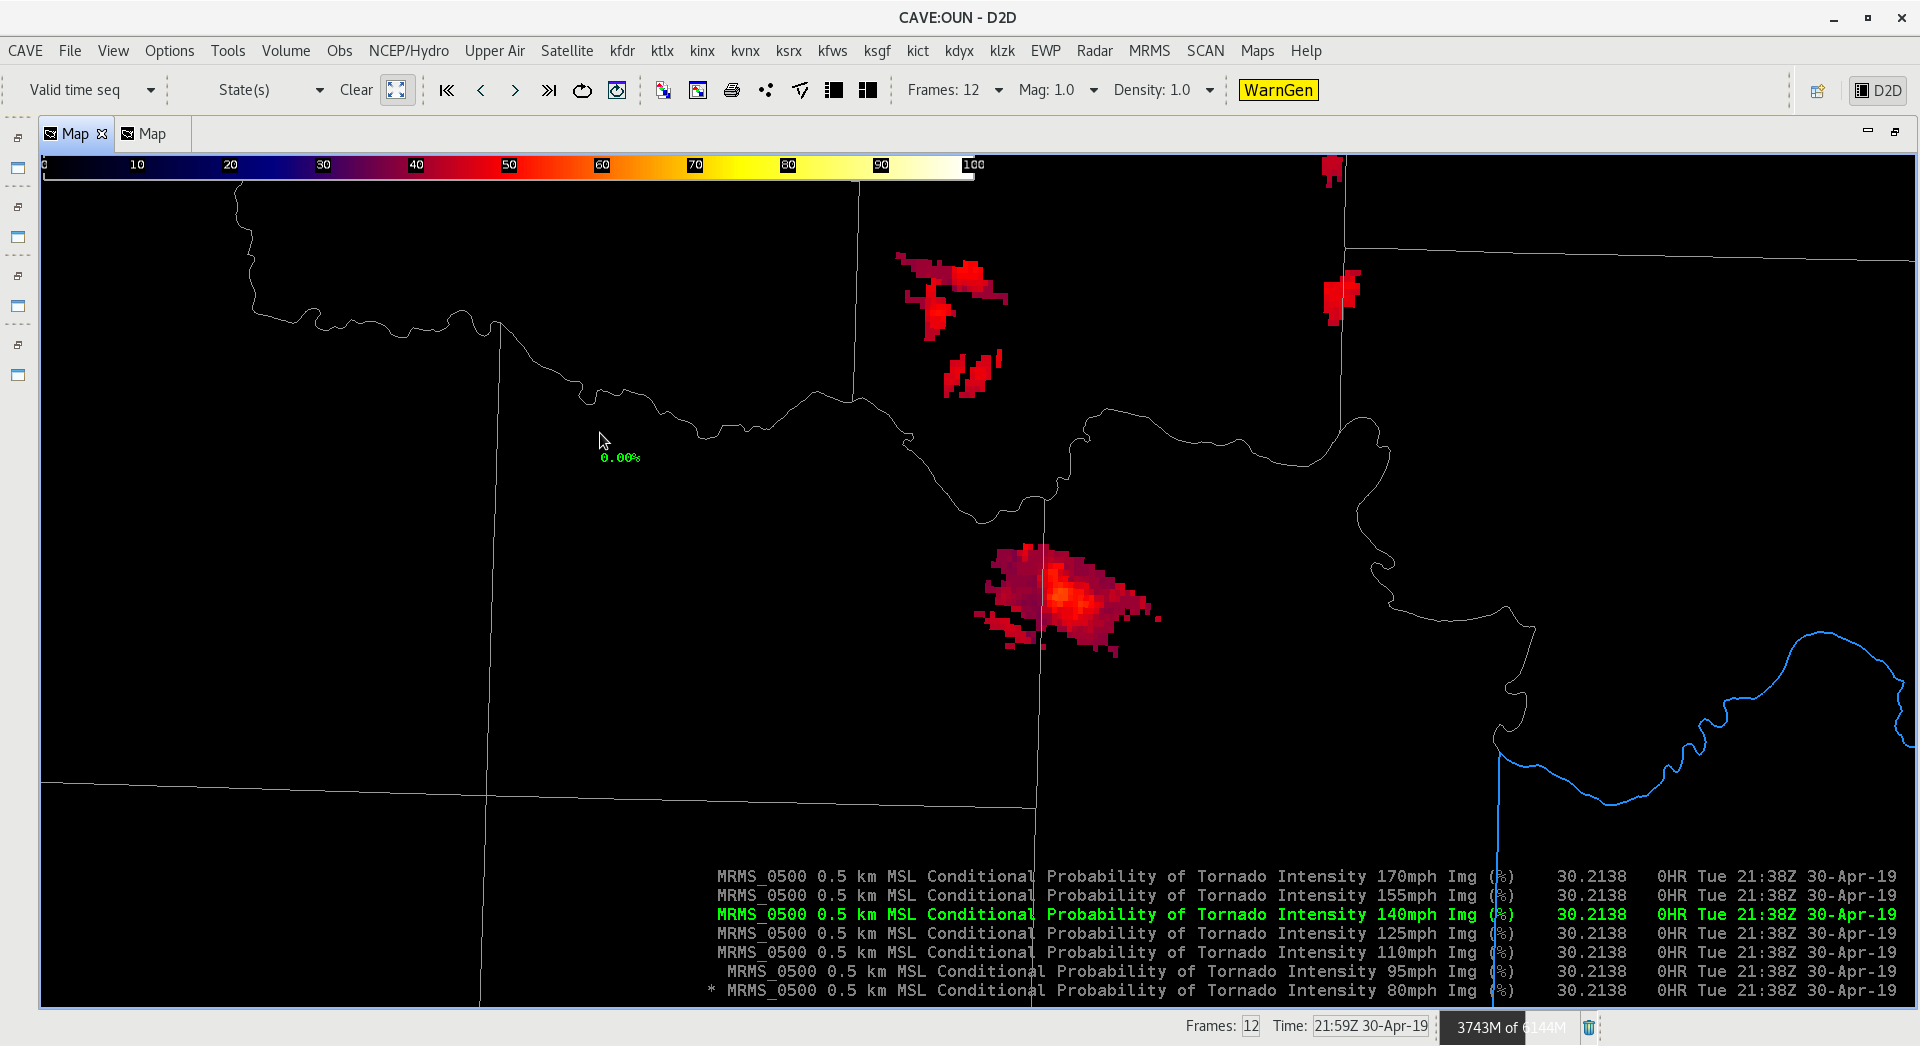
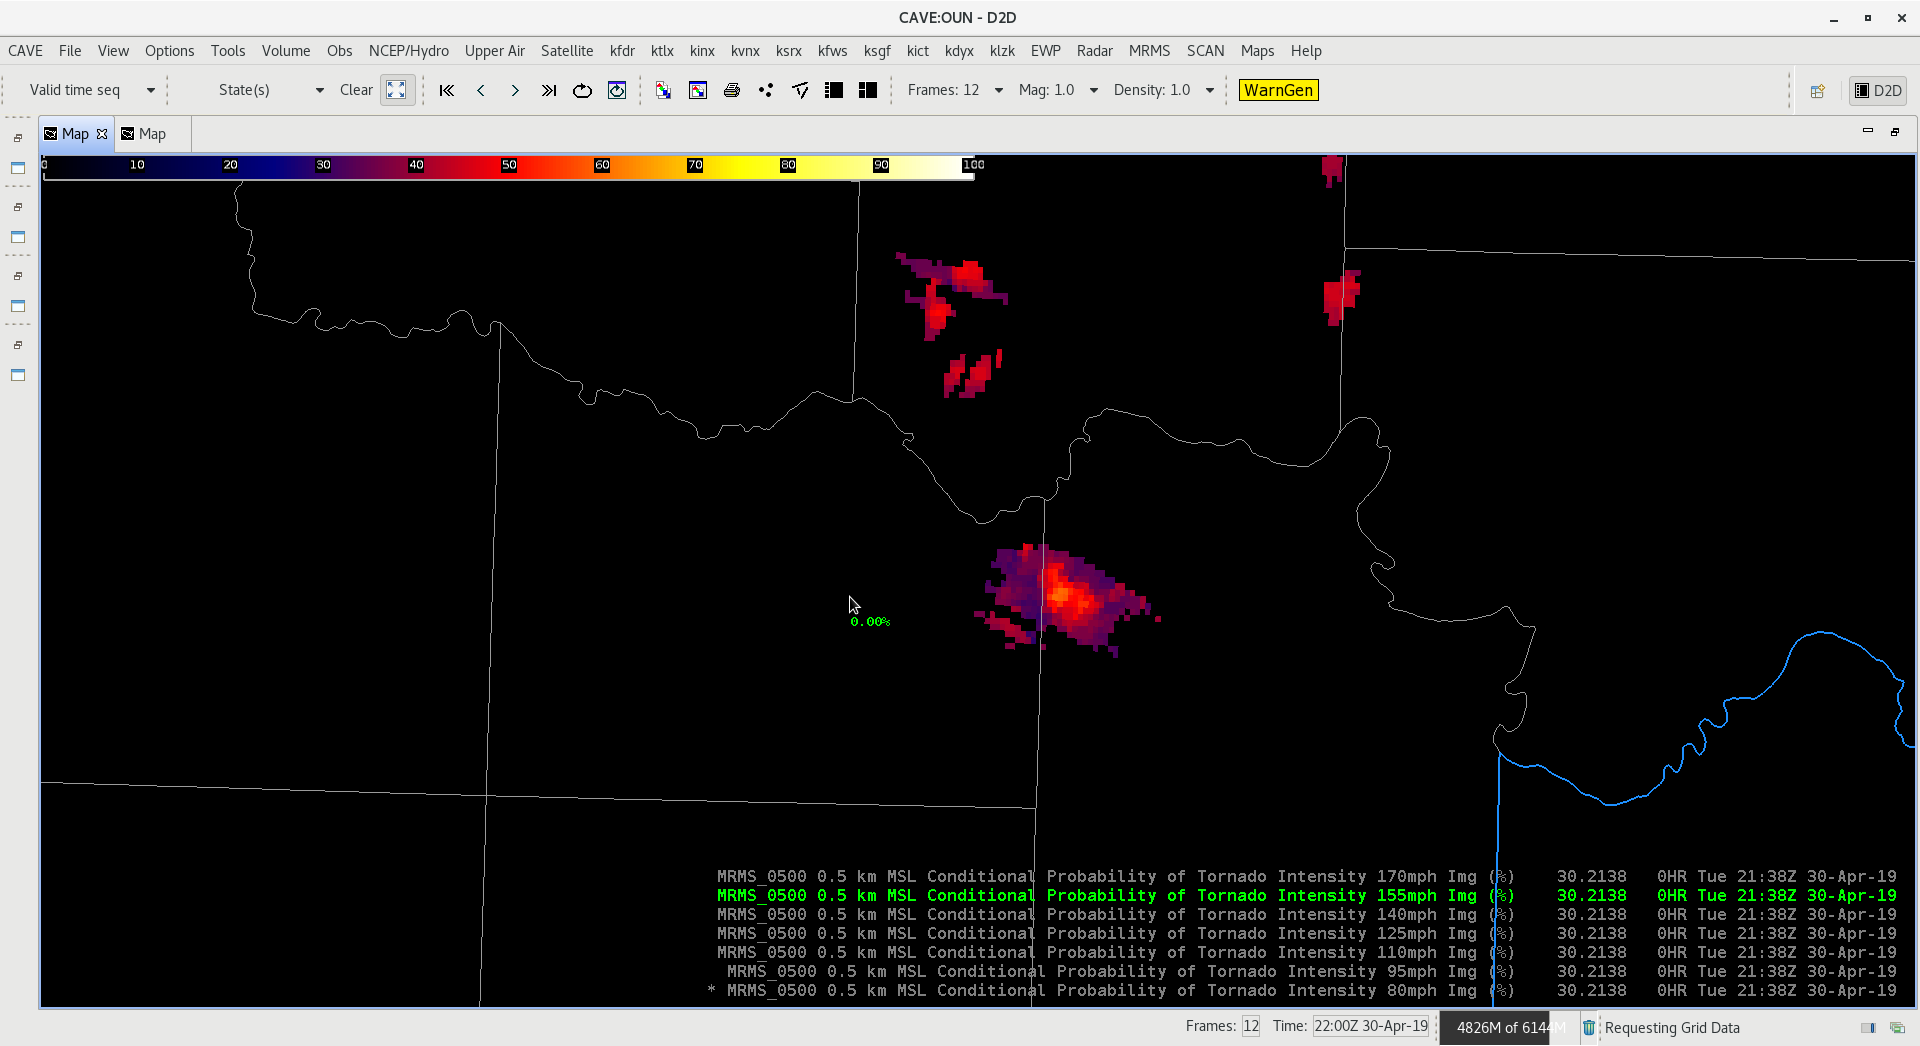
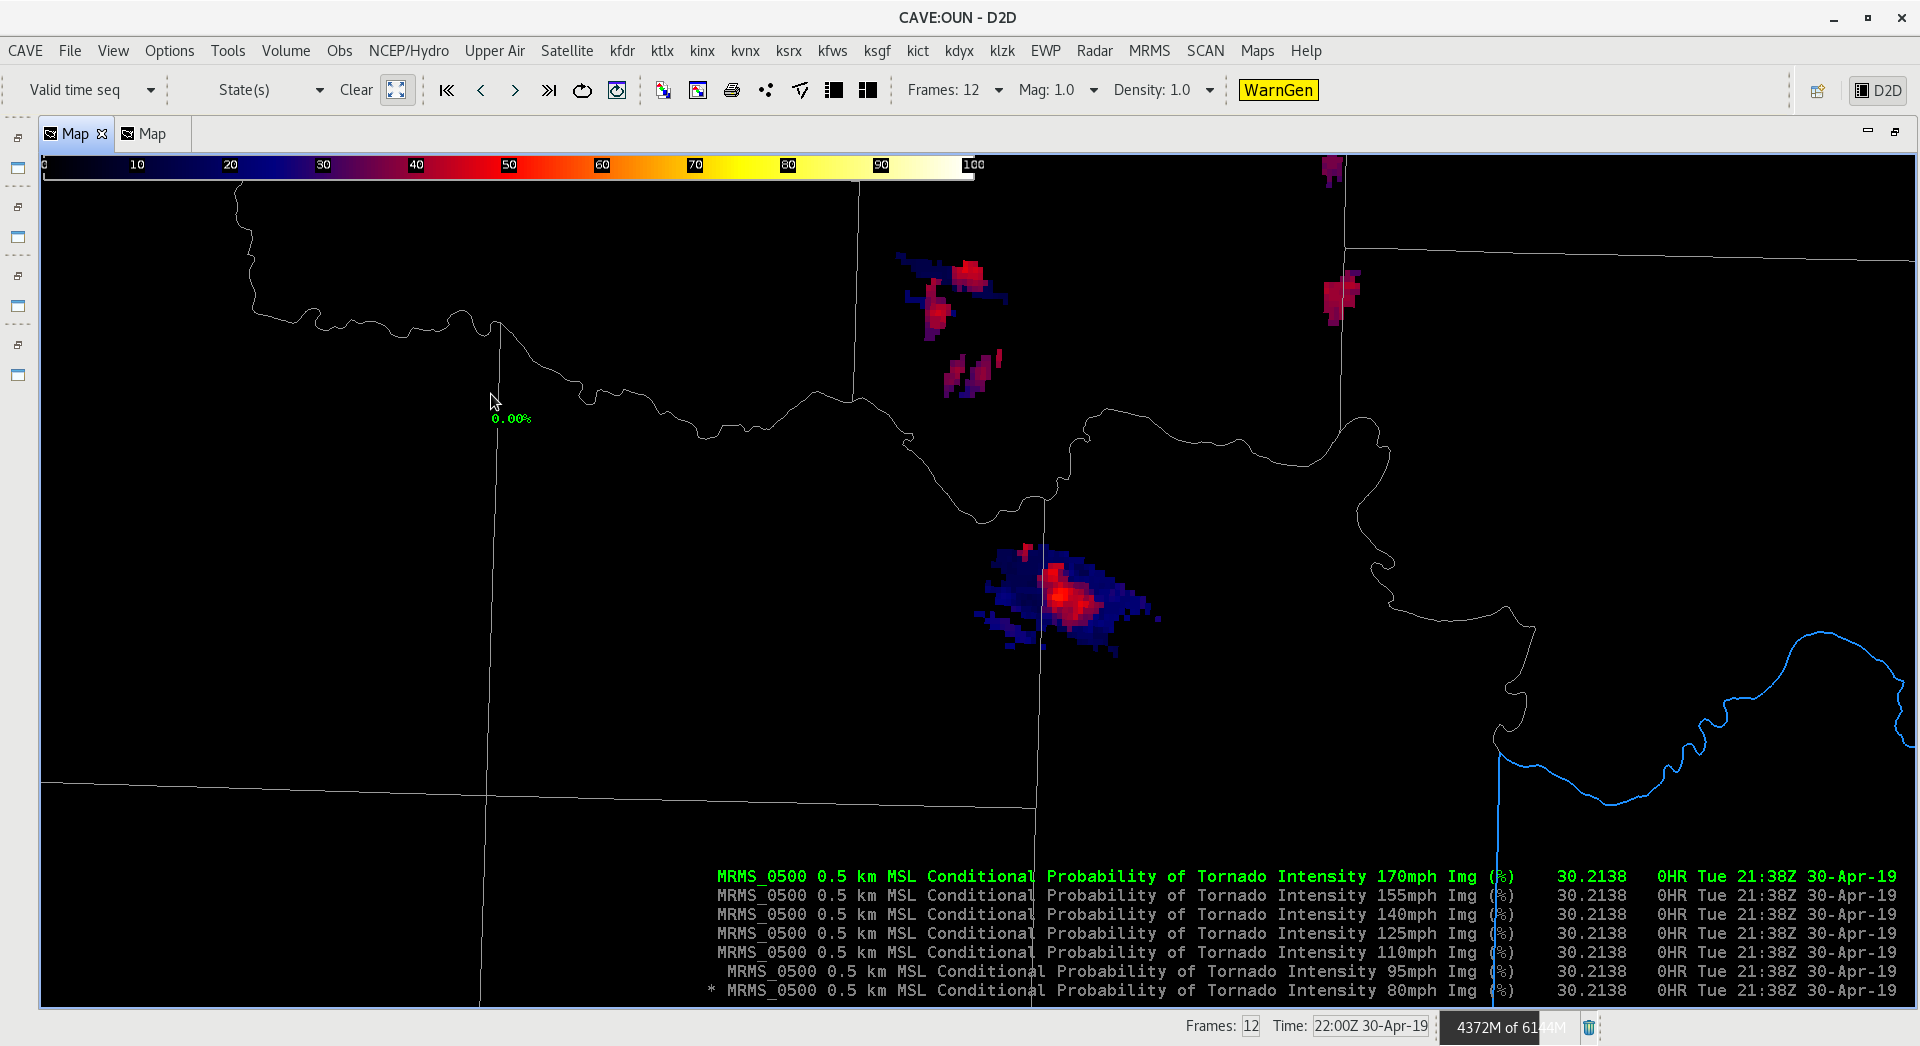
CPTI product shows very little change in the probabilities from one level to the next, therefore i recommend doing ranges with this analysis. This should highlight the threshold ranges of interest in a better way.
For example: Cat 1 (80-110mph), Cat 2 (125-155mph), Cat 3 (170+ mph)
-Jake Johnson
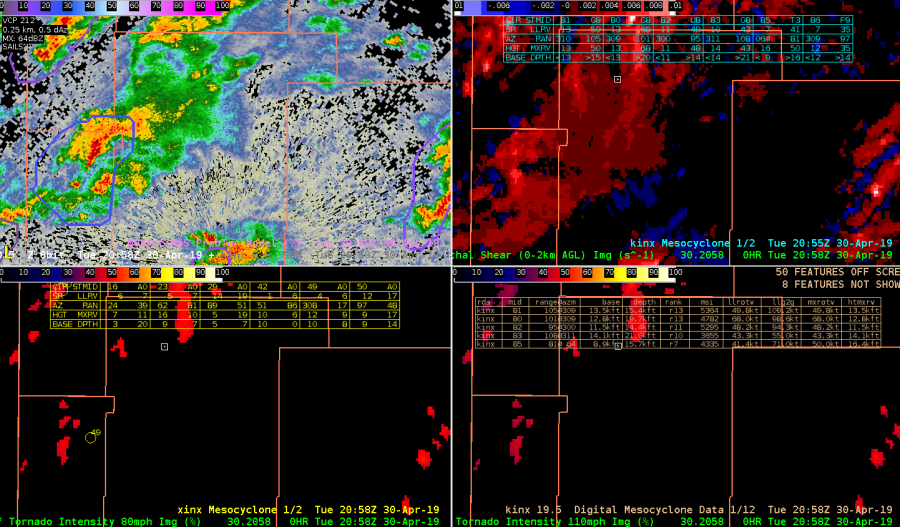
Gonna take a look at SC merger noting two small SC storms WNW of KINX radar @ 2058UTC. Prob TOR with these storms ~ 25% at this time with generally weak AzShear with stronger northern storm.
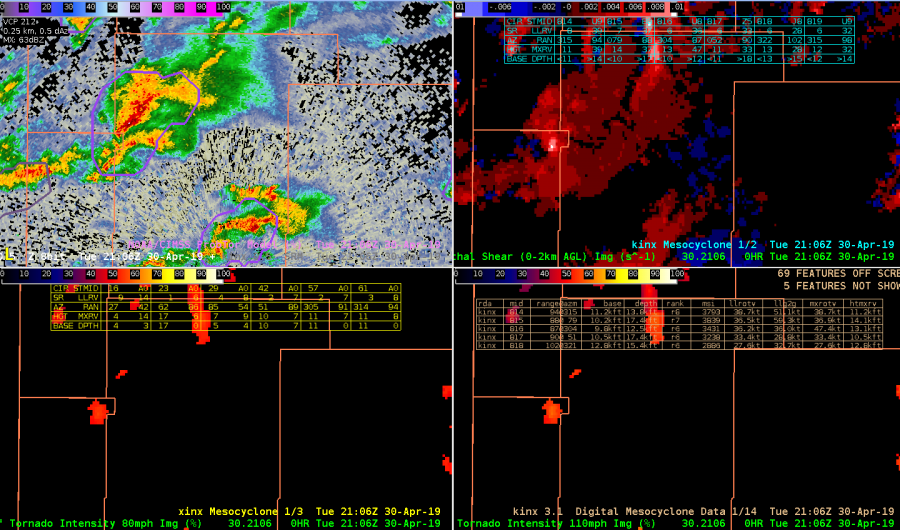
2106 UTC – just before storm merger see uptick in Azshear (0-2 km) with slight increase in CPTI products (50-52 %). DMD output not providing any useful information on these storms at this time probably. ProbTor ~ 10%
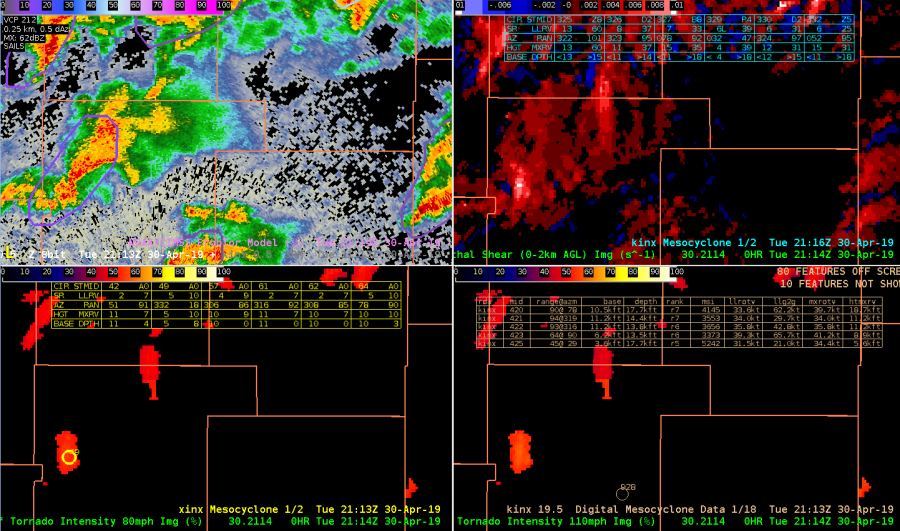
After merger @ 2114 UTC although not much change in AzShear, CPTI probabilities do increase some to 55 to 60%. Note that only the XDMD mesocylone algorithm displays a mesocyclone icon at this time while legacy DMD products do not.
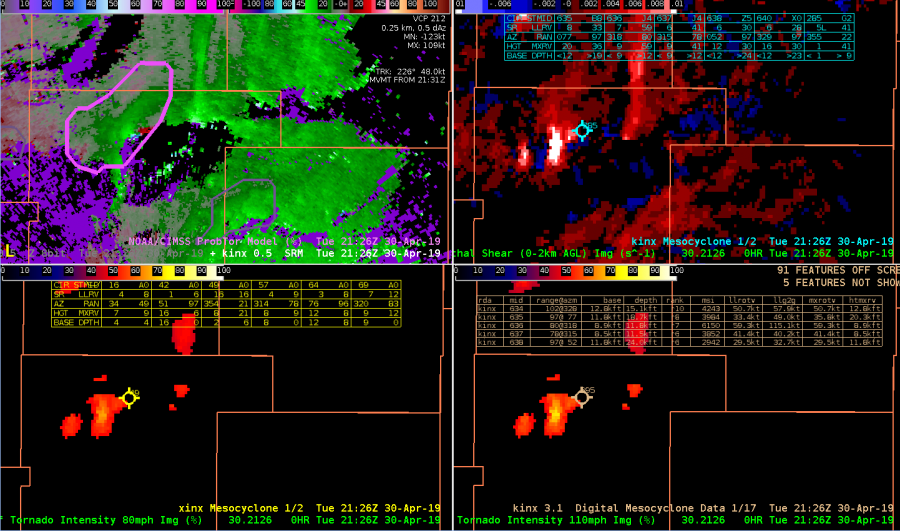
2126 UTC – ProbTor rapidly increased to 77% with marked increase in AzShear. CPTI products also near 70% (110 mph). Now all three DMD products display icon by this time. BUT the XDMD seemed to identify mesocyclone sooner than legacy products. This was encouraging.
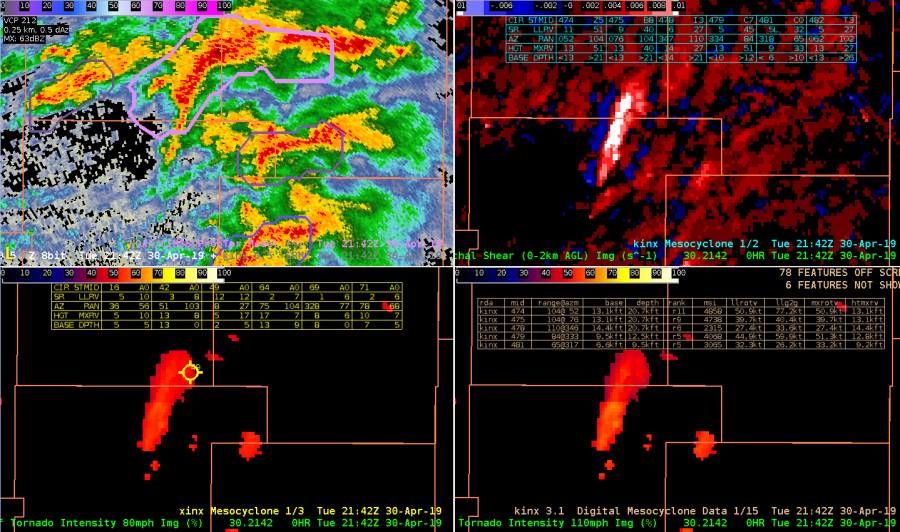
2142 UTC – looks like storm looses organization as inflow may have been disrupted. AZshear becomes elongated with CPTI values falling notably. Encouraging to note the character of AzShear (became elongated ) was consistent with the less organized storm (velocity structure). ProbTor falls to ~ 65%. Note the xDMD algorithm did still correctly identify shear couplet (SRM not shown) where legacy algorithm fails. XDMD performed much better and and had greater temporal continuity than legacy product in this example. In this more complex storm interaction example appeared XDMD was able to better identify and retain areas of shear/rotation compared to legacy.
-Quik TWIP
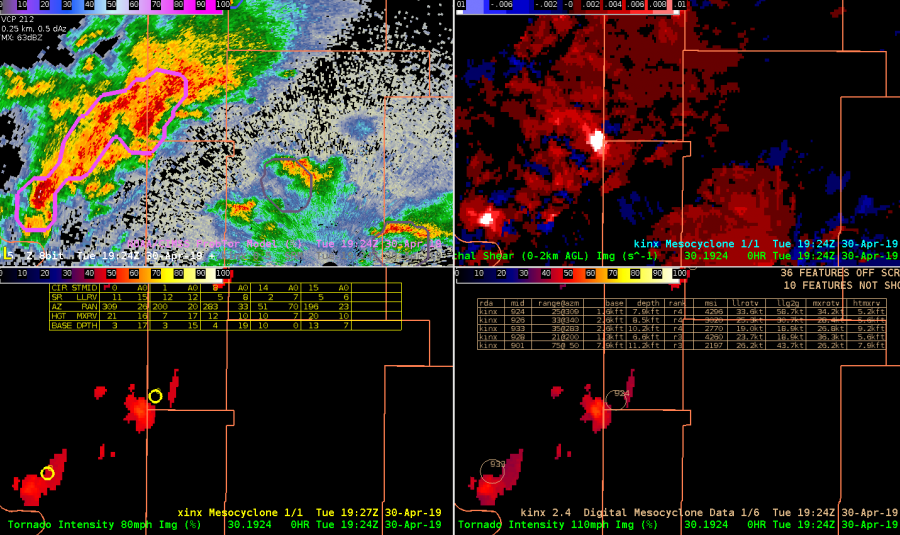
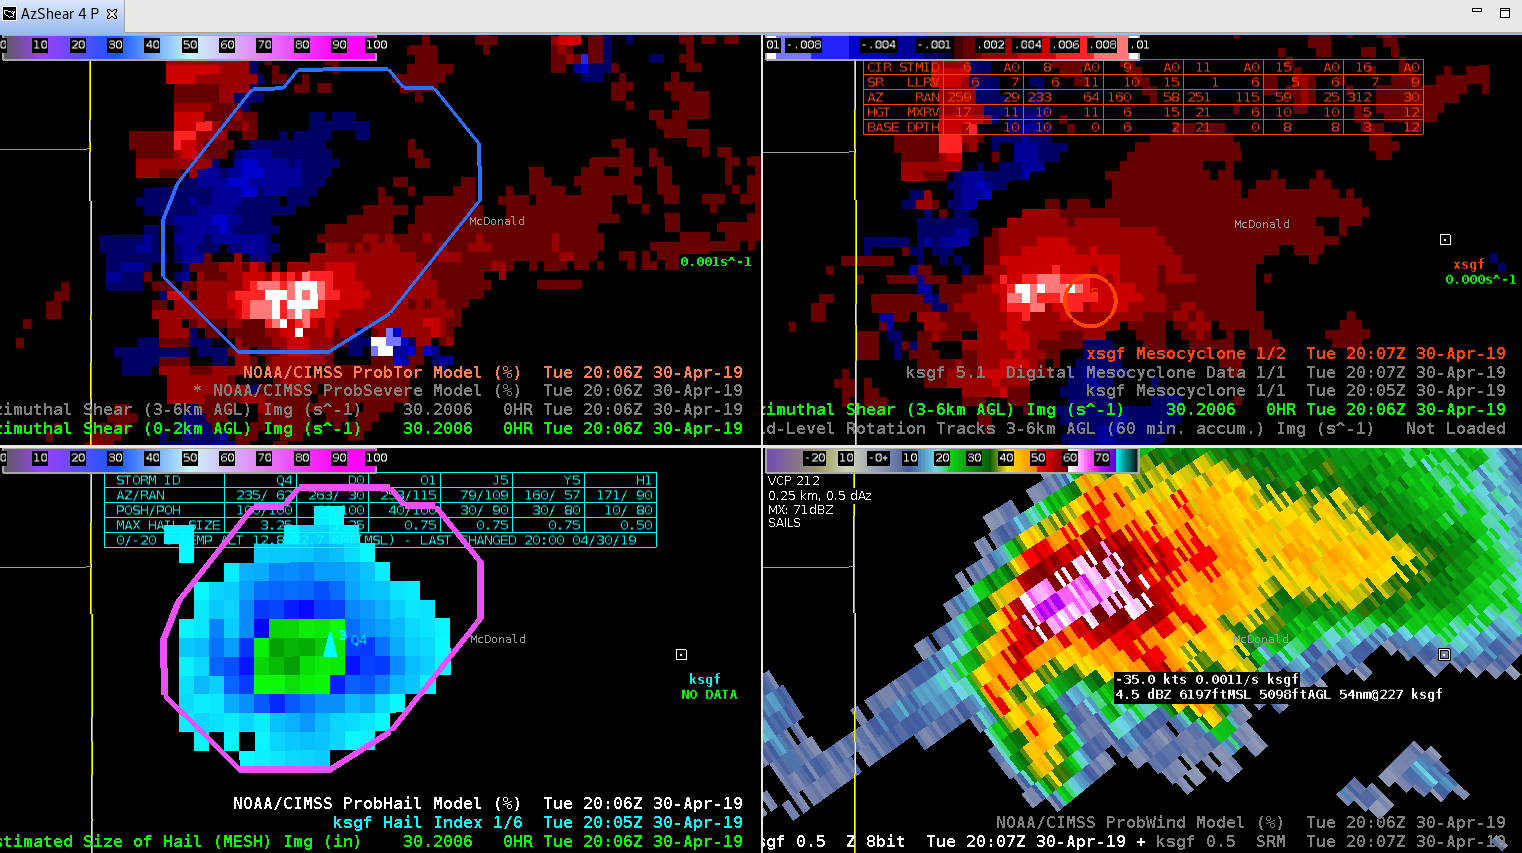
Tracking this northern most SC @ 1926 UTC prior to tornadogenesis. Azshear 0-2 km product did a nice job highlighting shear with developing storm very early on in storm evolution and was very persistent in highlighting area of shear throughout. Temporal continuity was very good. Lower two panels are 80 and 110 mph intensity probabilities. Used this 4-panel to monitor evolution. Also displayed is legacy mesocyclone (upper-right), DMD (lower right) and XDMD l(lower left). This SC also exhibited well-organized ZDR arc and KDP foot (not shown) that whose centroids were normal to storm motion suggesting MC intensification was likely.
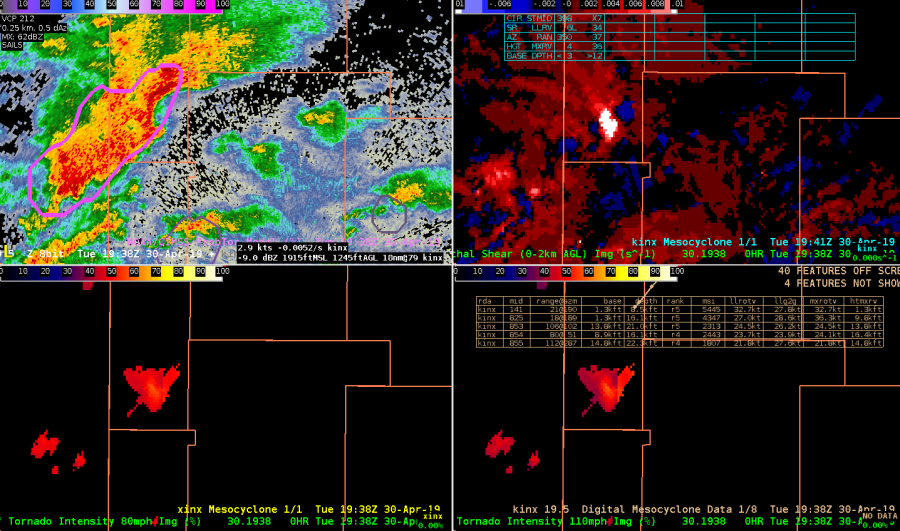
1938 utc Azshear still showing strong signal with CPTI gradually increasing to near 60%. ProbTor increased to 78% as well. DMD, XDMD and MD not showing much and did not seem to be very helpful.
CPTI was insightful with increasing probabilities of tornado intensity probabilities at higher speeds (110 mph lower right). Note that XDMD was also indicating MXRV of 26.
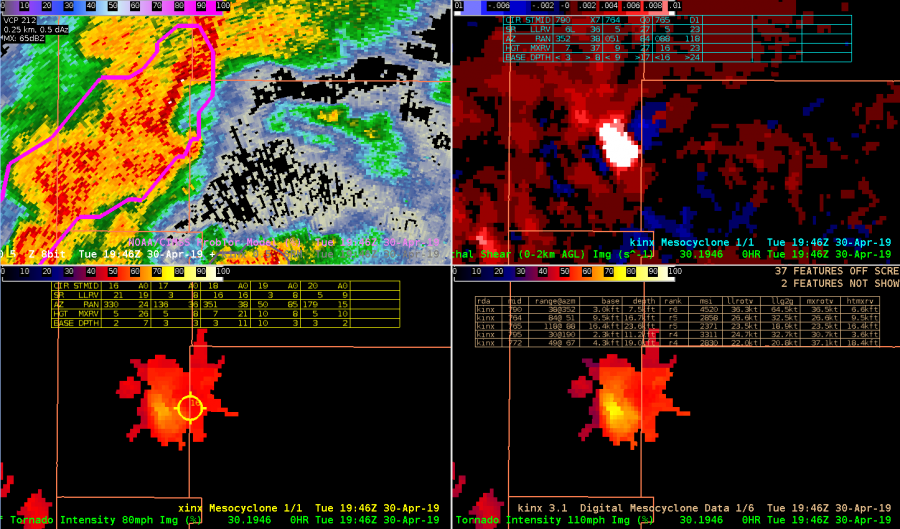
1448 UTC – would occasionally see dual maxes in AZShear and CPTI products that was a bit of an issue at times.
CPTI 110 probablities up to ~ 75 % at this time (lower right)
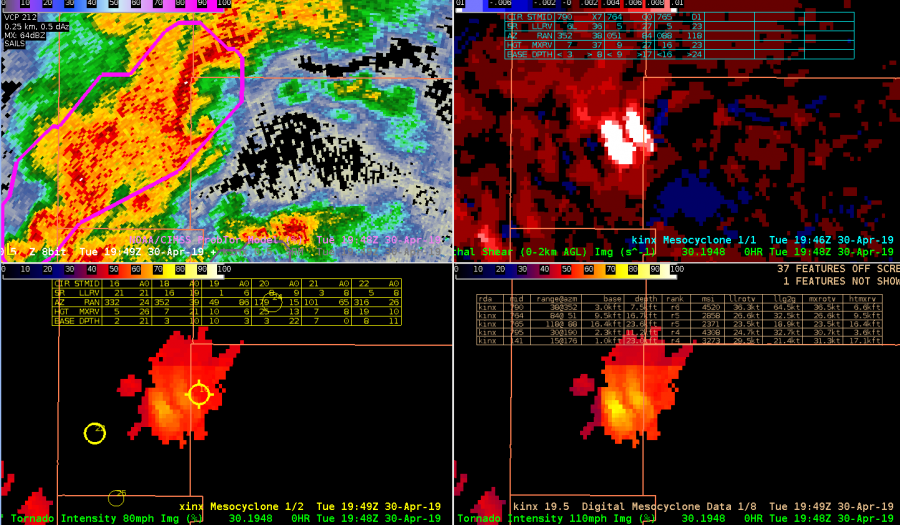
Overall…0-2 km Azshear was quite helpful in quickly grabbing attention to areas of concern. 0-2 km product was temporally very consistent. Its location relative to developing Mesocyclone was typically off…but still very useful. XDMD, did seem to perform better than legacy DMD products but not much at least with this storm. Early in storm evolution, examining ZDR/KDP centroids relative to storm motion was also helpful as a reality check on MC intensification and increasing SRH with this particular storm. Bottom line was generally pleased wiith AzShear and CPTI performance for this storm. – Quik TWIP
ProbTor jumped from 37% to 74% over an 8 min period with the circulation over SW MO as a TDS became evident and a tornado was reported.
–SCoulomb
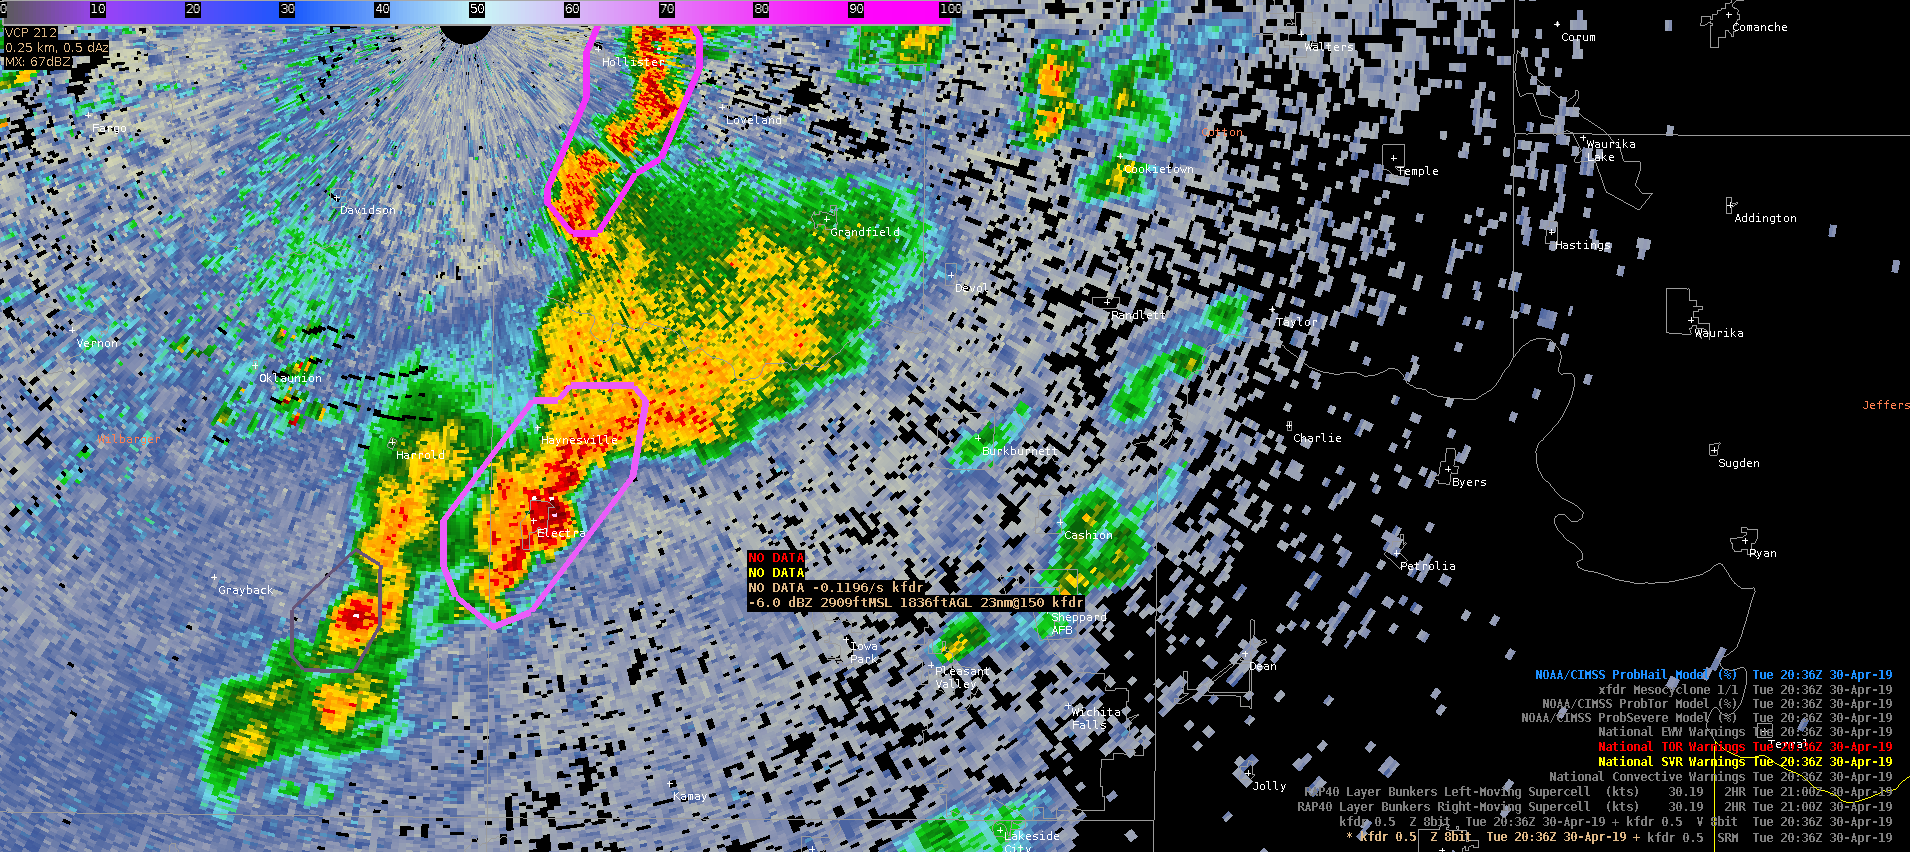
At 336pm CDT, a supercell storm near Electra, TX produced golf ball sized hail despite MRMS MESH showing sub-severe hail (~0.85″). Despite the low MESH, ProbSevere hail was progged at 75%. KFDR data had 50+ dBZ above 34K feet MSL and the storm was highly tilted downshear (a known limitation of MESH – underestimates in this case). This storm highlights the need to couple MESH/ProbSevere products with a thorough analysis of the base radar data and a fundamental understanding of strengths and limitations of supplementary datasets.
–Stanley Cupp
AzShear increased ahead of an approaching tornadic storm. At the same time the CPTI product also indicated an enhanced probability in the same area. Velocity data in the lowest few tilts became suspicious along the radials ahead of the storm as PRFs struggled to improve range folding.
— SCoulomb
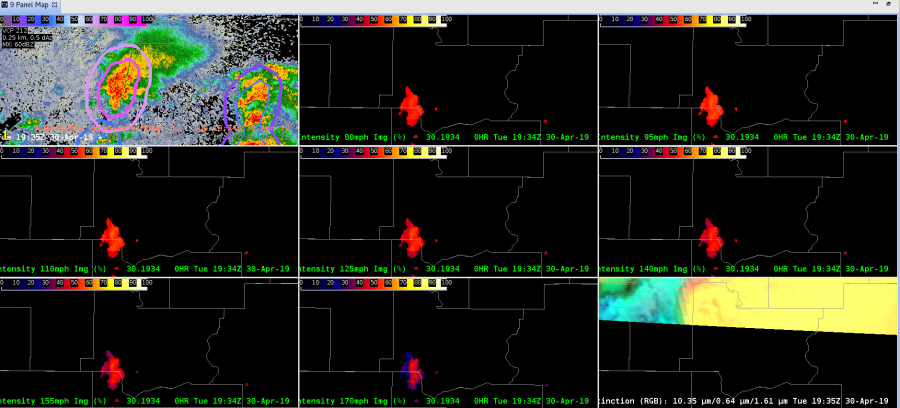
Two supercells developed in far southwest Oklahoma along 0-3km CAPE gradient. At 1957Z ProbSVR Hail 10% Wind 39% Tor 3%, then 6 minutes later at 2003Z ProbSRV Hail 63% Wind 75% Tor 5% on the southern storm. GLM Total Optical Energy in lower left image performed well with the increase in lightning activity for both supercells. -Jake Johnson
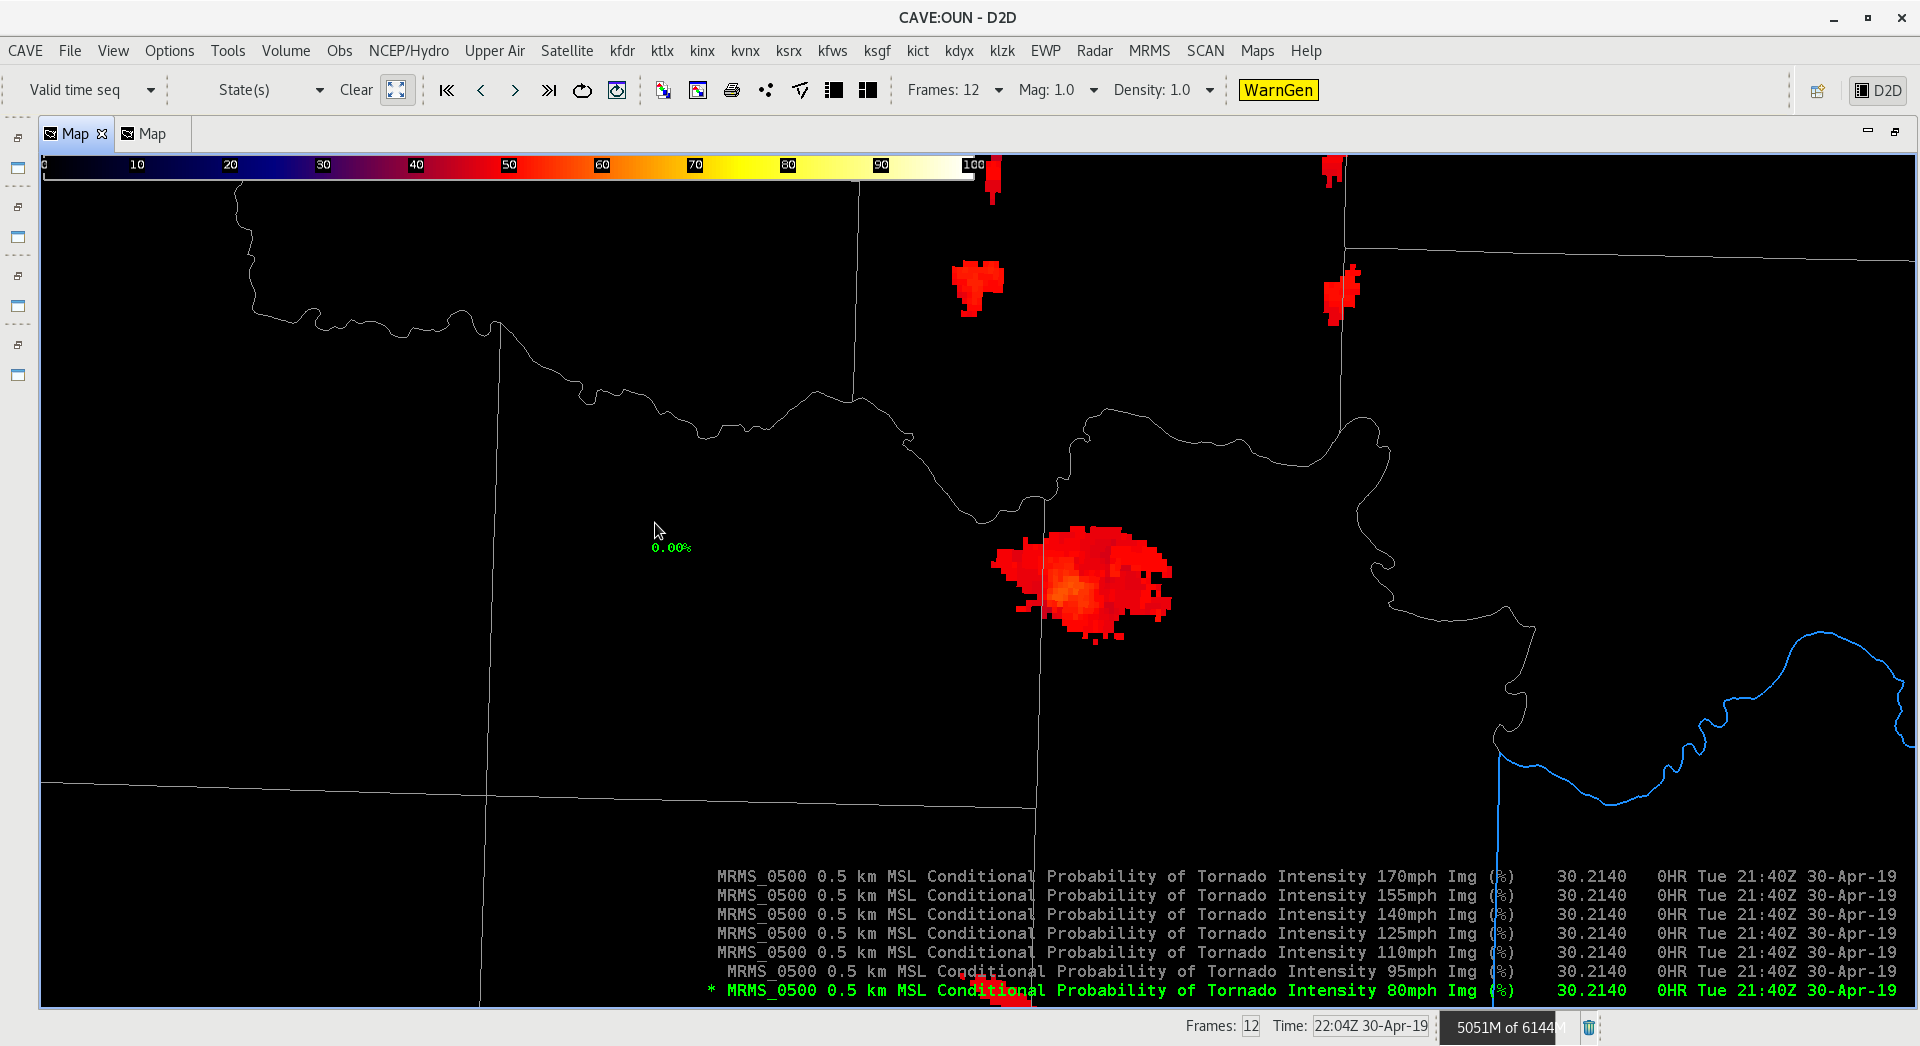
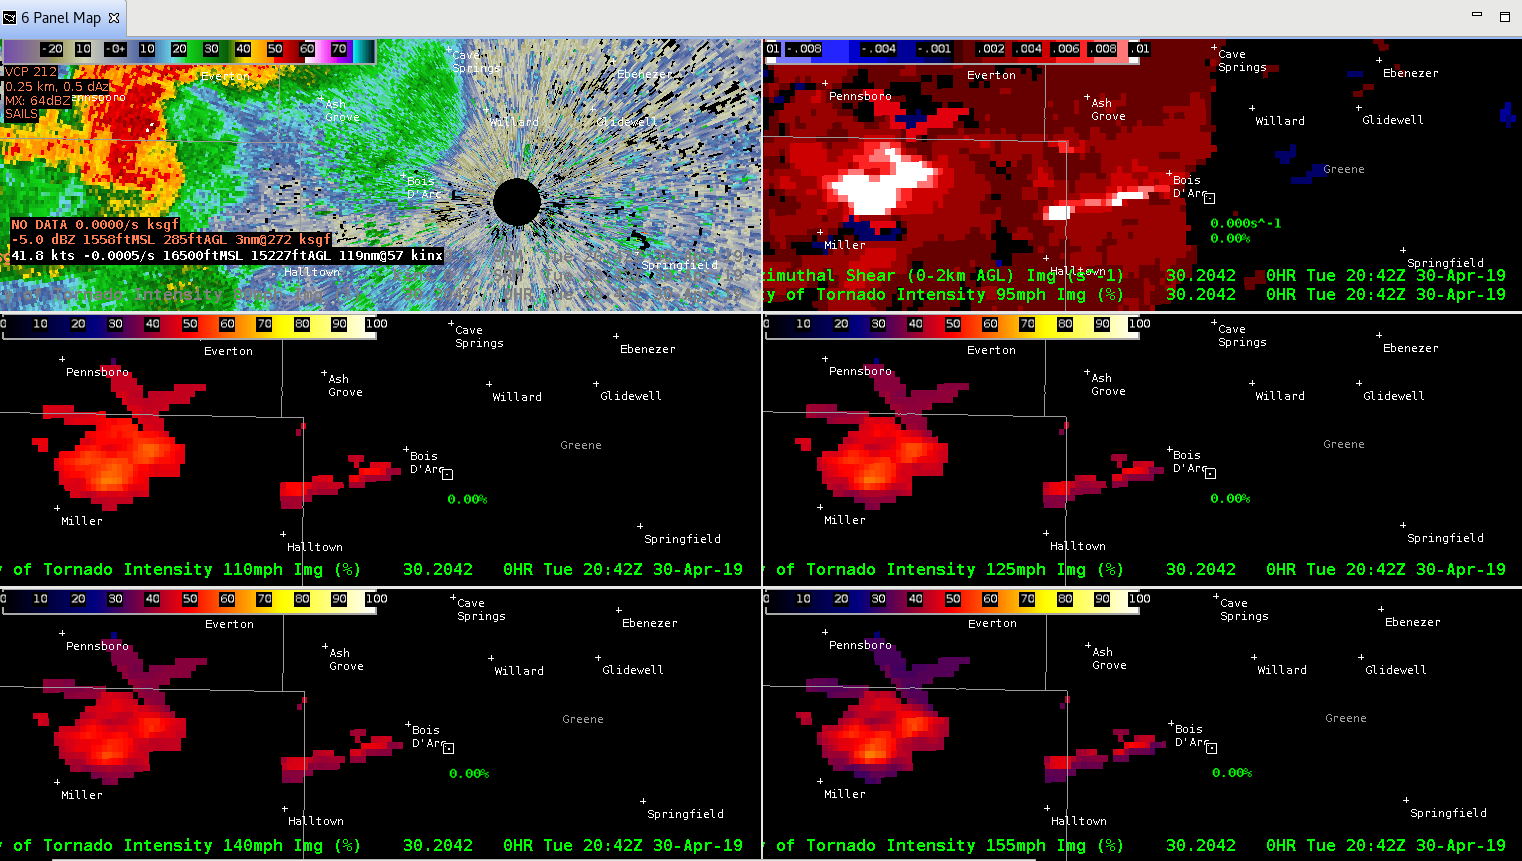
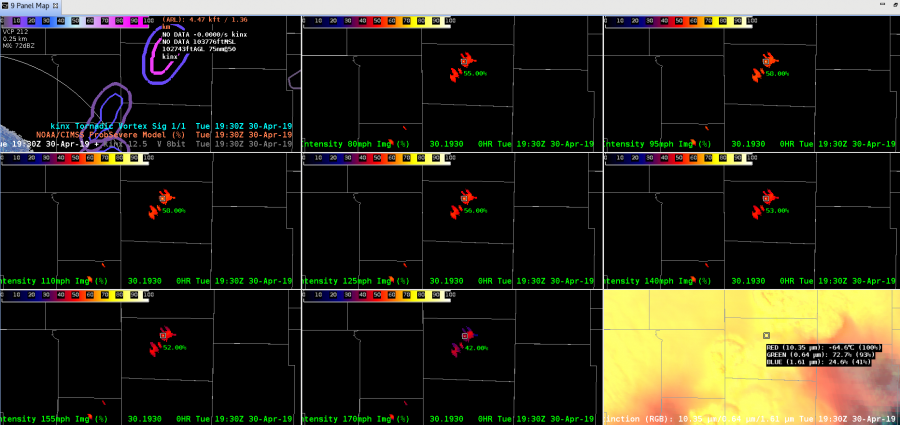
Here’s a look at some attempts to use the CPTI for storm carrying a theoretical tornado warning. I have a fair number of thoughts on the product. In terms of a primary application. I think it would be best suited to the first update/continuation on a tornado warning. Basically allowing you to chose what types of language to use…if the CPTI is picking up on a very high intensity circulation than you are going to want to ramp up the intensity of the wording within a warning. This could be used to communicate how dangerous a storm is. Especially since the damage associated with a 80mph circulation will be drastically different from a 170+ mph circulation.
Now for areas that I would improve/and or change. The CPTI might be better off using a category scale/range of values. Intuitively, I would expect probabilities to increase if the storm is more intense. I.E. if the circulation is 155mph then I might expect the 80mph CPTI to be close to say 80% while the 155 mph CPTI is something like 50%. If the tornado intensifies maybe the 80mph CPTI would increase to something like 95% while the 155 mph CPTI increases to a value such as 75%. Currently, there are a lot of very similar values as the image below shows 80, 95, 110, and 125 mph all have pretty much the same value within 3% of one another. I would want there to be a much larger variance in these values, so that I could easily gauge , how intense the tornado is. I think CPTI has a great potential, but I would change it so that it was more of an probability of exceedence scale and could be used as a quick product to determine intensity wording in products.
South Beach
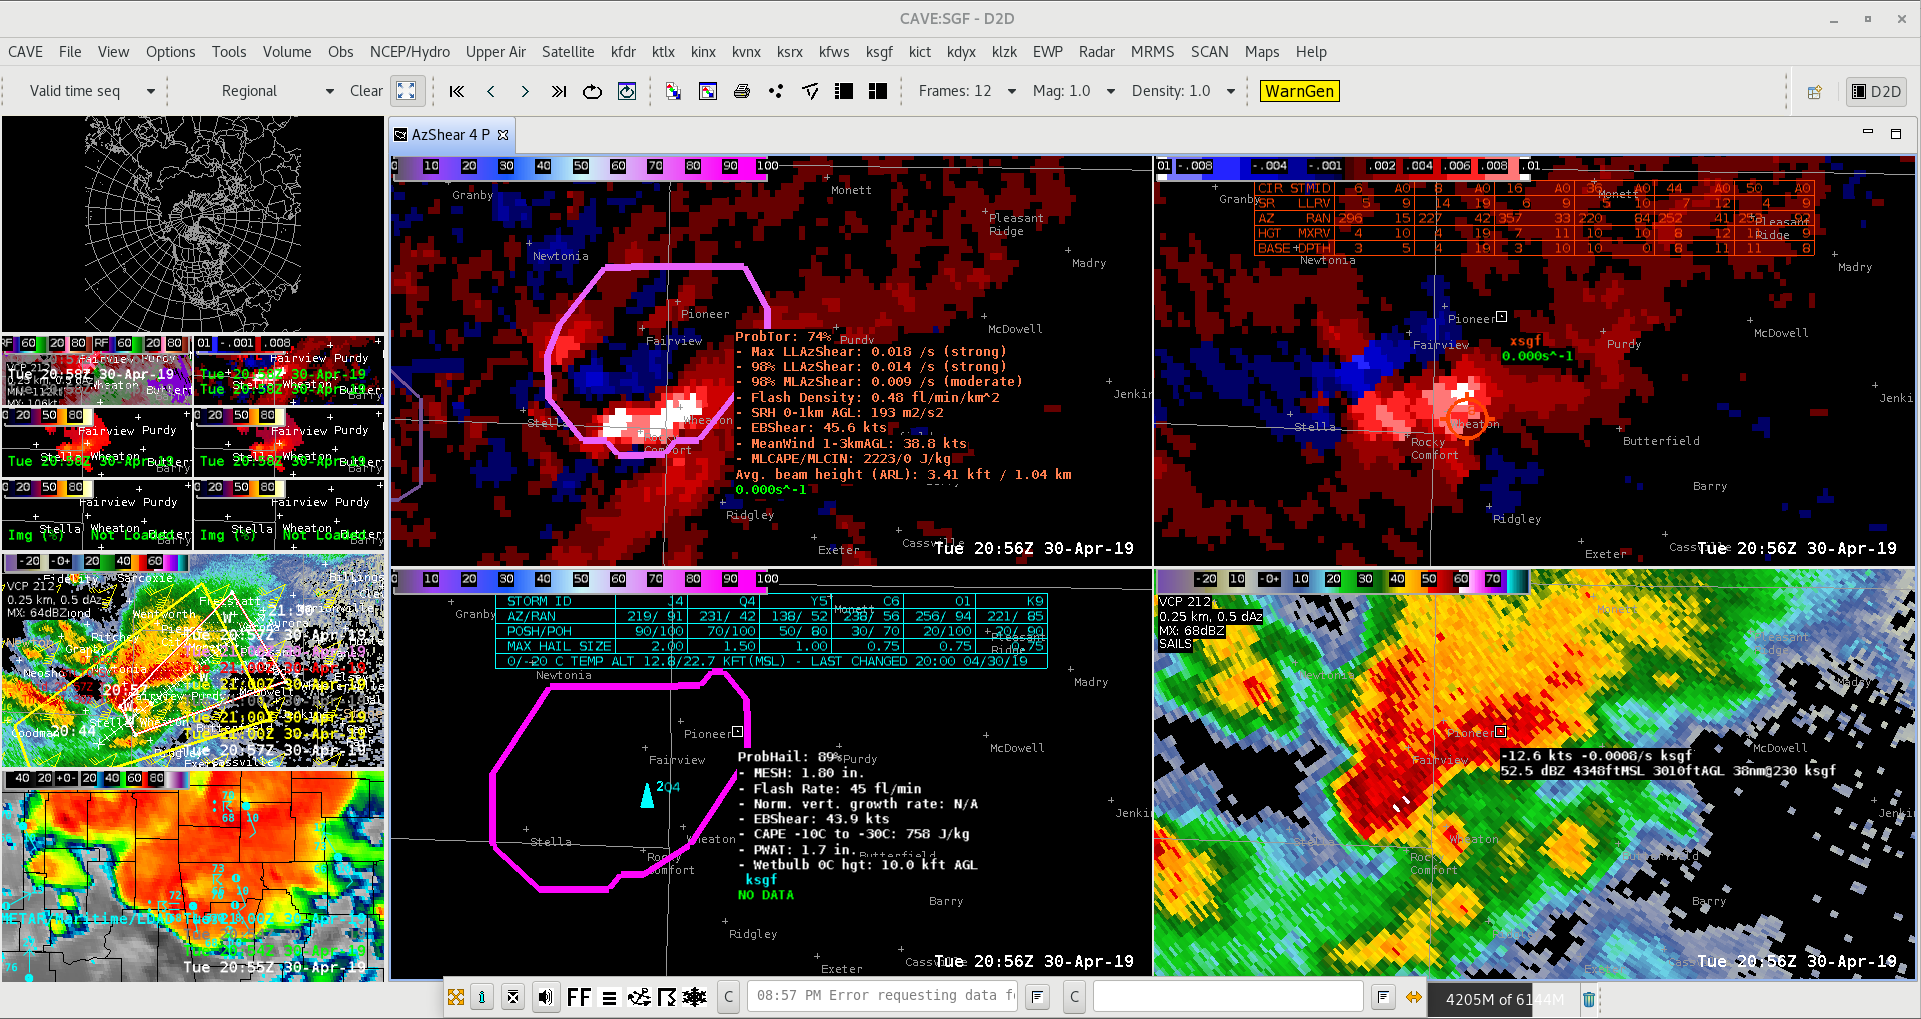
ProbHail on the storm in southwest MO seemed to be too low based on other derived parameters (MESH/Hail Index) and storm structure. ProbHail was consistently 70-75%. It was explained that the hail cape (~750 J/kg), the EBShear (47kt) and lightning (29 flash/min) were relatively lower than one would expect given the environment. Justin showed the parameter space for each of the ingredients and how they were weighting down the overall ProbHail due to the ratios being <1.
— SCoulomb