

The AllSky H9 PW product showed good advancement of the dryline into West Texas today. Convection quickly developed as the dryline advanced into the Panhandle. 
Category: Live Blogs
Real-time posts made during testbed nowcast and warning operations.
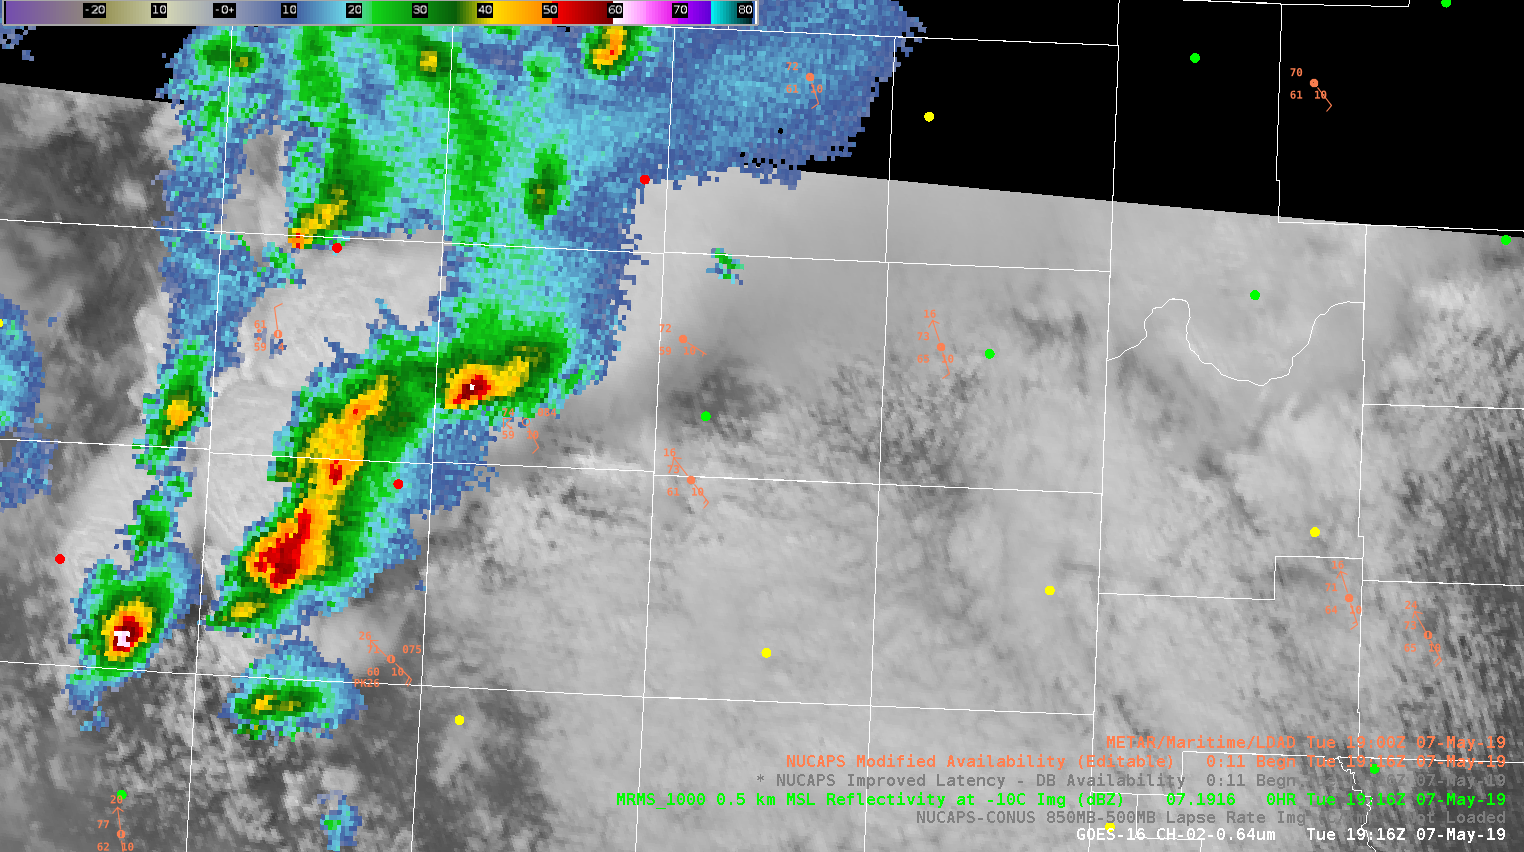
NUCAPS Lapse Rates
As an operational forecaster, I like to compare model output, real-time obs, and any additional derived data. This image from the NUCAPES H85-H5 Lapse Rate can potentially help boost one’s confidence in particular synoptic situations. For example, suppose you were expecting a dryline to emerge east across W Texas, but guidance indicated otherwise and sfc METARS were unavailable, using the NUCAPS Lapse Rate products can help determine the location of the dryline (for this particular setup). In this image, values reflect the drier air advancing east leading to steeper lapse rates. 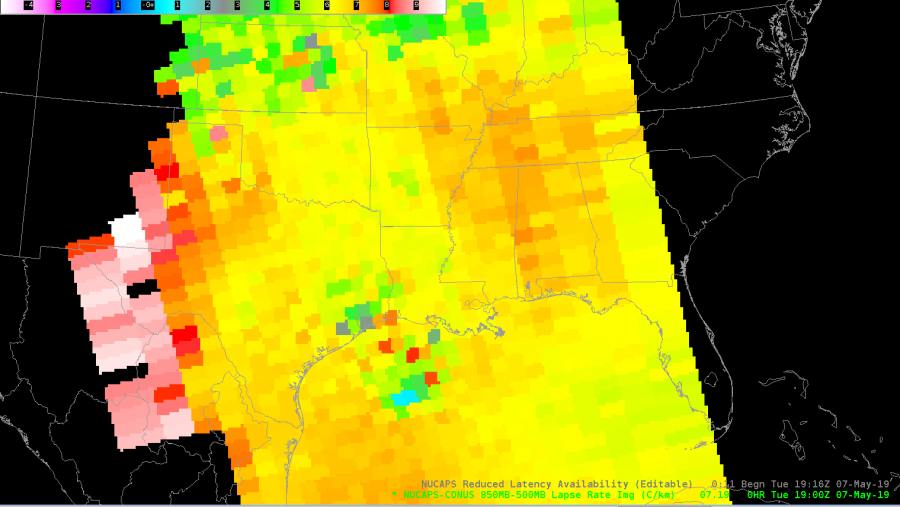
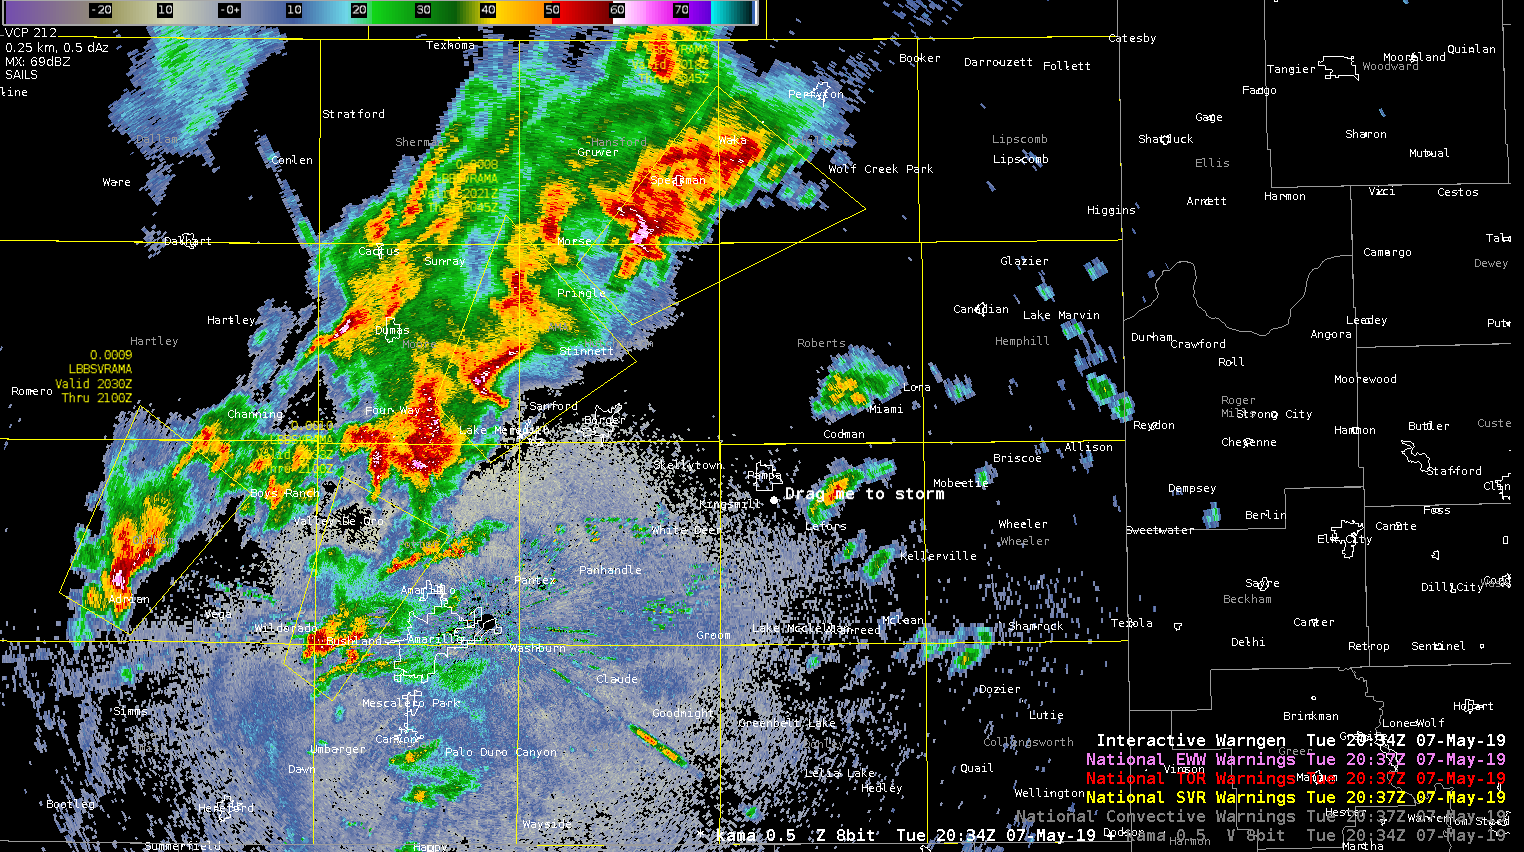
Used GLM to Issue SVR
I’d been watching a multicellular cluster that was trailing a leading supercell to the north of Amarillo. Had been waiting on issuing due to ProbSevere and Mesh levels, but GLM FED increased and reflectivity / VIL /core height all responded so I issued a warning at about 2040Z
GOES 17 May Have Better Angle of TX S Plains Storms
Due to the location of GOES 17 and GOES 16 , forecasters may want to consider the satellite’s angle of view for convection. In this example, GOES 17 has a better “viewing angle” into developing convection across west Texas. Optical brightness has been brighter than GOES 16 and a better output of Extent Density. 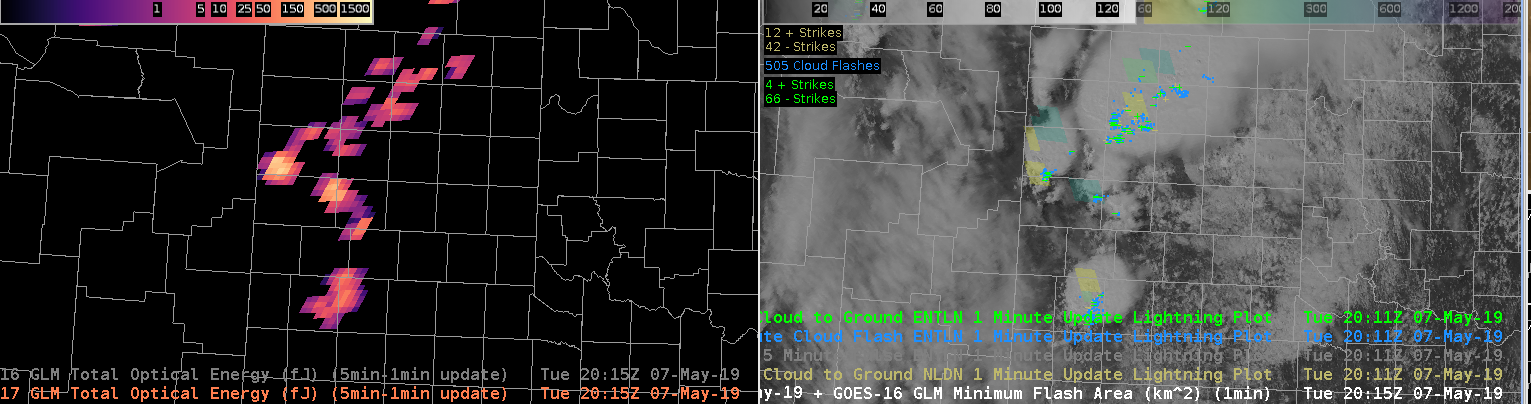
ProbSevere Progression with intensifying storm
I like seeing the progression of the storm on the ProbSevere page, showing the trends of developing convection. You can see how the increases of ProbHail and ProbWind parallel certain parameters like MESH, VIL, and Flash Rate parameters. It’s also interesting to see what’s not being utilized or loaded into the page such as Sat Growth Rate.
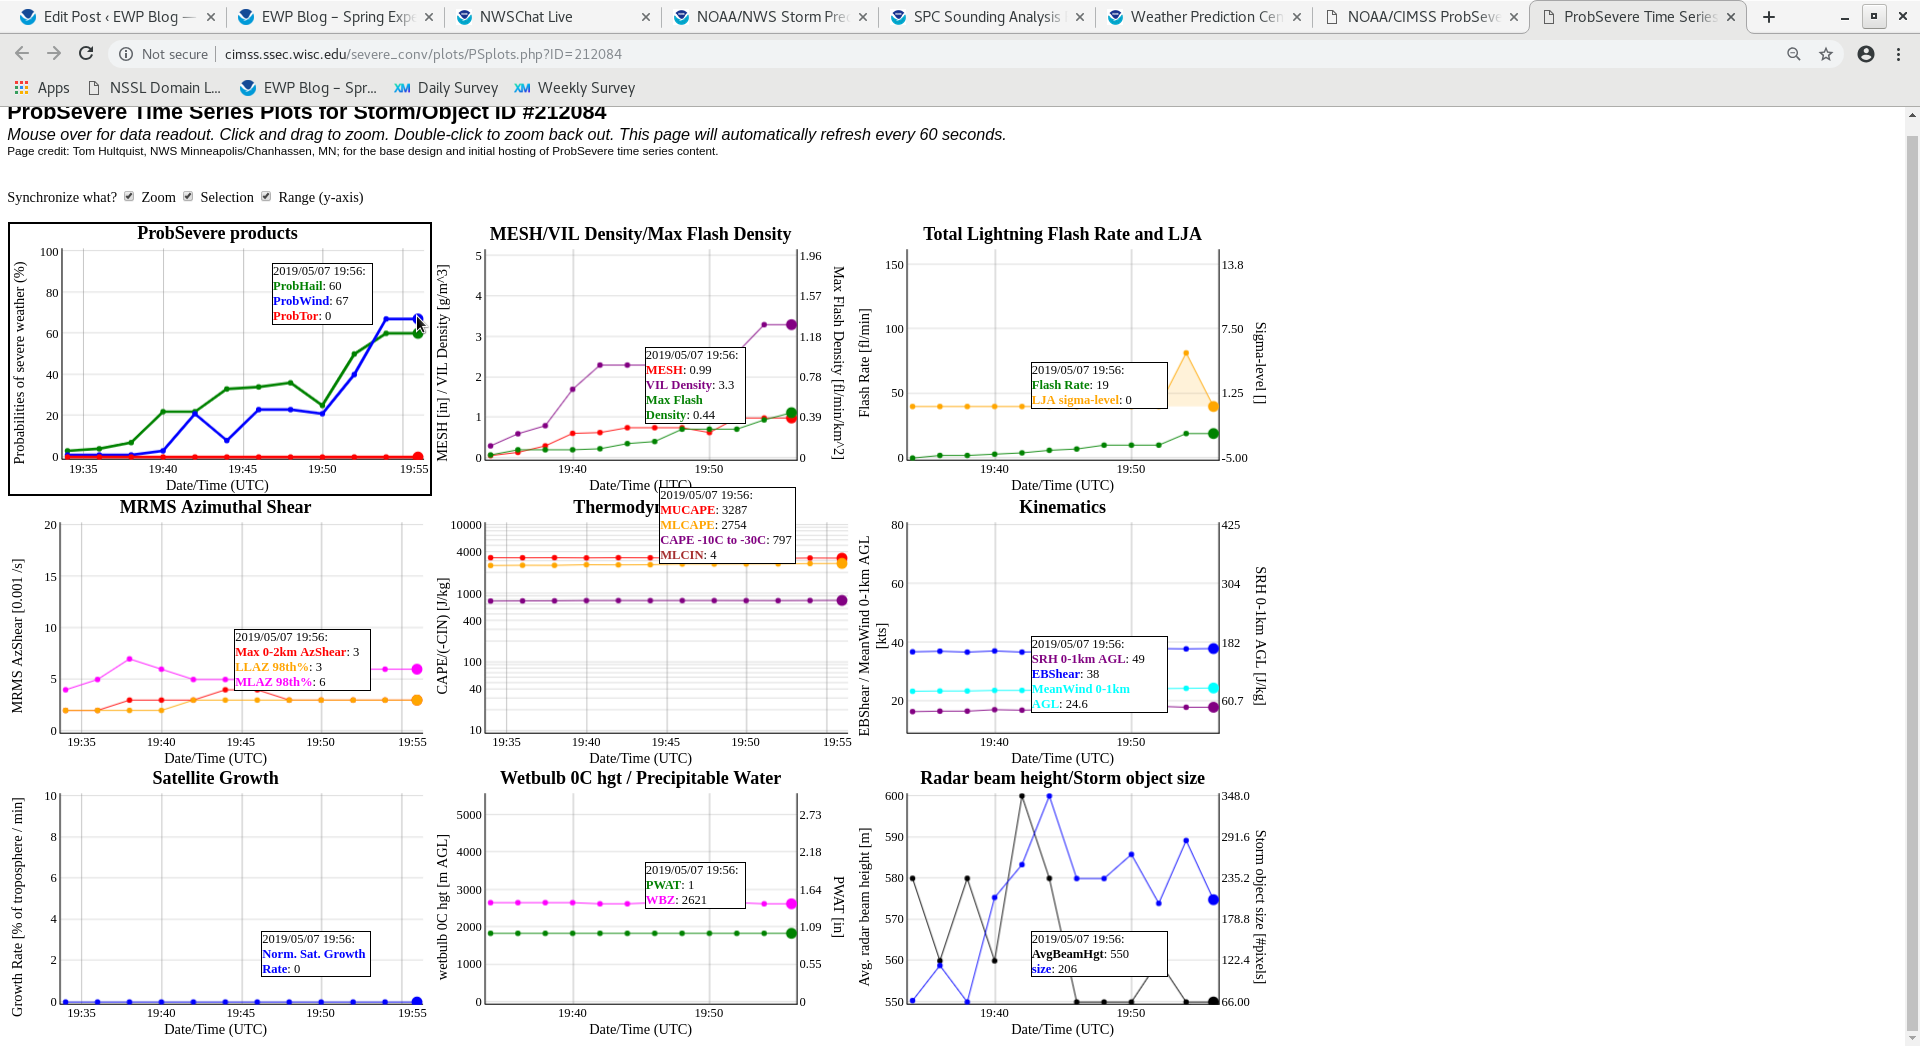
With some MRMS data being loaded into the ProbSVR model, one possible addition to the parameters could be Vertically Integrated Ice (VII) vs VIL. Have found in operations to be a very good indication for strong updrafts above the FZL. Hail and Wet Downbursts have been correlated with very high values of VII (above 25-50 kg*m^-2).
#ProtectAndDissipate
Modified NUCAPS Representing boundary layer well
NUCAPS modified sounding doing a good job of representing the boundary layer in the near storm environment in the AMA CWA. Green dot ahead of cell in middle of image was selection point for provided sounding.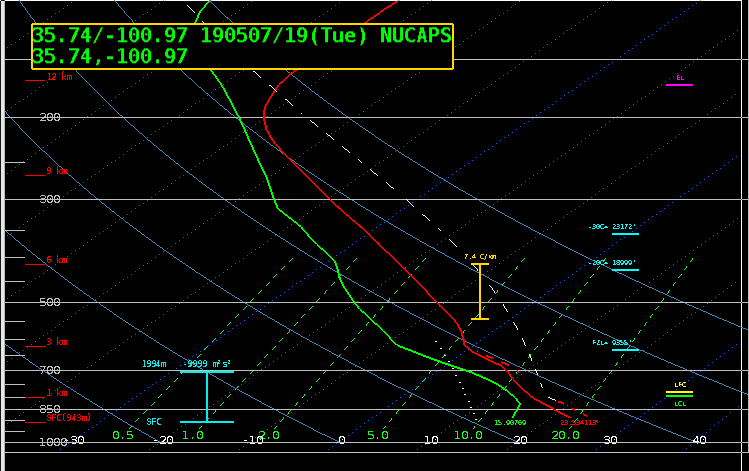
icafunnel
Dryline Progression with AllSkyLAP
Noticed a glitchy progression in the AllSkyLAPs 900mb PWATs. Believe this might be from an updating GFS guidance, but this also occurred at a time when the areas west of the LUB CWA were transitioning from about half Cloudy, half GFS to mostly GFS. However, the updated location of the dryline was a closer approximation of the location of the dryline at the given time.
#ProtectAndDissipate
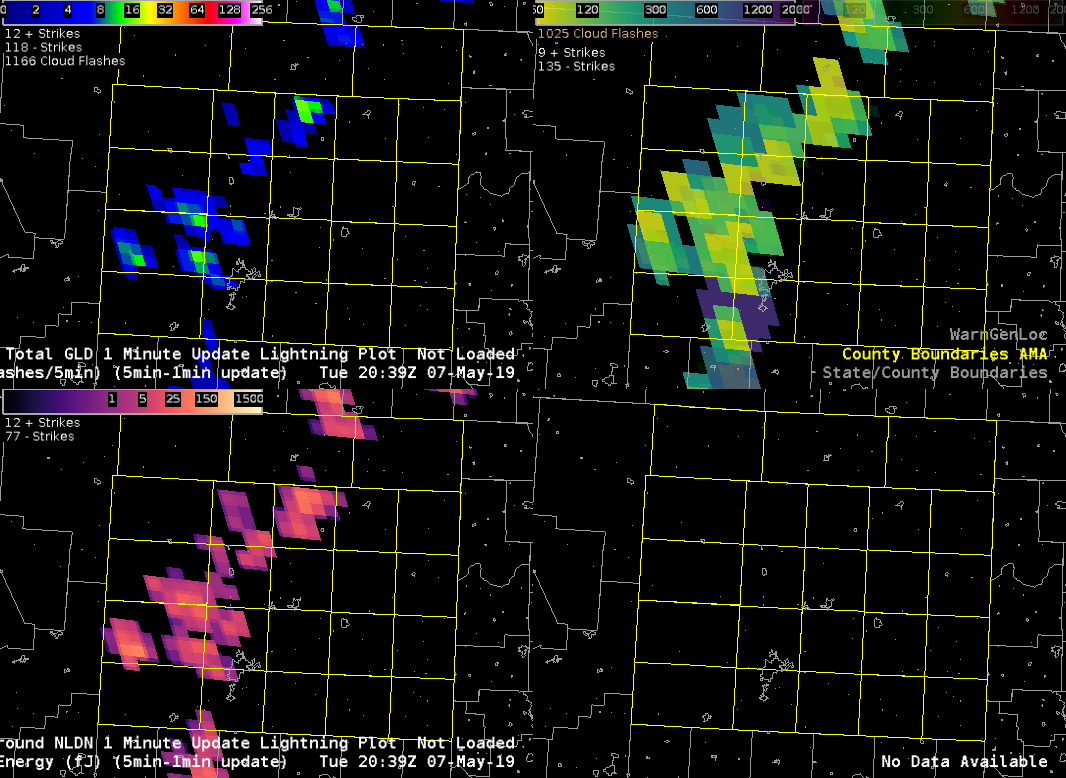
5-Minute with 1-Minute vs. 1-Minute GLM Min Flash Area
So, the first thing looking at today is the best way to display Minimum Flash Area. This is a nice addition to the Flash Area products and seems to have some utility in displaying the state of convective growth. As a reminder, smaller flashes are usually indicative of new or strengthening convection while larger flashes are mature/decaying/sustaining stages of convection. This will come in handy with a lot of convection to see which cores may be the strongest in any given area.
The problem is the best way to view this information; the 5-minute with 1-minute updates seems to have worked well in the past for most of the GLM data but seems to cause some problems with the Minimum Flash Area. Case in point, here is a 4-panel with the 5-minute/1-minute update from the Texas Panhandle north of Amarillo (TL – Flash Extent Density, TR – Minimum Flash Area, BL – Total Optical Energy, BR – empty; note, non-default color tables on the top row!):
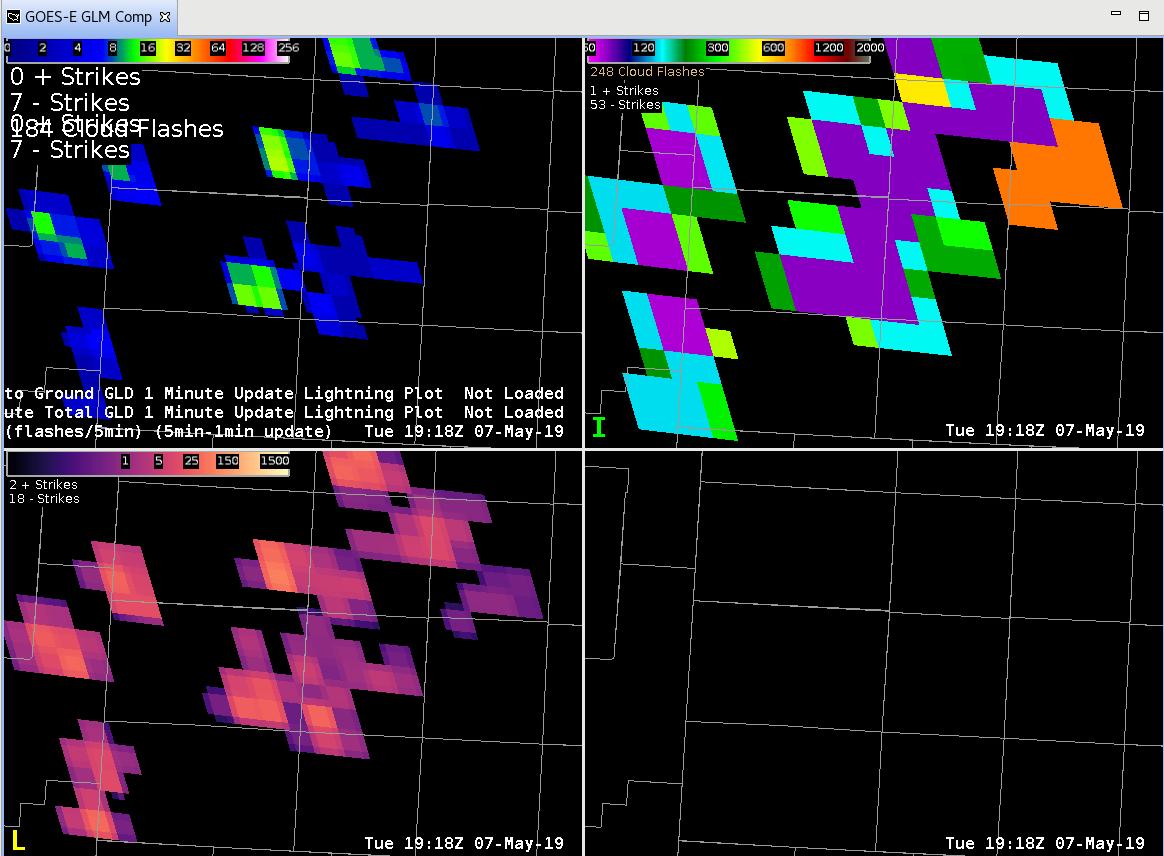
Wow! That’s a pretty large area of small flashes (purple). BUT, it’s a total from the last 5-minutes so storms could have moved, strengthened, weakened, dissipated, etc. in that time. What does the “regular” 1-minute plot look like?
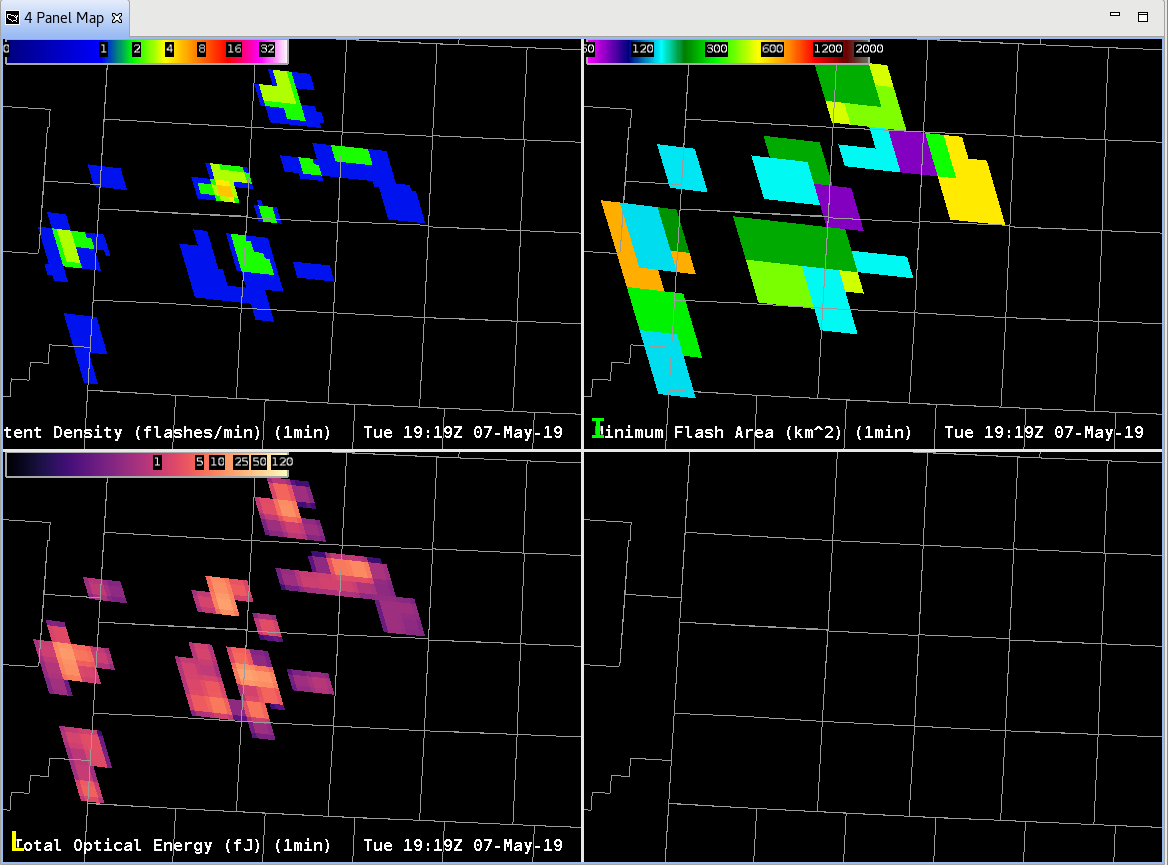
Huh? Where did all the small flashes go? Well, the small flashes (purple) in this case are likely where the GLM is seeing the strongest updates in the last minute, not the last 5 minutes.
Something to consider when looking at rapidly developing convection, storms that are moving fast, or storms that are pulsing with rapid time intervals; the 5-min with 1-min update can mask important details when it comes to storm electrification!
-Dusty
ProbHail Detection shows increased accuracy over MRMS MESH
LSRs showed 1.5″ hail fell in Dumas, TX. Just beforehand ProbHail increased to 83% just beforehand. MRMS showed some spotty 1+” calculations but only to the SW of Dumas. Flash Rate also showed an increase just before the Severe Hail fell in Dumas.
#ProtectAndDissipate
GOES All Sky LAP TPW and CIRA Merged TPW Cloud Mask Differences
At 22 UTC on 6 May 2019, the All Sky LAP and CIRA Merged TPW Data type products show differences in the cloud mask. A shallow Cu field over NC / SC is indicated in GOES visible imagery,. The data type masks of the two products (blue = clear; yellow / gray = clouds) show some clouds in the All Sky LAP mask, while the CIRA Merged TPW mask does not have these Cu detected. This is likely due to the lower resolution (~ 15 km) of the GOES-16 TPW data used in Merged TPW versus the All Sky LAP resolution.
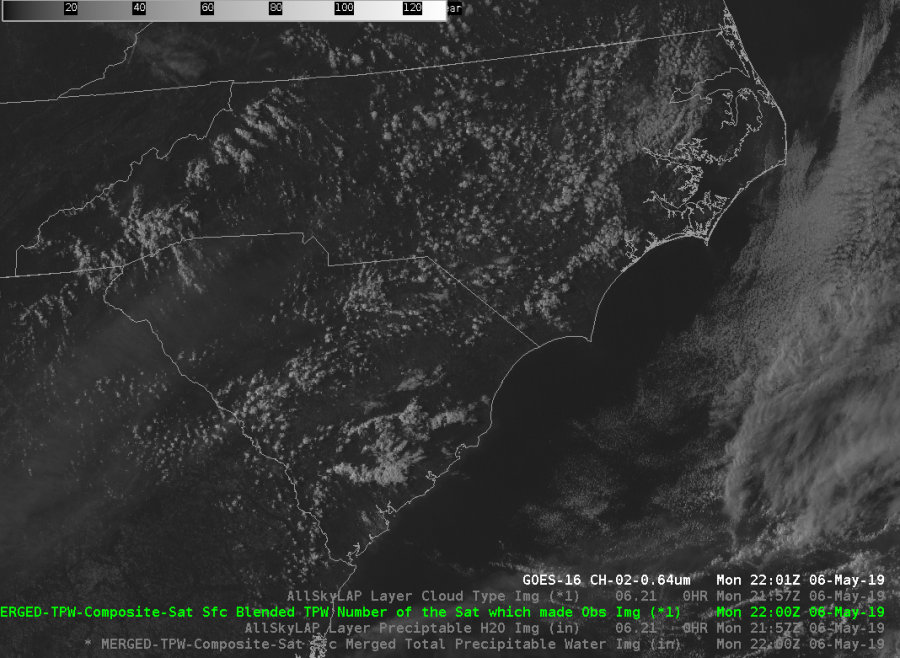
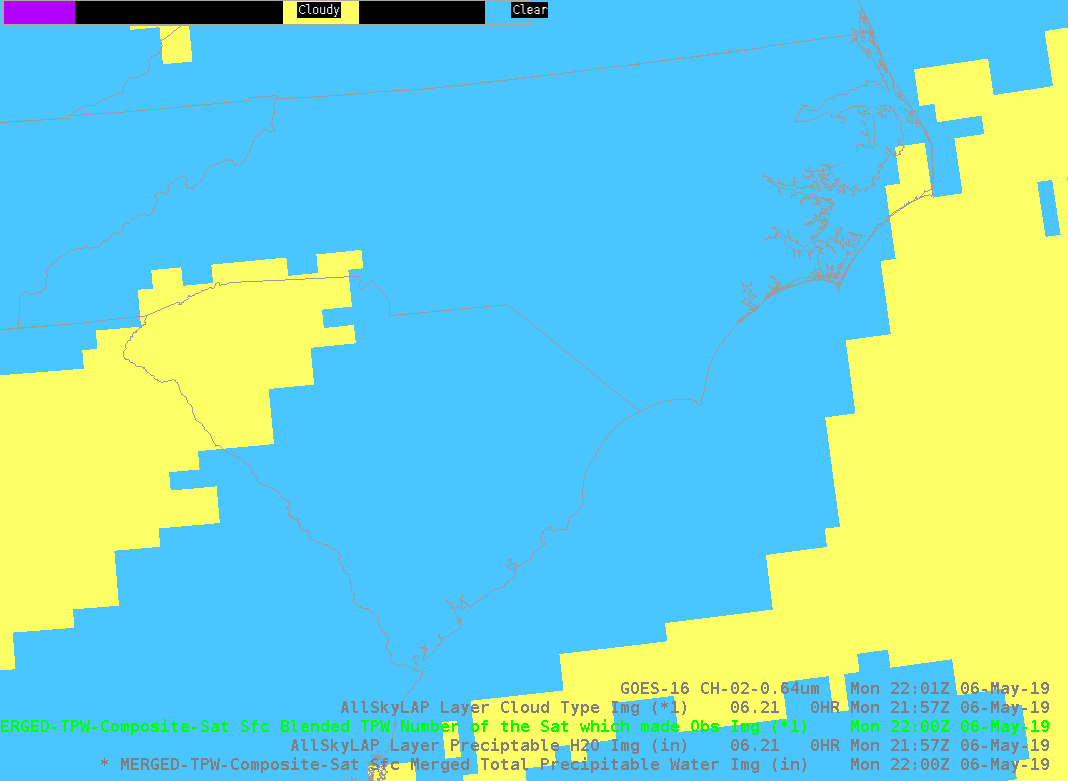
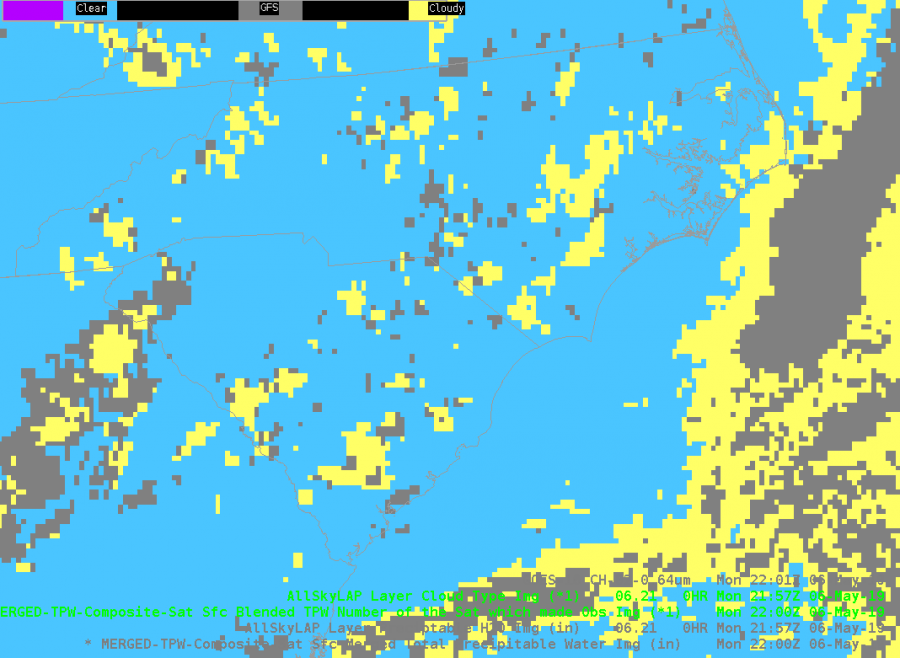
GOES-R TPW has a nominal resolution of 10 km.
JohnF