

Images from the LAP algorithm show a strange decrease in overall CAPE across the interior of south Florida ranging from 16z-18z. CAPE falls from over 2000 J/kg at 16z to around 500 J/kg at 17z and 18z.
Category: General
General Information and News
CI Continues to do well in south FL
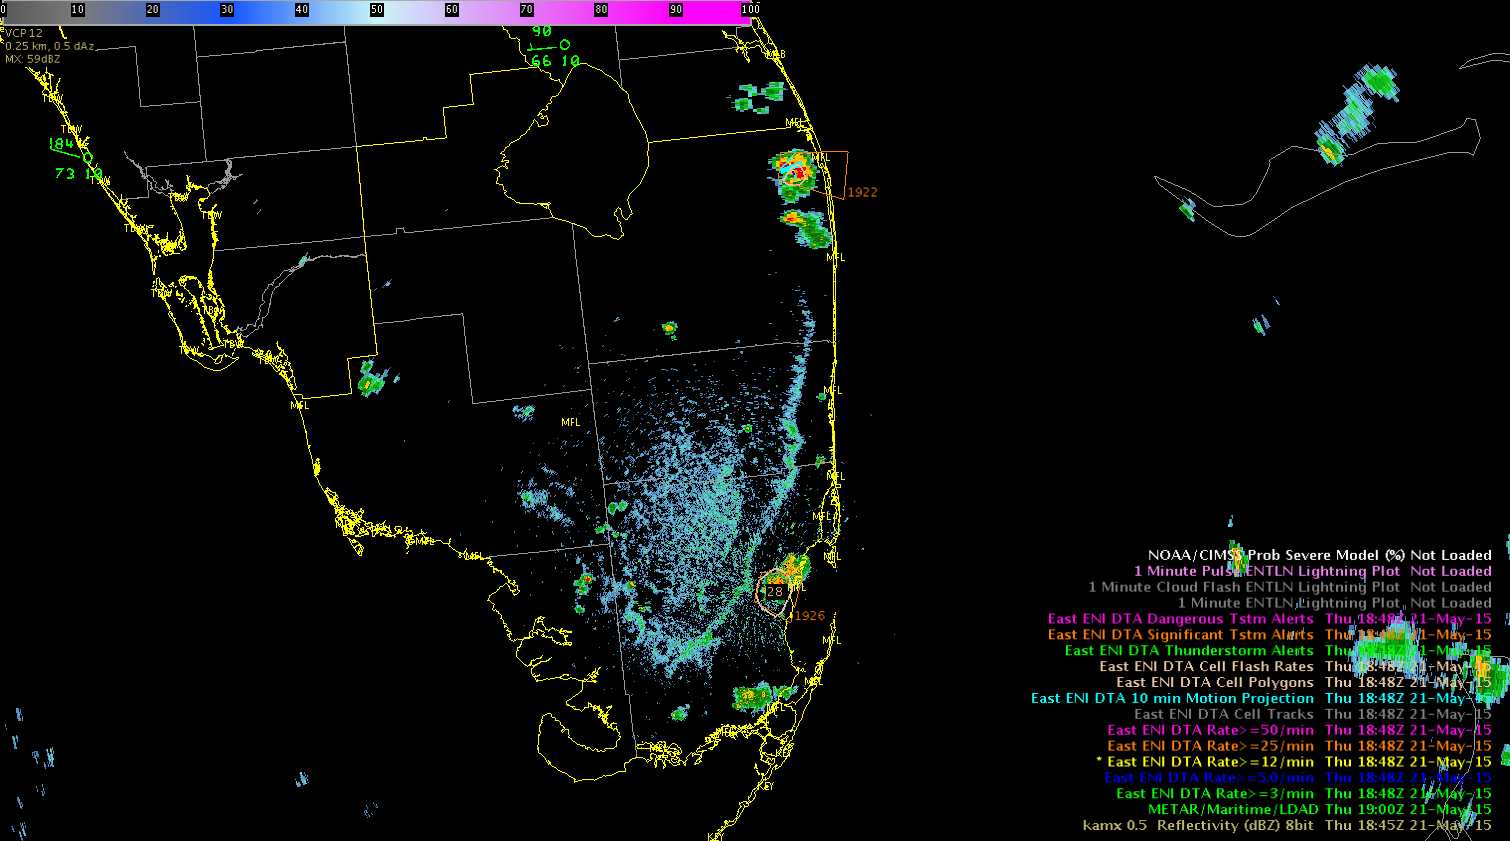
CI at 1830UTC shows an area of 83% (orange) and an area of 90% (red). Showers popped up on radar in both these locations as seen in the radar image at 1845UTC. There was also a good upward trend in CI values leading up to this.
-snowstrm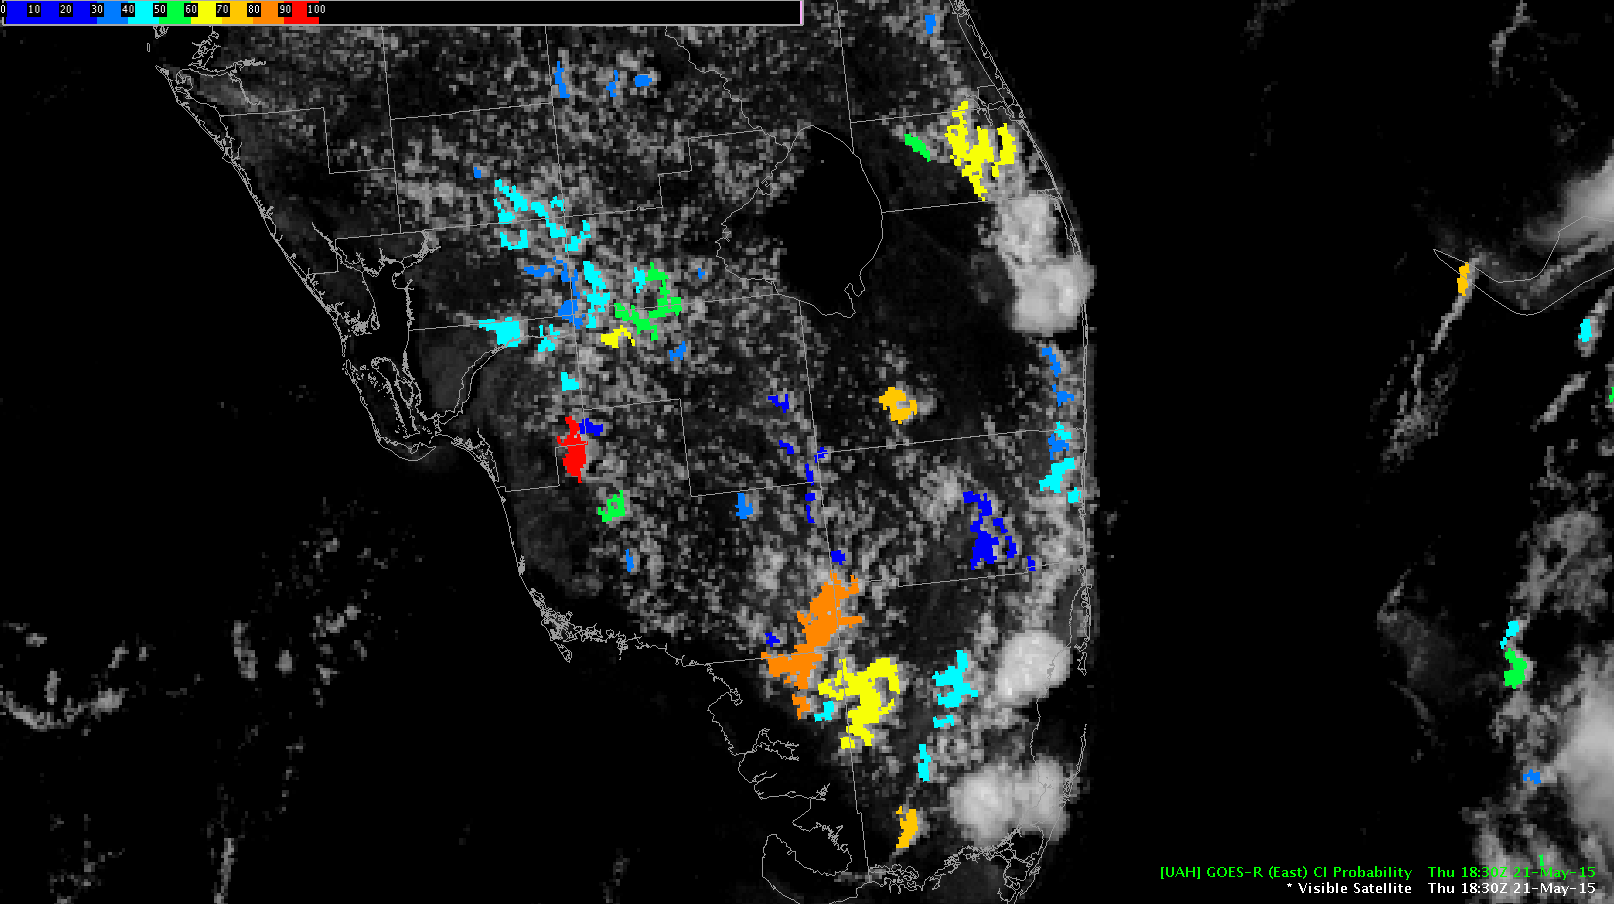
GOES-R LAP algorithm performance in MHX
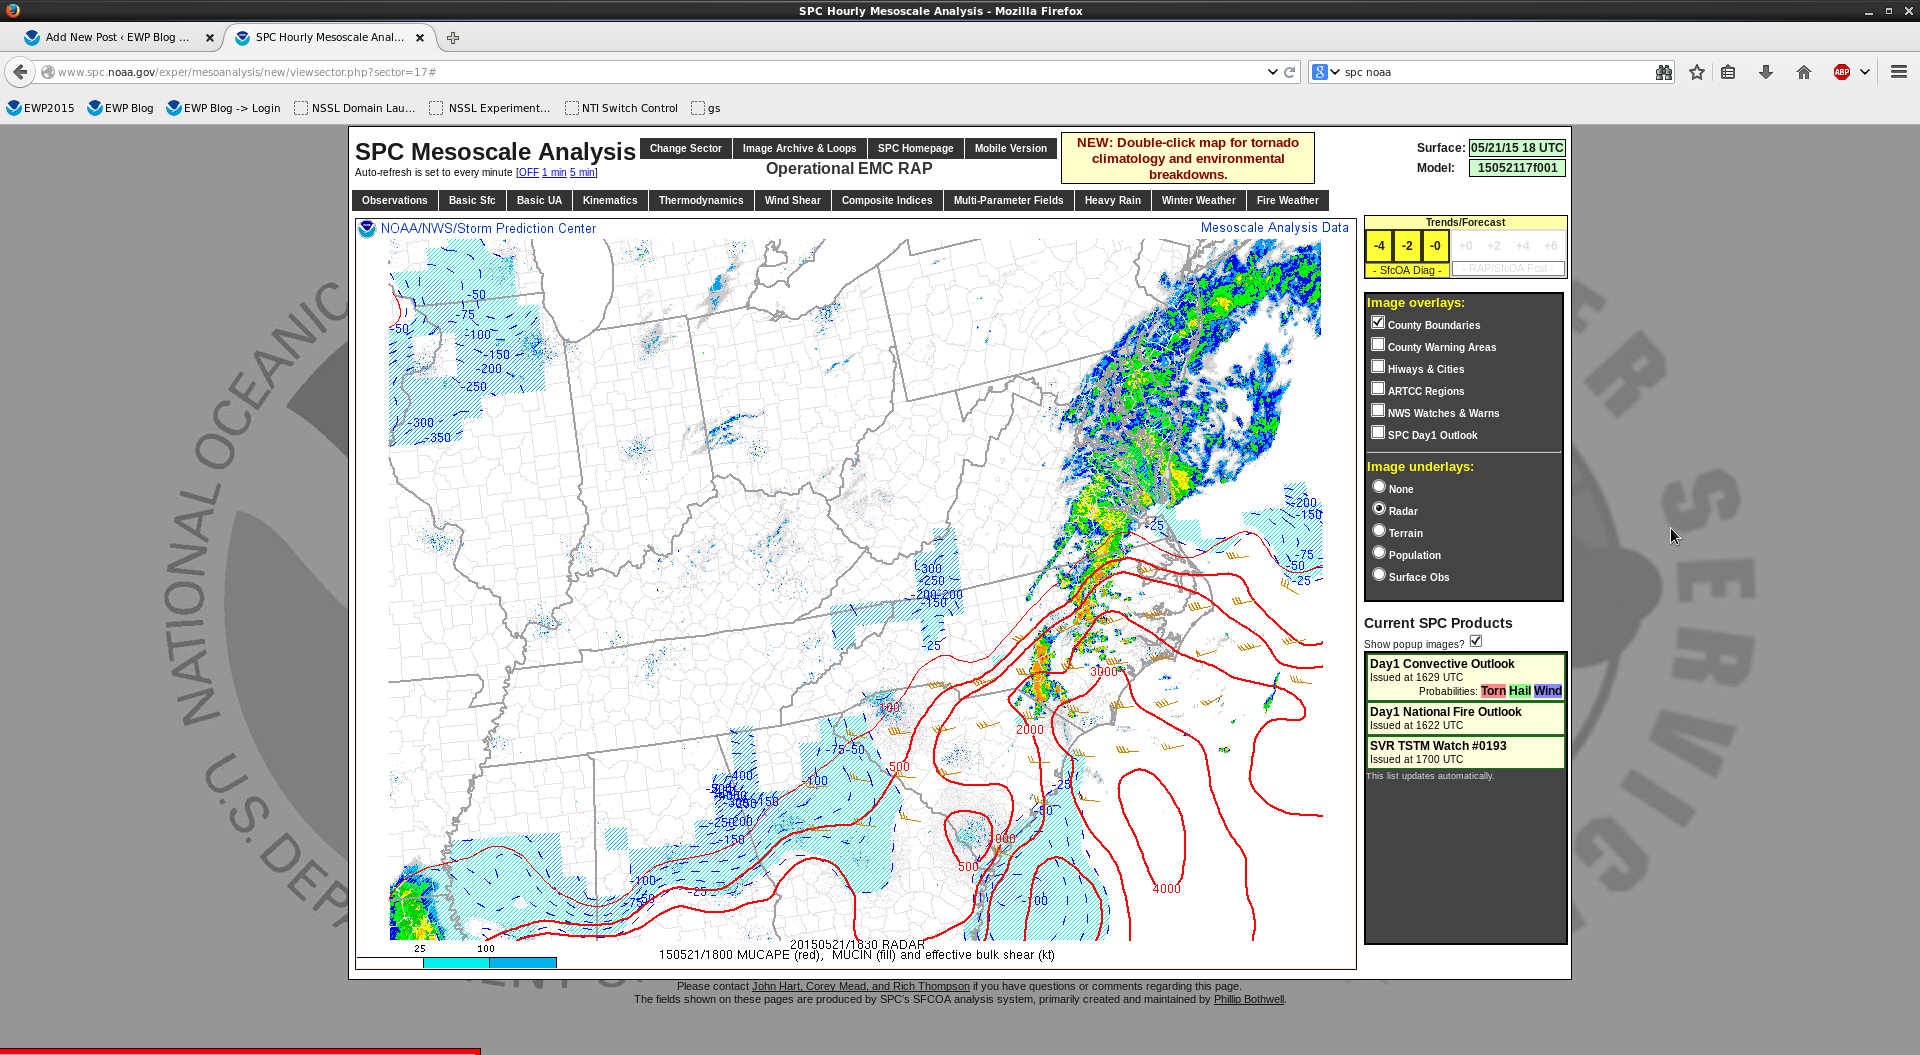
17z GOES R LAP algorithm cape field (fig 1)had best utility on picking up on instability in areas with thin cirrus (fig2). Due to developing convection along the cold front and convective debris…areas further to the west had lower detected CAPE values. In actuality…the depicted tight instability gradient and target for convective development should have been about 100 miles to the west as seen in fig 3 (SPC mesoanalysis) Something forecasters have to keep in mind with this product.
Fig 1
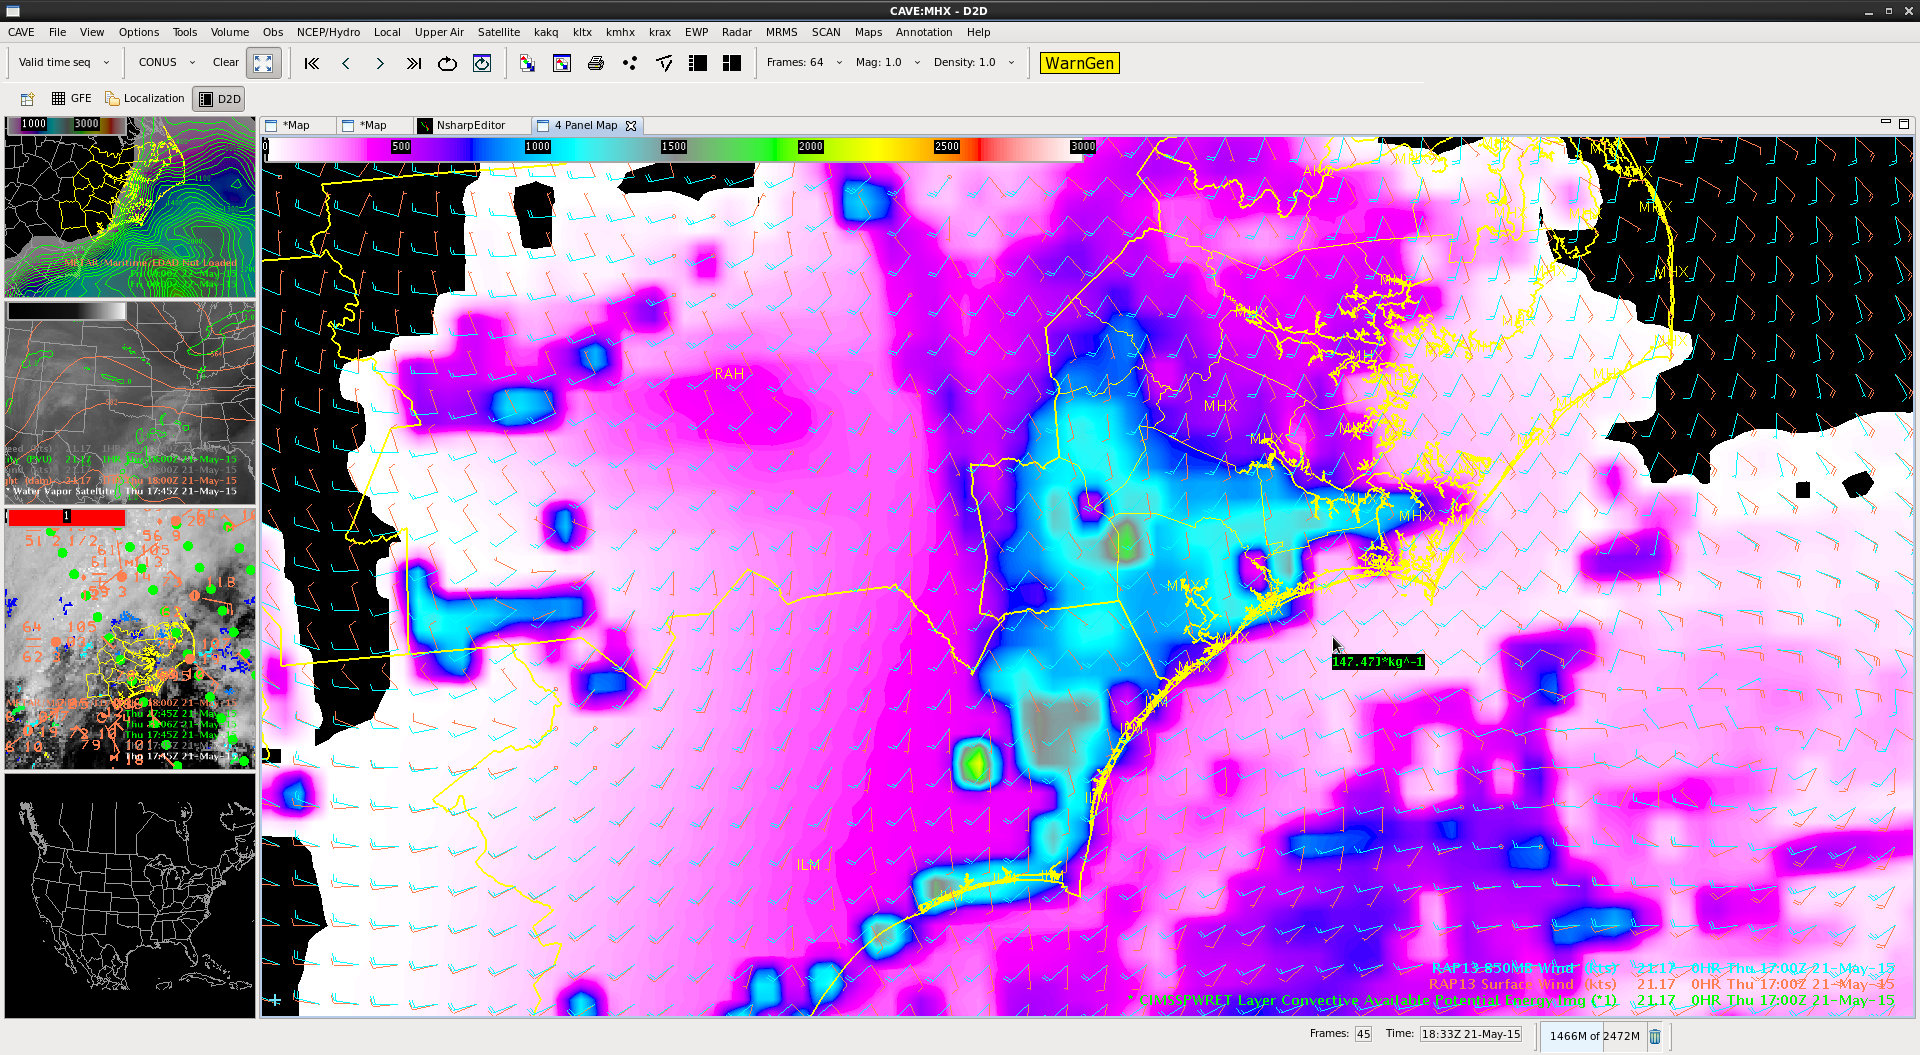
Fig2
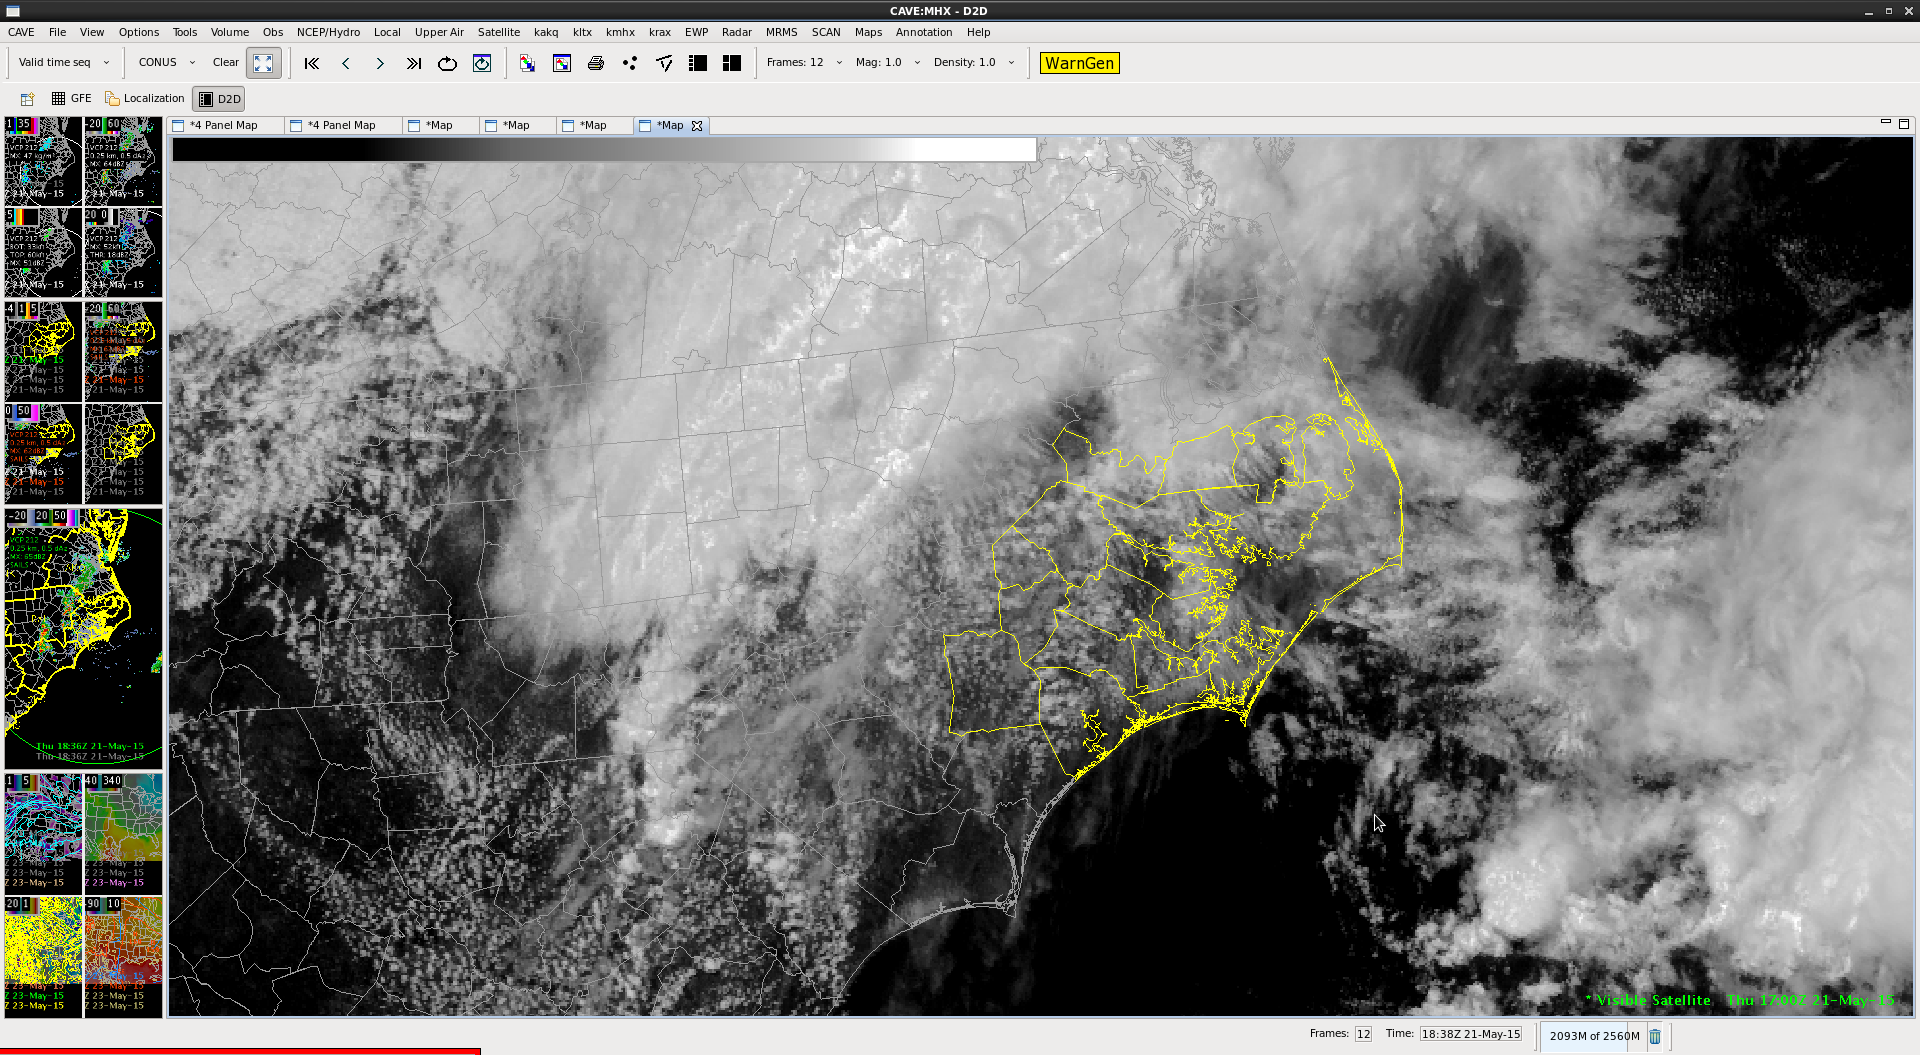
Fig 3
Pickles
UAH Convective Initiation Success
The 1815 to 1830z UAH Convective Initiation probabilities for a line of towering cumulus along the cold front along NC/SC border spiked from 40 to 70 percent. 20 to 30 minutes later, the KLTX radar showed a developing thunderstorm for that cluster.


George
1-min Super Rapid Scan imagery shows sea breeze boundary
The 1-min SRSOR nicely shows the sea breeze along the NC/SC border. Looping the satellite imagery shows the cumulus along that boundary towering and I would expect some convection to develop along that soon. Earlier UAH CI probabilities are in the 40 to 50 percent range.

George
ILM-RAH early trends
ILM shift began around 18Z. Disorganized clusters of convection in Central NC at this time, with widely scattered strong cells, tracking east. Mostly in RAH, one near the very northern edge of the ILM CWA. Anticipating some more storm development in Northeast South Carolina and existing storms growing into the CWA.
Substantial downward trend in Hoke County (10) cell noted after reaching DTA threshold. Robeson Co cell (11) dropped below tracking threshold, and not as a result of cell definition.
SRSOR overshooting top detected for a few scans around 1827Z on Harnett Co/Cumberland Co Cell (9). Only overshooting top in the Carolinas to this time.
Will consider this when evaluating if new cells can maintain updraft strength.
This corresponds to decreases in Prob Severe, too.


[Click to animate]
-Holaday
CI in South Florida
Initial look at CI during spin-up (1715UTC) for MFL CWA shows high percentages along the east coast of southern Florida. Low level flow was NW with temps into the mid 80s to lower 90s. Sea breezes kicked in and CI began to increase. The highest values here (in orange) are 73% to 89%.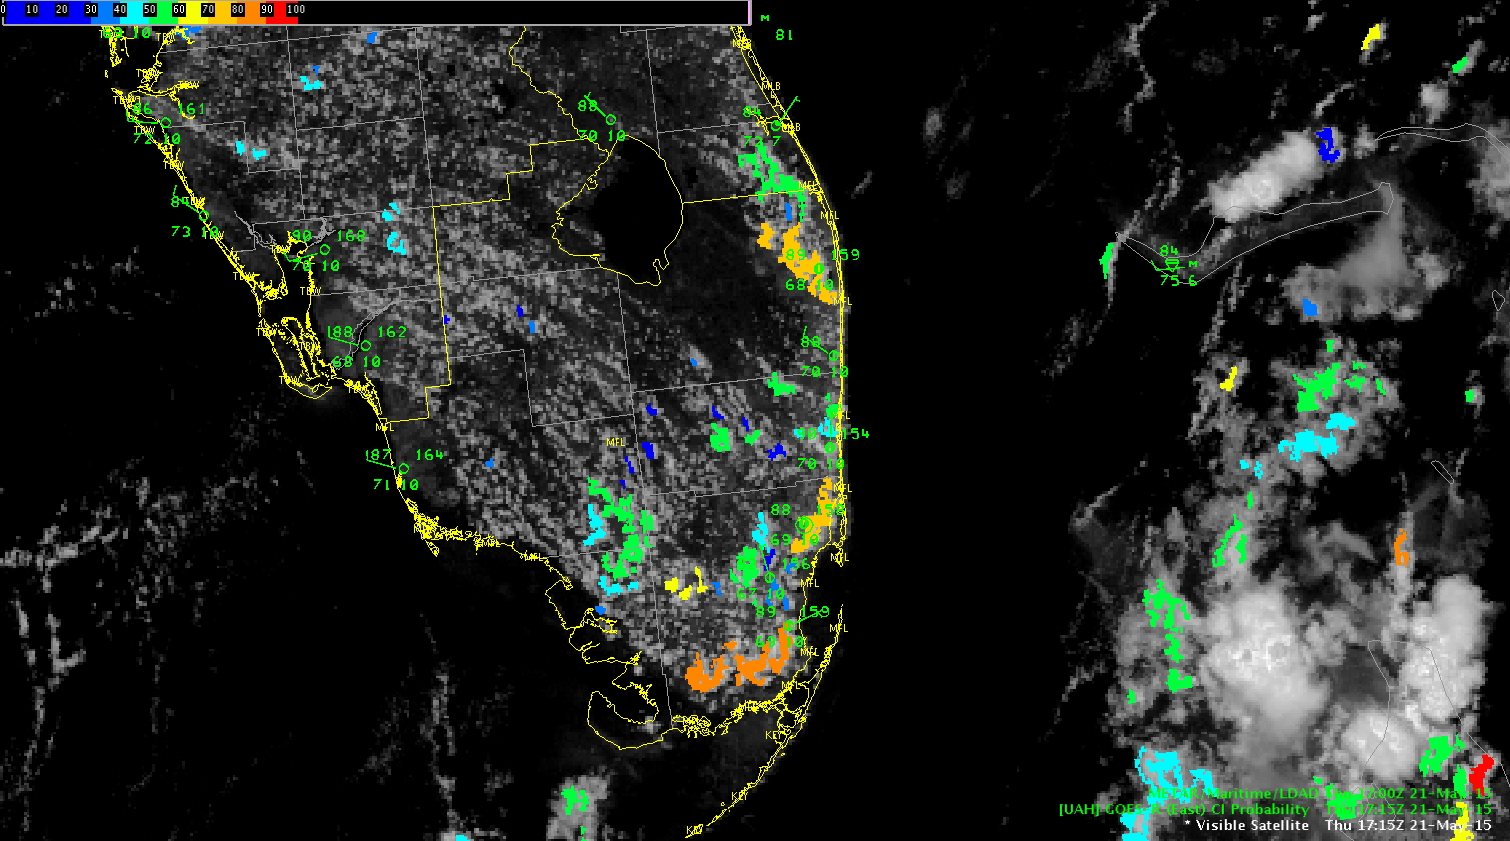
The first radar image that I was able to see (1800UTC) shows cells popping up in 2 of the 3 highest percentage CI areas.

-snowstrm
Origins of MCV Seen In GOES 1min Imagery?
After many hours of convection over the higher terrain in northern Mexico, it seems as if a cyclonic curl is seen within the GOES 1 min Visible imagery on the top of the complex. The cyclonic rotation is larger in scale than lower mesoscale, and may represent the beginning a convective MCV.
Rocky


MAF, revisiting product timeline
Earlier post involved timeline of developments with first storms of the shift in Brewster Co, TX.
Some four hours later, a look at Presidio Co storm, near Marfa. Notable mostly that it represents the challenges of today’s CWA. (and promise of GOES-R capabilities)
– roughly 150 nm from KMAF NEXRAD, on other side of higher terrain
– along 104 degree W longitude Eastern US/Western US ENI zones
– in area of declining total lightning detection efficiency
– at edge of today’s rapid scan window
Prob Severe
2244Z – first passes 50% (71%), growth rate and glaciation n/a
2356Z – peak value 82%
CI (N/A), stymied by cirrus in this instance
ENI trend also really N/A, cell tracking was not started until 2359
MESH
2348Z – first passes 1″ mark
Ice crystals seen blown downwind from overshooting tops on GOES-R Super-Vis

Pickles