Forecaster Thoughts – John Billet (2009 Week 3)

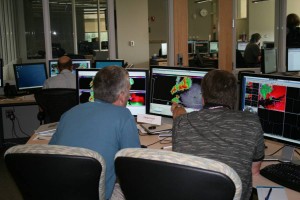
Being part of the EWP was very worthwhile with the four separate test beds each offering unique opportunities. The phased array radar was extremely useful. The highlight of the week for the phased array was Wednesday night’s live event. I was working with Kevin Brown from the Norman office using the phased array to simulate test warnings for the storms. There are a number of very good features with the phased array, the fast temporal updates of 1 minute per volume scan and the higher resolution brings much better identification to features. The radar has the ability to quickly change where the range folding was occurring from one volume scan to the next which meant at most just one minute of bad data. We were able to view animated cross sections through WDSSII and actually watch the reflectivity cores rise and then come back down to the ground causing downburst signatures. The current phased array radar only has one panel so it had limited viewing as the number of storms increased. We only looked briefly at a tornadic storm in the CASA area but focused on the storm coming south from Oklahoma City to Norman which also had tornadic potential. This storm we could see the original outflow move out ahead of the storm then slow down as the storm caught up and reintensified. This is when the tornado developed which we could clearly track in the velocity and as it got close to the radar we even saw the debris swirl on the radar.

The CASA network with 4 low power Doppler radars each about 40 km apart was surprisingly useful. The fact that a 3DVAR wind analysis is done with the radar scans was very helpful. This analysis clearly showed gust fronts and rear flank downdrafts. It also picked up very well on the tornado. I had some hesitation about the system because it completes a volume scan in 1 minute and if there are numerous echoes in range it only does 1 to 2 elevation scans. I think in hail situations this could be a problem. The software is programmed to look for individual cells then scan up several cuts but we had too many cells in the area so that only 1 or 2 elevations were possible. There is also a numerical forecast of various fields which utilizes the radar data and goes out 1 hour in the future. This helps significantly improve situational awareness.

While the previous two systems are only available at Norman there are two other systems which we at Wakefield hope to access locally. The enhanced lightning detection network which includes in cloud and cloud to ground strokes has one domain centered over Washington DC. The VILMA or lightning density product helped with updraft detection and provides another reality check on storm structure. Being a coastal office and talking with the scientist about the fact that in cloud lightning almost always precedes any ground strokes, we could use this product to give some lead time at the beaches during the summer time about when lightning might occur. The lightning tied to individual cells producing trends helped in predicting intensification or weakening of cells. If the cell numbers could be color coded to indicate increasing or decreasing lightning trends this would help with quick identification of which cells might be increasing.

The final data set was multi sensor multi radar data. For now one domain is centered over Washington DC and covers all of our CWA. Some of the most useful products included real time MESH or hail forecast tracks and instantaneous size estimates. In the cases and two real time events it appeared a good estimator of hail size something always needed. These tracks could also be very useful in the proper shaping for a polygon warning. The circulation tracks are so dense it was hard to use it much but would like to look at it in more detail. There are numerous other products as well which will need to be examined but we ran out of time in Norman. We are working to set this up here for real-time use.

John Billet (NWS Wakefield VA – 2009 Week 3 Evaluator)

Tags: None

Forecaster Thoughts – Scott Rudlosky (2009 Week 2)

My participation in the EWP spring experiment was from a somewhat different perspective than most of the other evaluators, observers, and participants. Currently, I am a doctoral student at Florida State University studying CG and IC lightning. We make extensive use of the WDSS software, and I certainly advocate the multi-sensor, multi-radar approach that has been transferred to operations within WDSS. My current research seeks to quantify IC and CG patterns for comparison with these multi-sensor parameters in order to better diagnose storm severity. Therefore, I was extremely eager to observe the operational application of these products, and also how they may be improved.

The HWT-EWP is an ideal forum for forecasters and researchers to share insights. It provides forecasters with the opportunity to share insights into the development of the next generation of operational tools and allows researchers to more clearly define the forecaster’s needs. The following paragraphs detail some general comments and impressions.

The forecasters seemed reluctant to move away from their more familiar base products during severe weather analysis. This leads to one of the more significant points mentioned during our Day 5 debrief. The products that we create must be nearly bug free before the forecasters use them, because first impressions are very important and the tools may not receive a second look if they are not perceived as user friendly or helpful. This highlights the importance of residence training for these newly developed products.

I found the storm trends displayed in Google earth very helpful in diagnosing the state of a given storm; however, the comment arose several times that these trends seemed to originate from a “black box”. I suggest that the forecasters be introduced to the storm clustering techniques and/or that the clusters themselves are visually depicted alongside the trends during future experiments.

The CASA and PAR arrays had the advantage of extremely fine temporal resolution. The rapid updates increased the confidence of our warnings by allowing a more complete understanding of storm morphology. Although the ~ 1-min resolution was helpful, it also introduced a problem. Specifically, it was difficult to fully exploit the rapid updates when multiple storms were likely to require warnings. This is alleviated somewhat with two forecasters, but it raises the question of the frequency at which radar updates become less advantageous.

The only total lightning product that we evaluated during week 2 was a column density of LMA sources (i.e., vertically integrated LMA). The main question that I heard was how this product differed from composite reflectivity. My knowledge of total lightning and its relation to storm severity allowed me to make some use of this product, but the forecasters did not seem to find it very helpful. I suggest that additional products be created that allow forecasters to evaluate total lightning trends in both space and time. In addition to the trends that were displayed in Google earth (i.e., during the weeks with real-time cases in the LMA domains), this also could be achieved by including spatial plots displaying VILMA changes in time (i.e., 5 or 10 min differences/trends).

This opportunity was invaluable to my current and future research. I cannot say that I fully grasp the difficulty in “Crossing the Valley of Death”, but I now have a much clearer understanding of the difficulty involved in the transfer of academic research to operational applications. I appreciated the opportunity greatly and will do my best to incorporate all that I learned into my ongoing research. Please feel free to contact me directly (srudlosky@fsu.edu) if you have any questions in regards to my HWT-EWP experience or my current research.

Scott Rudlosky (Florida State University – 2009 Week 2 Evaluator)

Tags: None

Forecaster Thoughts – Tom Ainsworth (2009 Week 2)

Overview:

During the week of May 4-8, I had the privilege of visiting for the first time the National Weather Center (NWC) in Norman, OK. The purpose of my trip was to participate as an evaluator in NWC’s Hazardous Weather Test Bed 2009 spring “Experimental Warning Program” (EWP). EWP is designed to “test and evaluate new applications, techniques, and products to support WFO severe convective weather warning operations.” While Alaska, and especially Juneau, may not be known for severe convective weather, the opportunity to participate in EWP was valuable in several ways. First, I was able to evaluate emerging weather forecasting techniques and technologies that may have potential application in our data-sparse region. Second, I was able to network with a variety of people from around the nation working in both academia and government. Ensuing discussions covered ongoing field activities in different NWS regions and led to thoughtful brainstorming about future NWS services. And third, I accepted the offer to deliver a brown bag seminar on the last day of class. My brief talk was designed to raise awareness about science-service issues in Alaska. I concluded the talk by offering a friendly challenge to EWP to develop “new applications, techniques, and products” for Alaska Region WFOs which rely less on radar and more on other types of remote sensing.

1. Evaluating Emerging Technologies:

This year’s EWP focused on evaluating four potential WFO applications: 1) multi-radar/multi-sensor gridded severe weather algorithm products; 2) three-dimensional Lightning Mapping Arrays; 3) CASA (Center for Collaborative Adaptive Sensing of the Atmosphere) low power/short range radars; and 4) the Phased-Array Radar (PAR) operating in Norman.

The multi-radar/multi-sensor gridded algorithm products were made available via the Warning Decision Support System – Integrated Information (WDSS-II) developed at the National Severe Storms Laboratory (NSSL). Data from multiple radars and three-dimensional numerical model (RUC) temperature analysis grids produce more vertical volume samples than a single 88D can alone. Refresh rates are as quick as one to two minutes. Overlapping coverage fills gaps from terrain blocking. There are three WDSS-II domains across the south and mid-Atlantic states and a fourth “floater” domain that can be moved to an area expecting severe weather. Among the grids produced are echo tops above selected dBZ reflectivity cores or certain temperatures, lightning density, azimuthal shear, rotation tracks of the highest observed cyclonic shear, Maximum Expected Size of Hail, and vertically integrated Lightning Mapping Arrays (LMA) detecting source points of total lightning in 3D.

LMAs detect VHF radiation emitted as lightning propagates. Unlike the existing National Lightning Detection Network (and Canadian Network utilized in SE Alaska), LMAs detect both in-cloud and cloud-to-ground lightning. Emerging research is identifying a link between increased lighting activity, intensifying storms, and severe microbursts. Each of these parameters is plotted over a Google Earth background and trends of each parameter can be tracked for individual thunderstorm clusters using a multi-scale graph display.

CASA radar output can reveal storm structure, especially in the lower atmosphere, with much higher spatial and temporal resolution than the 88D, especially if the CASA radar is situated at a distance from the 88D. In fact, the rapid update cycle (~60 seconds) and short CASA radar range (~40 km) was difficult at first to get used to. PAR data sets have the range of the 88D and the higher resolution of CASA technologies. PAR is “electronically steered” S-Band radar that provides “targeted” scanning within a 90-degree azimuth sector. Its storm scanning strategy is significantly faster than the 88D which greatly enhances the operator’s situational awareness of storm trends. The PAR may one day replace the aging 88D network.

In summary, participating in the EWP was easily the most intensive, hands-on exposure to new radar technologies I have had since I attended the 88D Operations Training in Norman 15 years ago. All of the tools and applications I tested have significant potential for improving very short term forecast decision making. Assessing each application is literally the stuff of PhD dissertations. Unfortunately for Alaska WFOs, applicability of most of these technologies in the foreseeable future will be negated by the lack of requisite archive Level 2 data, no over-lapping radar coverage areas, the sparsity of conventional surface based data sets and the resultant impact on RUC-II model analysis. EWP facilitators requested field offices submit case studies and Level 2 archive data to which the tools can be applied. Unfortunately, the FAA does not maintain Level 2 data from any of the Alaska 88Ds. PAR and CASA radars, in my opinion, have the highest potential for use in Alaska Region.

2. Professional Networking:

It was quickly apparent to me the NWC is an important and very active facility for NOAA. It symbolizes the advantageous partnerships between university training, applied research, and NWS operations. The EWP work space was literally surrounded by the Norman Forecast Office, NSSL, and the Storm Prediction Center (SPC). During the week I was at NWC, a major tornado field research project covering the Great Plains over five weeks (VORTEX-2) was kicking off with international media attention. Precise orchestration of people and events in NWC this week – including several public tours per day – was managed by University and NOAA public affairs personnel. I was able to meet up with two OU graduate students with connections to WFO Juneau: one was hired in 2007 as a STEP; the other was hired as a SCEP this year.

My co-evaluators in EWP this week represented an equally diverse group: a Lead Forecaster from Chicago; a General Forecaster from Seattle; and a PhD candidate from Florida State University. Each person brought a different set of skills and experience to the program. Discussions during breaks and after hours generally drifted to future weather forecasting operations and trends of university research activities. I learned from conversations during the week that there are a number of different interpretations of the concept “decision support services”. DSS is a term becoming commonly associated with NWS Strategic Planning, and is a major agenda item in the National MIC/HIC Meeting later this year. My sense is field offices would benefit from having a clear and consistent definition of what NWS upper management means by DSS.

3. Brown Bag Seminar:

NWC routinely offers brown bag seminars by OU faculty and NOAA/NWS staff. Visiting scientists are also offered the opportunity to present short seminars. In the case of EWP, visiting evaluators are able to give a short presentation during the weekly de-briefing session on Friday. I agreed to speak about science and service issues in Southeast Alaska and demonstrate what makes warning decision making in our region particularly challenging. The presentation highlighted our large AOR, complex terrain, sparsity of in-situ data (including radar), and the value of high resolution satellite data to warning decision making. In closing, I requested the Hazardous Weather Test Bed (HWT) audience to consider ways they could apply their mission to develop “new applications, techniques, and products” for WFOs in Alaska Region and elsewhere that may rely less on radar and more on other types of remote sensing. In response, I learned the HWT intends to hire a student next fiscal year to begin investigating and developing warning decision applications related to satellite imagery. My presentation slides are available on the regional network (R:/) in the “Juneau” folder (HWT-NWC SEAK ScienceService 2009-05.ppt).

Summary:

I am very grateful to have had the opportunity to travel to the NWC May 4-8 and participate as an evaluator in this year’s Experimental Warning Program. The EWP cadre knew their material thoroughly, was well prepared, and interacted well with visiting evaluators. The amount of new material presented was considerable but, over time, was manageable. The NWC is a very busy place with OU faculty and students, NOAA researchers, and NWS NCEP and WFO operational staff. The interaction with these groups and fellow evaluators during the week was professionally stimulating. And even though there are serious road blocks to using the new technologies anytime soon in Alaska Region, the staff there was open to hearing objective, constructive feedback. I recommend supporting any future opportunities for Alaska Region field office personnel to visit and experience NWC.

Tom Ainsworth (NWS Juneau AK – 2009 Week 2 Evaluator)

Tags: None

Forecaster Thoughts – Steve Cobb (2009 Week 1)

The Hazardous Weather Testbed (HWT) Experimental Warning Program (EWP) operates from the National Weather Center (NWC) in Norman, Oklahoma. I was selected to participate in the EWP during the first of the six week project for spring 2009 during the 27 April through 1 May period. Activities during the week were structured but flexible enough to encompass the given weather scenario. Working shifts started at 1300 LT and ended at 2100 LT. Work was conducted in the HWT Operations Room which is a large glass-enclosed room centered between the operations of WFO OUN and SPC. Daily briefings and an end of the week debriefing was conducted in the NSSL Development Lab.

My forecast partner during this week was Suzanne Fortin (EAX SOO) from Pleasant Hill, MO. The coordinator for the week was NSSL scientist Greg Stumpf. Following is a timeline of activity and general observations regarding our evaluation of several new applications, techniques and products during the experiment. There were four primary projects of focus each geared toward WFO applications: 1) an evaluation of experimental Warning Decision Support System II (WDSSII) 2) an evaluation of 3D Lightning Mapping Array (LMA) 3) an evaluation of the phased array radar (PAR) in Norman and 4) an evaluation of networked 3-cm radar (CASA) in central Oklahoma. Since the WDSSII display was less dependent on weather in Oklahoma, we operated during two live episodes in the neighboring CWAs of ABQ, LUB and MAF.   Outside of active weather regimes or prior to convective initiation, our time was spent working with archived cases for each project. A longer intensive operations period (IOP) occurred late in the week as convection developed late in the evening over western Oklahoma, otherwise IOP and archived cases were contained in the normal eight hour shift.

Monday – Sue and I met Greg at the NWC entrance and began an abbreviated tour and orientation session due to anticipated convection within the immediate central Oklahoma area. The orientation included training on each of the projects and was conducted by the cognitive scientists associated with each. Project evaluation began with an IOP focusing on developing convection in central Oklahoma.  Storms quickly died so we switched to an archive case from 2007 of TS Erin as it intensified over central OK. We were able to follow several small circulations in the PAR data. Overall the first day was largely a matter of learning knobology with the new display tools such as WDSSII and adjusting our warning decision paradigm given the rapid update times provided by the datasets.

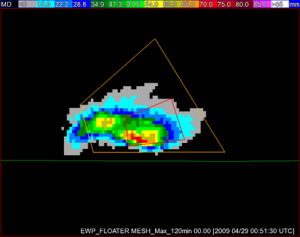
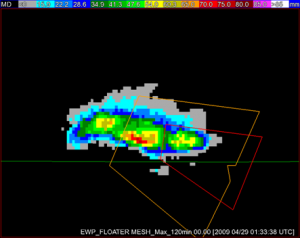
Tuesday – We began the day working through two CASA cases, one tornadic storm near my home town of Minco and another mini-supercell case. I became more comfortable with WDSSII GUI for interrogating the radar data but became overwhelmed at times having to consider five different radar views. The rapid updates were nice but each one seemed to present a new interesting feature that required investigation. We learned not to dwell too long on features but quickly evaluate their merit and move on to more recent data. This approach allowed us to stay ahead of developing storms as compared with the 88D. There were some gaps in the data due to the scan strategy employed with CASA so the 88D was still needed to evaluate higher tilts at close range. We ended the evening with an IOP concentrating on isolated storms In New Mexico and West Texas. The team utilized the multi-sensor/multi-radar output via AWIPS localized to WFOs ABQ and MAF. It was nice to operate within AWIPS and have the comfort of developing procedures and using warnGen to draw polygons. Some of the most useful products were the height of the 50db core above -20C and the MESH products. We particularly found the MESH tracks helpful in orienting polygons to capture storm motion. This can best be seen in the comparison images below between our polygons and those issued by WFO MAF.

Figure 1. Comparison of EWP warnings (top or left) and WFO warning (bottom or right). Note the difference in polygon orientation. The NSSL MESH track (image) was used by the EWP team to predict future supercell motion.

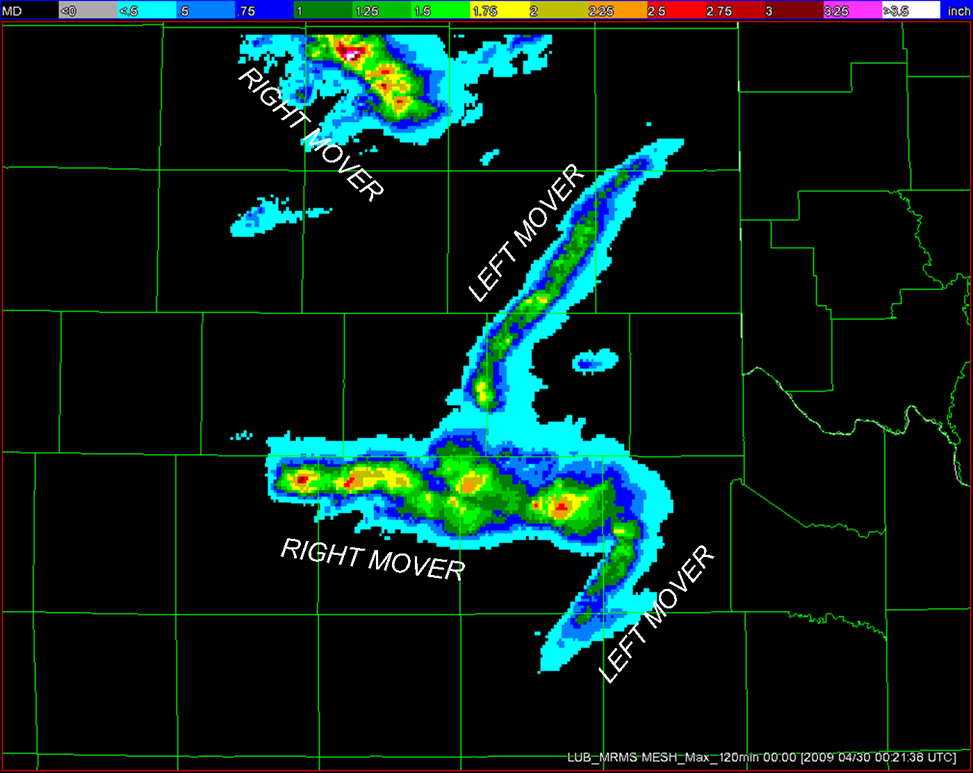
Wednesday – This was by far our most active IOP shadowing the forecasters at my home office in Lubbock. Both the familiarity of the CWA and working within the AWIPS framework attributed to high SA for this event despite it being busy. By this time most all bugs were worked out of the AWIPS system and we had procedures in place to evaluate the WDSSII decision support products. We quickly found our favorite few WDSSII products and cycled through them using the panel-combo-rotate feature deployed with AWIPS OB9 comparing them to base data from the 88D. In a couple of instances I felt we had better warning lead times due to enhanced SA provided by the diagnostic parameters. Once again our polygon orientation was highly influenced by the MESH tracks and appeared more cell based versus the WFO. It did become apparent that left movers present issues with rotational tracks and greatly underestimated hail sizes. Also values from the azmuthal shear products were a bit difficult to correlate to spotter reports. After the event I spent time in the hotel downloading archived images of MESH and meso tracks to send back to the WFO to assist in damage surveys the following day. There were a couple of significant tornadoes during this event over rural areas but they were well photographed by chasers. We also benefited from having live views of the storms via storm chasers available through http://www.spotternetwork.org.

Figure 2. MESH tracks, with left and right moving storms annotated (courtesy of Greg Stumpf). Warning polygons by the EWP team were again more storm-based than official NWS warnings based on the use of the MESh products. This image and corresponding meso track was sent to WFO Lubbock to aid in follow-up damage surveys.

We started the day Wednesday looking at an LMA case over central Oklahoma from earlier this year. The LMA data provided some usefulness for warning operations given the rapid update time (2 min) however this dataset is likely most valuable for longer fused products such as NOWs and SPSs. Product units were obscure to us in kg2/sec and we found that their interpretation increased as we combined them with other products such as the NLDN and reflectivity in the ice producing layers. There was good correlation with increasing updraft strength and tightening mesos but once convection became well organized and widespread it was more difficult to discern important features based solely on LMA data. Vertical cross sections or trend plots would also be helpful for display of the data but this was not possible during our portion of the experiment. It would be interesting to see LMA applications during winter or heavy rainfall events to evaluate other uses.

Thursday – A couple of non-tornadic events were the focus of our archived cases on this day. We interrogated PAR data at close range to observe a well-defined MARC signature and used FSI-like cross-sections on WDSSII to see the cores descend. I also found some application to the divergence fields but they appeared fairly noisy. A smoothed field or one at a lower resolution may prove more meaningful. The CASA case was a classic high wind event across the southern part of the domain but there was lots of convection throughout which caused issues with attempting to monitor multiple radars and keep good SA. The 3DVar analysis was nice in that it helped keep the focus on the proper location within the domain where the severe wind swath was occurring. It was difficult to manage five radars within the domain to keep pertinent storms visible on the main screen for complete interrogation. The composite image in this case was a life-saver and we frequently took wider views provided by the 88D to keep tabs on developing convection on the edges of the domain. We ended the day in IOP with a single supercell event in western Oklahoma, working with both the PAR and multi-sensor data. The PAR provided sufficient scans for detecting developing and decaying cells. At one point the azmuthal shear algorithm in the PAR showed an increasing trend while the multi-sensor data showed it decreasing with time. This discrepancy was possibly due to color curve differences between the systems but more likely a result of the way in which the multi-sensor data uses lower tilts and stronger mid-level shear was not going into the algorithm at longer ranges. There was considerable range folding in the 88D data and some in the PAR data but the PAR data by far was more consistent and provided a clearer picture of the mesocyclone evolution. Our warnings were consistent with OUN’s however we ended the tornado threat sooner than the WFO did.

Final Thoughts- Overall this was an enjoyable experience and highly educational. I truly appreciate being selected to participate. It is exciting to see improvements that can be made in the warning environment with new technology and the new application of existing technology. Although there was some spin-up time required, working almost entirely with base radar data from the new platforms made the transition easier. The PAR and CASA platforms bring a new dimension to storm interrogation with rapid updates on the order of 30 to 50 seconds. While there is some need for algorithms in this environment to provide integrated values of reflectivity or time and height tracks for rotation, a minimum of new tools is likely the best approach to introducing faster updates to the field. As a forecaster it was easier to adapt to the new scan strategies worrying just about the base moments versus also trying to get my hands around dozens of volumetric or new-scan products at the same time. As such, when working with the existing 88D network, the new algorithms provided by the NSSL multi-sensor applications integrated nicely with the base data and enhanced the already familiar process of storm interrogation.

Unlike this new technology which is likely decades from deployment, the multi-sensor/multi-radar applications have a role in today’s forecast environment and should become part of the AWIPS data stream. Southern Region should work with NSSL to provide at a minimum the MESH, rotational tracks and reflectivity heights above 0C and -20C as these were found to be beneficial during the warning experiment. Meso tracks and azmuthal shear products were also helpful to the EWP warning team and have value not only during the event but in post-storm analysis as well. The greatest value of the multi-sensor data is overcoming sampling issues at very close ranges to the RDA and to provide input from radars at an improved viewing angle especially for developing circulations. As a result, the SR strategy to improve warning effectiveness could be impacted directly and positively with the inclusion of these products into the field office decision making process. This is possible to some degree already through Google Earth but integration into AWIPS is necessary if true value is to be gained and to improve the timeliness of delivery of the products.

Steve Cobb (NWS Lubbock TX – 2009 Week 1 Evaluator)

Tags: None

Forecaster Thoughts – Suzanne Fortin (2009 Week 1)

During the week of April 27th I participated in the Experimental Warning Program (EWP) component of the Hazardous Weather Testbed (HWT) at the National Weather Center (NWC) located in Norman, Oklahoma.  The HWT is located on the 2nd floor of the NWC nestled in between WFO OUN and SPC, and was established in 2006 to foster collaboration between NSSL scientists and operational meteorologists.   There are two components of the HWT, the EWP which I participated, and the Experimental Forecast Program (EFP), which focuses upon the evaluating forecast tools that could improve severe weather operations in the 1-12 hour forecast period.   Typically, the two programs are run in tandem; however, this year the EFP was delayed, thus only EWP was run during the week I was at the HWT.

From my experiences, I cannot deny how valuable PAR and CASA will be to warning operations.  The temporal resolution of the data alone, will allow forecasters to make warning decision 5-10 minutes sooner than they could with the 88D.   The adaptive scan strategies of these radar systems will allow us to interrogate more critical storms more effectively, also enhancing our warning decision process.   My greatest concern about these data is our ability to process the volumes of data that will accompany these new technologies, and hopefully human factors engineering and/or fuzzy logic systems will help in that regard.   Similar to the integration of WSR-88D, we will have to modify our operations to fully exploit these data – but I can tell you at this time what the optimal set-up would be.

The derived MRMS products also show value, but until they can be fully integrated into AWIPS in real-time, they will not be as effective in the warning decision process.  In addition, the products need to be in a format that compliments base data analysis, but doesn’t detract from its interrogation.  Yes, they are available via Google Maps in real-time, but to make these products more viable to NWS warning forecasters, they should look into making these products viewable in GR2 Analyst, which outside of AWIPS is the software of choice to interrogate base radar data.  The CIMMS/NSSL researchers seemed open to exploring this possibility in the near term, until then, we’ll have to rely on viewing the data in Google Maps.

As I was driving home, and in the week that followed my trip to Norman, I had time to ponder my experiences at EWP, plus review input from some of the other evaluators.  I was struck by the number of SOOs and warning experts that had been tapped to evaluated the various systems at EWP, and that raised some concern in me.   When you have higher performing, multi-tasking and more analytical evaluators – are you really designing a system that will benefit everyone?  Of course warning “experts” are going to be able to process and interrogate data more quickly, they have high skill in this area, but what about the people who struggle in this arena.   I think it would behoove the folks at EWP to have a more varied population evaluate their products and system, as I feel it would build a more robust system that could be used effectively by all and exploited by the experts.

Finally, I should add that the NWC is quite a place to behold, and I was impressed how eager the researchers from NSSL and OU’s School of Meteorology were to work with and listen to operational meteorologist’s concerns.    I enjoyed my week at EWP, not only because I was able to get a glimpse of things to come, but because I was able to experience the synergy of the NWC.   I hope others get a chance to experience the energy that surrounds the place in a future opportunity.

Suzanne Fortin (NWS Pleasant Hill MO – 2009 Week 1 Evaluator)

Tags: None

Forecaster Thoughts – Bryan Tugwood (2008 Week 2), Dave Patrick (2008 Week 4), Mark Melsness (2008 Week 5)

In May 2008, we were given the opportunity to participate in NSSL’s Experimental Warning Program (EWP), which is part of the Hazardous Weather Testbed. It was held at the National Weather Center in Norman, Oklahoma for 6 weeks this year, running from April 28th to June 6th. This is the 2nd year of the EWP, and was born out of the Spring Program. The other component of the Hazardous Weather Testbed is the Experimental Forecast Program.

The purpose of the EWP is to evaluate new research and technology, and brings the researchers and developers into the same working environment as the forecasters. The goals of this year’s program were threefold:

  1. Evaluate the Phased Array Radar (PAR), located in Norman.
  2. Evaluate the 3 cm CASA radars in central Oklahoma.
  3. Evaluate gridded probabilistic warnings.

Before delving into any of the above 3 evaluations, we were given some training as well as time to practice with the software. During the evaluations, there was always help available as the learning curve was rather steep – especially for us Canadians who were unfamiliar with the Warning Decision Support System II (WDSSII) software. Above all, they wanted our feedback, as we were being “run” through the various implementations. Feedback was given to them both ongoing, and after the evaluation in a written survey. We will attempt to give a quick overview of each of our evaluations that we participated in.

Phased Array Radar: The PAR is being considered as a possible replacement for the WSR-88D, which is now 20 years old. The array consists of 4352 transmit/receive elements which form the array, as opposed to a large rotating antenna with one feedhorn. The radar beam is vertically polarized, as opposed to the horizontal polarization of the WSR-88D, the power is slightly reduced, thus features such as outflows and horizontal convective rolls are almost impossible to detect. Scans are available at one minute updates though, making storm evolution appear much more fluid. More information is available online at http://www.nssl.noaa.gov/projects/pardemo/ .

CASA Radar Network: There are four low power CASA (Collaborative Adaptive Sensing of the Atmosphere) radars to the southwest of Norman, filling the “gap” between two WSR-88D radars, namely Frederick, OK and Norman. The CASA radars are 3 cm wavelength, so although they suffer greatly from attenuation, having four of them in close proximity negates this problem in way of a composite image. The big advantage of the CASA radars is its high resolution, both spatially and temporally, with an added bonus of being able to collect data from as low as 200 metres above the ground. Additional information is available at these websites: http://www.casa.umass.edu/research/springexperiment.html and http://www.casa.umass.edu/

Experimental Gridded Probabilistic Warnings: Currently, the decision to warn a particular storm is subjective, and takes place when a forecaster has a certain degree of confidence (decision threshold crossed) that severe weather is occurring, or is likely to occur. There is no avenue available to explain how likely it is that severe weather is expected, other than in the discussion.

Recently the National Weather Service changed their warning areas from counties to polygons. You will notice while you are watching a radar animation that as a particular storm is tracking along, warning polygons will “jump” every 30 minutes or so to take into account new storm positions and expected motions. While storms appear to track along fairly smoothly, warning polygons do not. As a result, lead times for an approaching storm will differ from one locality to another, based on the warning issue time and the shape of the warning polygon.

Gridded probabilistic warnings (prob-warns) give forecasters the option to warn a storm before their mentally pre-defined threshold is crossed. Storms can be warned on as low as a 10% probability, all the way up to 100%. Storms are warned based on 3 categories: tornado, large hail, or damaging wind. In some supercells, there could be probability “cones” for all 3 simultaneously, each covering different areas depending on the specific threat.

Prob-warns are also given a velocity, thus they track along as smoothly as the storms being observed on a radar animation. Prob-warns can be assigned a changing threat level for storms that are expected to soon change in their intensity. Future versions will allow the warning “cones” to also depict curved probability paths.

The only drawback to prob-warns in the way they are currently set up (all experimentally of course), is they still don’t give you the option of tiered warnings. Even with prob-warn, we would still to a certain degree face the challenge of having more threats than bulletins (graphics) to express them. For example, a cold core tornado threat of 10% is considerably less threatening than an F5 tornado threat of 10%. Is it possible to design a “Tiered Gridded Probabilistic Warning System”?

Mark Melsness, Environment Canada, Winnipeg and Kevin Brown, NWS, Norman discussing a severe Nebraska storm during a live probabilistic warning exercise.

Overall Impressions: The National Weather Center is an impressive facility located at the University of Oklahoma in Norman. It was completed in 2006 as a collaboration between NOAA and the University of Oklahoma. It is home to research scientists, operational meteorologists, faculty, students, engineers, and technicians. It is also the home of the SPC, NSSL and the Norman NWS.

We worked mainly in the Hazardous Weather Testbed (HWT), physically located between the SPC and the Norman NWS. The program ran for six consecutive weeks, with 3 or 4 operational forecasters present each week, coming from such diverse localities as Winnipeg, Toronto, Serbia, Fairbanks, Seattle and Norman to name a few. It was our input as operational forecasters that the researchers and developers wanted to tap into. We filled out several surveys, participated in daily debriefings, and also gave ongoing input to the HWT staff, who were most accommodating and professional.

The sheer scope of the forecasting challenge is much different in the United States than in Canada, especially in the Prairie and Arctic region where two to four severe weather meteorologists (two during the night and early morning hours) are responsible for issuing all warnings, watches, and special weather statements for half the land mass of Canada. These same two to four meteorologists monitor the nine radars which cover the populated portion of the Canadian Prairies – an area of comparable size, population density, and climate as 8 to 10 northern US NWS offices.

Having the ability to view minute by minute updates on both the CASA and Phased Array Radars was fascinating. Watching storms evolve in such a fluid motion was like the difference between watching a High Definition TV vs. an old black and white set. The main drawback for both radars was their inability to detect outflow boundaries and horizontal convective rolls. The amount of data to assimilate was huge, impossibly so when mentally translated into an Environment Canada office. The only way to incorporate this technology in a Canadian office would be to use an approach analogous to SCRIBE – quasi-automated warnings with the forecaster having the final say.

The scientists at the Hazardous Weather Testbed envision a time in the future, perhaps 10 to 15 years from now when warnings evolve from our current, “Warn on Detection” to “Warn on Forecast.” In other words, increased atmospheric monitoring coupled with an increased understanding of severe storms should allow us to issue warnings before a severe thunderstorm has even formed.

The Hazardous Weather Testbed is an excellent example of what could be accomplished here in Canada with a new National Laboratory dedicated to testing technology which could be used in Operations… with the goal of improving the forecasting and dissemination of severe weather.

We wish to thank our managers for allowing us to participate in this program, and the scientists at the National Weather Center for making our time there enjoyable and rewarding.

Bryan Tugwood (Environment Canada – Week 2 Participant)
Dave Patrick (Environment Canada – Week 4 Participant)
Mark Melsness (Environment Canada – Week 5 Participant)

Tags: None

Forecaster Thoughts – Chris Sohl (2008 Week 6)

While the weather in the local area started out rather quiet, it ultimately picked later in the week allowing us to view PAR and CASA radar data in real time. In the early part of the week we also had the opportunity to view archived data and issue real-time probabilistic forecasts for thunderstorms in the central plains.

For both the real-time and archived cases where we made probabilistic forecasts for thunderstorms, the process seemed to work reasonably well. The fact that many of the storms were discrete probably made the task relatively manageable. It would be interesting to experiment with cases of widespread strong/severe thunderstorm development including a few high-end storms such as supercells. Managing the boxology and frequency of updates could be a challenge.

I can envision the additional value that the probabilistic forecasts could provide to some customers especially for values below some “threshold” that might trigger a warning. For example, tornado probability trends for a supercell could give an EM or TV weather person some insight on the likelihood that a storm may subsequently have a tornado warning issued on it.

The strength of the PAR data was clearly its capability to perform rapid volume scans. Storm evolutions seemed to be easier to follow and also allowed the detection of features a little sooner than you might with the 88-D. The archive data of a developing microburst nicely demonstrated the advantage of having more frequent volume scans available.

While the range of the CASA radars was limited, they did provide additional information about the near surface wind speeds in storms than could be detected using the 88-D which was located farther away from the storms.

Although only available for a few volume scans, live radar data from a SMART radar was available for display on a workstation. To be able to view a remotely transmitted dataset in real time was impressive.

In the back of my mind, as I explored many of these datasets, I was trying to visualize how a warning forecaster could incorporate all of this information during warning operations. The long term solution may be short-term storm-scale forecast models that incorporate all available datasets. However, in the interim, it might be worthwhile to also explore the development of tools that would allow all available radar data sources to be combined into a seamless dataset for interrogation by the forecaster. This would also include developing robust 3D and 4D visualization tools.

Chris Sohl (NWS Norman OK – Week 6 Participant)

Tags: None

Forecaster Thoughts – George Phillips (2008 Week 6)

While PAR, CASA and probabilistic warnings are quite away down the road, I appreciated the fact that they are obtaining considerable input so far in advance.  This is, of course, the way every significant change in technology/operations should be tested and input from operational people received.

PAR – We only had one day where real storms impacted the PAR coverage area.  On the other days we played back archived cases.  While working the real weather day, it didn’t seem to help a great deal while I was the one investigating the storms early in the event.  Very strong wind fields on that day (June 5th) led to multiple dealiasing failures, making especially the early part of the real-time case, difficult.  As the event progressed and storms moved closer to the radar, rotation could sometimes be seen earlier on the PAR than on the 88D.

On the playback cases, the high temporal resolution would have helped greatly with the issuance of warnings for pulse storms, and would have led to more lead time in a tornado case.  If the high frequency updates from the PAR were coupled with a display like GR2AE, the ability to see updraft/core development and downdraft/core descent, would greatly help in visualizing what was going on with storms, and could easily help with understanding when warnings are or aren’t warranted based on their evolution.

Another advantage of the PAR was obtaining time continuity for questionable quality data.  Let’s say on the 88D you see an interesting velocity signature in an interesting area of the storm, but it doesn’t quite look right.  You may have to wait for another volume scan (4-5 minutes) before making a decision based on this signature to see if it is a dealiasing failure.  With the PAR, you have time continuity in very short order and can usually evaluate data quality much quicker.

On the challenging side was the fact that we are not used to such high frequency updates.  Transient features, that may or may not mean anything from a warning perspective, are seen much more frequently.  It will take awhile to adjust to mentally calibrate the WDM process with such high temporal resolution updates.  Concern was expressed about possible data overload as the volume scan could come in at 30 second or 1 minute periodicity.  While this is a valid concern, good visualization software would certainly help with this situation

CASA -  These radars are southwest of Norman, and are only about 30 km from each other.  Once again, only one day had real weather that impacted the radars, and that was late in the shift on the last day, so real-time evaluation was not extremely useful during that week.

We played back a few cases using the CASA radars and they showed some of the strengths.  In particular, with wind storms, the actual winds are often at some large angle to the 88D radar beam.  Or, the 88D is showing strong winds with a storm, but 0.5 degrees is intercepting the storms at 8000 ft.  Are those strong winds making it to the surface?  With CASA radars spaced relatively close together, sampling the lower atmosphere is easy, and the likelihood of being able to obtain a good estimate of the winds as they approach (or move away from) one or more of the radars, is also good.

Also, being able to sample the lower atmosphere in high resolution means that velocity and reflectivity signatures of small scale features should show up much better/more frequently.  We saw this in an example case with a mini-supercell associated with a tropical system, which had a nice little hook, and decent velocity couplet on the CASA display, while the 88D showed it as a blob with no real velocity signature until after the tornado had touched down.

Of course at 3 cm wavelength, attenuation occurs frequently, so any future CASA network would seem to need to be a supplement to a network of 10 cm radars.

Probabilistic “Warnings” -  Ever issued a deterministic warning and wish 10 minutes later you could cancel it, or reorient it, but are concerned about the verification implications, or possible consequences if you are wrong?  In the era of probabilstic warnings, one simply decreases/increase the probabilities, or reorients the track to produce a different area of probabilities.

We did this each day, in real time for various CWAs across the Plains.  We also did this on the last day with a canned case that all the participants in the EWP went through.

This actually worked better than I had expected.  But one could see that following more than two storms around with probabilities for tornadoes, winds and hail, quickly became a workload.  Of course there are also challenges with reasonably assigning probabilities, since that is not something we are used to.

On the last day we worked an archived case that all the participants in this EWP went through.  We had VERY limited environmental information for this event.  Assigning tornado probabilities without good environmental information was very frustrating, and really emphasized the importance of having this data.

There are a number of problems with the current warning system.  How we would transition from what we do now, to this method is not entirely clear, and how some of our users would react to this change is also unclear.  However, one can see that sophisticated users could obtain useful information that they currently don’t have.  Frequent updates to threat areas has the potential to give earlier heads up to people downstream of the ongoing severe storms, than issuing periodic warnings does.

George Phillips (NWS Topeka KS – Week 6 Participant)

Tags: None

Forecaster Thoughts – Milovan Radmanovac (2008 Week 6)

Coming from Serbia, my intention was to get familiar with the new technologies and new endeavors in meteorology, especially in radar meteorology, because that is the field where I’ve worked in for more than 15 years. The 2008 Experimental Warning Program spring experiment was a great opportunity to see the possibilities and practical implementation of some ongoing projects like the Phased Array Radar, CASA radars, probabilistic warnings…At the same time, through the EWP, I learned a lot about some other projects and systems (Mesonet, verification of severe weather, collaboration with TV and radio stations) and got a lot of ideas which can be applied or implemented within the meteorological services in Serbia. The Experimental Warning Project is especially important because there is the intention for improvement and modernization of the Serbian warning system, so the experience I got here will have a great practical value in my country.

Personally and on behalf of Hydrometeorological Service of Serbia, I’d like to thank you for being kind and making it possible for me to be a part of this program.

Milovan Radmanovac (Hydrometeorological Service of Serbia – Week 6 Participant)

Tags: None

Forecaster Thoughts – Kevin Brown (2008 Week 5)

I felt quite fortunate to be able to look at real-time CASA/PAR data sets. Although the amount of time and coverage of echoes was fairly limited, being able to see the rapid updates in real-time was valuable. Along with the higher resolution of CASA data, the increased frequency volume scans from both CASA and PAR appear to be challenges for the operational forecasters. The faster updates do not allow a lot of time for base data interrogation/interpretation, so forecasters will need to be more selective in what data to interrogate. This is primarily a training issue, to varying degrees, for each forecaster.

On two different days, we were able to work with probabilistic warnings in real-time, and from an operational forecaster perspective, I see great utility with this program. Currently, it can be quite difficult to get the overall thinking of the warning forecaster(s) across to his/her users and partners. There are shades of uncertainty that cannot be conveyed with the warn-no warn concept. Being able to issue probabilistic information should provide much more useful information to our partners and more sophisticated users. Conveying information probabilistically will allow some of our more advanced users to “get into the head of the warning forecaster”. During our probabilistic operations we mainly dealt with discrete supercells, and after a minimal amount of time, became somewhat proficient at issuing single and even multiple threat probabilities. However, I could see it being more challenging with squall lines and LEWP events.

I enjoyed the time I spent in the EWP, and am grateful for being able to work with such talented scientists.

Kevin Brown (WFO Norman OK – Week 5 Participant)

Tags: None