The Hazardous Weather Testbed (HWT) Experimental Warning Program (EWP) operates from the National Weather Center (NWC) in Norman, Oklahoma. I was selected to participate in the EWP during the first of the six week project for spring 2009 during the 27 April through 1 May period. Activities during the week were structured but flexible enough to encompass the given weather scenario. Working shifts started at 1300 LT and ended at 2100 LT. Work was conducted in the HWT Operations Room which is a large glass-enclosed room centered between the operations of WFO OUN and SPC. Daily briefings and an end of the week debriefing was conducted in the NSSL Development Lab.
My forecast partner during this week was Suzanne Fortin (EAX SOO) from Pleasant Hill, MO. The coordinator for the week was NSSL scientist Greg Stumpf. Following is a timeline of activity and general observations regarding our evaluation of several new applications, techniques and products during the experiment. There were four primary projects of focus each geared toward WFO applications: 1) an evaluation of experimental Warning Decision Support System II (WDSSII) 2) an evaluation of 3D Lightning Mapping Array (LMA) 3) an evaluation of the phased array radar (PAR) in Norman and 4) an evaluation of networked 3-cm radar (CASA) in central Oklahoma. Since the WDSSII display was less dependent on weather in Oklahoma, we operated during two live episodes in the neighboring CWAs of ABQ, LUB and MAF. Outside of active weather regimes or prior to convective initiation, our time was spent working with archived cases for each project. A longer intensive operations period (IOP) occurred late in the week as convection developed late in the evening over western Oklahoma, otherwise IOP and archived cases were contained in the normal eight hour shift.
Monday – Sue and I met Greg at the NWC entrance and began an abbreviated tour and orientation session due to anticipated convection within the immediate central Oklahoma area. The orientation included training on each of the projects and was conducted by the cognitive scientists associated with each. Project evaluation began with an IOP focusing on developing convection in central Oklahoma. Storms quickly died so we switched to an archive case from 2007 of TS Erin as it intensified over central OK. We were able to follow several small circulations in the PAR data. Overall the first day was largely a matter of learning knobology with the new display tools such as WDSSII and adjusting our warning decision paradigm given the rapid update times provided by the datasets.
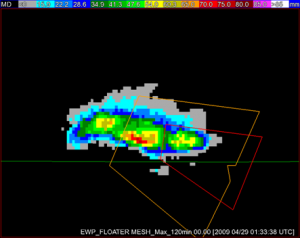
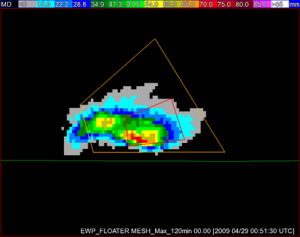
Tuesday – We began the day working through two CASA cases, one tornadic storm near my home town of Minco and another mini-supercell case. I became more comfortable with WDSSII GUI for interrogating the radar data but became overwhelmed at times having to consider five different radar views. The rapid updates were nice but each one seemed to present a new interesting feature that required investigation. We learned not to dwell too long on features but quickly evaluate their merit and move on to more recent data. This approach allowed us to stay ahead of developing storms as compared with the 88D. There were some gaps in the data due to the scan strategy employed with CASA so the 88D was still needed to evaluate higher tilts at close range. We ended the evening with an IOP concentrating on isolated storms In New Mexico and West Texas. The team utilized the multi-sensor/multi-radar output via AWIPS localized to WFOs ABQ and MAF. It was nice to operate within AWIPS and have the comfort of developing procedures and using warnGen to draw polygons. Some of the most useful products were the height of the 50db core above -20C and the MESH products. We particularly found the MESH tracks helpful in orienting polygons to capture storm motion. This can best be seen in the comparison images below between our polygons and those issued by WFO MAF.
Figure 1. Comparison of EWP warnings (top or left) and WFO warning (bottom or right). Note the difference in polygon orientation. The NSSL MESH track (image) was used by the EWP team to predict future supercell motion.
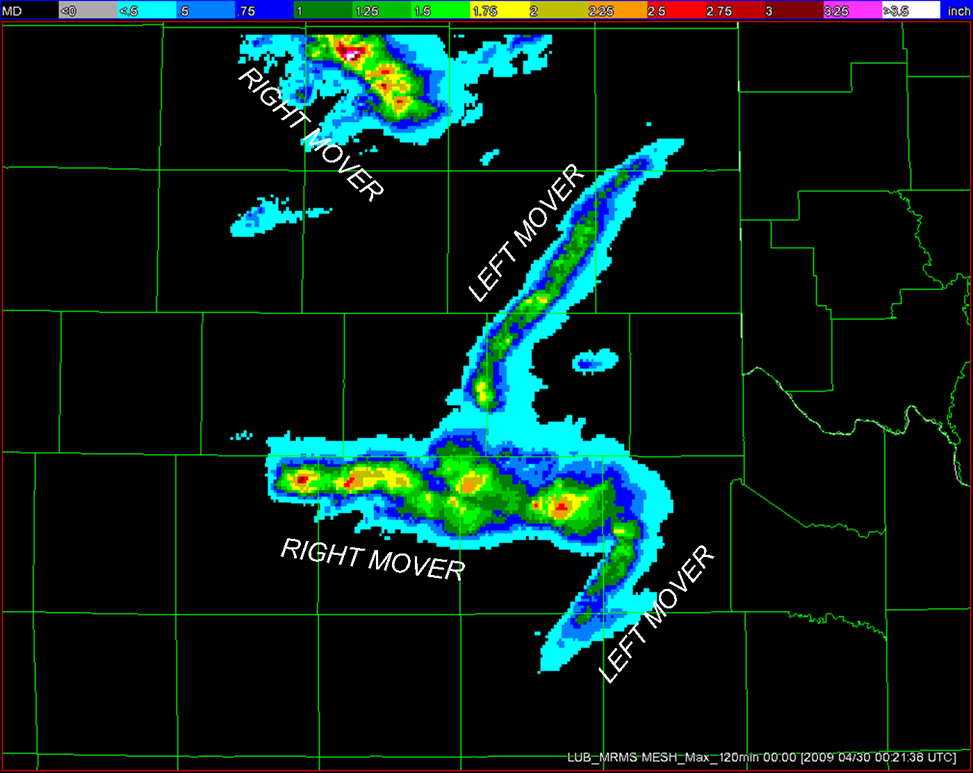
Wednesday – This was by far our most active IOP shadowing the forecasters at my home office in Lubbock. Both the familiarity of the CWA and working within the AWIPS framework attributed to high SA for this event despite it being busy. By this time most all bugs were worked out of the AWIPS system and we had procedures in place to evaluate the WDSSII decision support products. We quickly found our favorite few WDSSII products and cycled through them using the panel-combo-rotate feature deployed with AWIPS OB9 comparing them to base data from the 88D. In a couple of instances I felt we had better warning lead times due to enhanced SA provided by the diagnostic parameters. Once again our polygon orientation was highly influenced by the MESH tracks and appeared more cell based versus the WFO. It did become apparent that left movers present issues with rotational tracks and greatly underestimated hail sizes. Also values from the azmuthal shear products were a bit difficult to correlate to spotter reports. After the event I spent time in the hotel downloading archived images of MESH and meso tracks to send back to the WFO to assist in damage surveys the following day. There were a couple of significant tornadoes during this event over rural areas but they were well photographed by chasers. We also benefited from having live views of the storms via storm chasers available through http://www.spotternetwork.org.
Figure 2. MESH tracks, with left and right moving storms annotated (courtesy of Greg Stumpf). Warning polygons by the EWP team were again more storm-based than official NWS warnings based on the use of the MESh products. This image and corresponding meso track was sent to WFO Lubbock to aid in follow-up damage surveys.
We started the day Wednesday looking at an LMA case over central Oklahoma from earlier this year. The LMA data provided some usefulness for warning operations given the rapid update time (2 min) however this dataset is likely most valuable for longer fused products such as NOWs and SPSs. Product units were obscure to us in kg2/sec and we found that their interpretation increased as we combined them with other products such as the NLDN and reflectivity in the ice producing layers. There was good correlation with increasing updraft strength and tightening mesos but once convection became well organized and widespread it was more difficult to discern important features based solely on LMA data. Vertical cross sections or trend plots would also be helpful for display of the data but this was not possible during our portion of the experiment. It would be interesting to see LMA applications during winter or heavy rainfall events to evaluate other uses.
Thursday – A couple of non-tornadic events were the focus of our archived cases on this day. We interrogated PAR data at close range to observe a well-defined MARC signature and used FSI-like cross-sections on WDSSII to see the cores descend. I also found some application to the divergence fields but they appeared fairly noisy. A smoothed field or one at a lower resolution may prove more meaningful. The CASA case was a classic high wind event across the southern part of the domain but there was lots of convection throughout which caused issues with attempting to monitor multiple radars and keep good SA. The 3DVar analysis was nice in that it helped keep the focus on the proper location within the domain where the severe wind swath was occurring. It was difficult to manage five radars within the domain to keep pertinent storms visible on the main screen for complete interrogation. The composite image in this case was a life-saver and we frequently took wider views provided by the 88D to keep tabs on developing convection on the edges of the domain. We ended the day in IOP with a single supercell event in western Oklahoma, working with both the PAR and multi-sensor data. The PAR provided sufficient scans for detecting developing and decaying cells. At one point the azmuthal shear algorithm in the PAR showed an increasing trend while the multi-sensor data showed it decreasing with time. This discrepancy was possibly due to color curve differences between the systems but more likely a result of the way in which the multi-sensor data uses lower tilts and stronger mid-level shear was not going into the algorithm at longer ranges. There was considerable range folding in the 88D data and some in the PAR data but the PAR data by far was more consistent and provided a clearer picture of the mesocyclone evolution. Our warnings were consistent with OUN’s however we ended the tornado threat sooner than the WFO did.
Final Thoughts- Overall this was an enjoyable experience and highly educational. I truly appreciate being selected to participate. It is exciting to see improvements that can be made in the warning environment with new technology and the new application of existing technology. Although there was some spin-up time required, working almost entirely with base radar data from the new platforms made the transition easier. The PAR and CASA platforms bring a new dimension to storm interrogation with rapid updates on the order of 30 to 50 seconds. While there is some need for algorithms in this environment to provide integrated values of reflectivity or time and height tracks for rotation, a minimum of new tools is likely the best approach to introducing faster updates to the field. As a forecaster it was easier to adapt to the new scan strategies worrying just about the base moments versus also trying to get my hands around dozens of volumetric or new-scan products at the same time. As such, when working with the existing 88D network, the new algorithms provided by the NSSL multi-sensor applications integrated nicely with the base data and enhanced the already familiar process of storm interrogation.
Unlike this new technology which is likely decades from deployment, the multi-sensor/multi-radar applications have a role in today’s forecast environment and should become part of the AWIPS data stream. Southern Region should work with NSSL to provide at a minimum the MESH, rotational tracks and reflectivity heights above 0C and -20C as these were found to be beneficial during the warning experiment. Meso tracks and azmuthal shear products were also helpful to the EWP warning team and have value not only during the event but in post-storm analysis as well. The greatest value of the multi-sensor data is overcoming sampling issues at very close ranges to the RDA and to provide input from radars at an improved viewing angle especially for developing circulations. As a result, the SR strategy to improve warning effectiveness could be impacted directly and positively with the inclusion of these products into the field office decision making process. This is possible to some degree already through Google Earth but integration into AWIPS is necessary if true value is to be gained and to improve the timeliness of delivery of the products.
Steve Cobb (NWS Lubbock TX – 2009 Week 1 Evaluator)


