NMDA Failure in Low Level Scans

The NMDA failed to be of use on a tornadic cell east of Des Moines. A strong meso was detected by radar, but it was above the tilts that the NMDA was sampling to generate its output, so it generated ‘weak’ strength of the meso. It should be noted that the cell was only 21 nm from the RDA at this time (2013Z).

Strong AzShear is present on mid level cuts of the KDMX radar (3.1 degrees and above). The NMDA was sampling below these levels however to generate its output, and therefore missed the strong rotation aloft.

– Bacon Wrapped Hail

A few thoughts from the DMX archived case

-At the beginning of the event, while the TDA didn’t trigger high values (as tornadoes were being observed), it still ultimately added a lot of value. As a forecaster walking into that event, I probably would’ve thought that the chance for tornadoes as the cells were initially going up was around zero, so having guidance that showed that “hey look, something’s here” provided a lot of value added. So while the verification stats might not look great for this phase of the event, it potentially added more value than during sure-fire high end tornado warning scenarios. In those scenarios, the post-processed stats for the algorithms would look great, but they might not add as much value, since you’d have warnings out either way.

-It was also encouraging to see the high probs from both algorithms later in the event with the strongest supercell. As was brought up in discussions in our group, in that case those super high probs in both algorithms might have given you confidence to consider a higher tag on the warning (potentially the considerable tag).

-Squally McGusty

Aiding Situational Awareness

At this time, the northern supercell (moving through northern Marshall County) is beginning to rapidly strengthen.  At the same time,  the storm near Pella is extremely strong and likely doing significant damage, and could be taking the bulk of the attention of the forecasters.  Here, both the NMDA and NTDA have correctly identified the strengthening of the northern storm.  I think the algorithms could have been helpful in bringing attention back to the Marshall County supercell before it became any stronger.  This situation (two storms, one very strong and damaging while the other is rapidly strengthening) could be a “high risk” situation for loss of SA. This is especially the case on a day like this, when the overall situation was not well anticipated, and officing staffing is likely not at the level it would ideally be for such a set up.

– Rabbit

NMDA and NTDA Could Aid in Impact Based Warning Decisions

At this point the tornado is moving through the Pella area. There’s not much of a yes/no warning decision to be made here…it’s obvious that a tornado is ongoing.  However, I think it’s noteworthy to see both algorithms outputting extreme values.  This could aid forecaster confidence in “upgrading” a warning to the “Considerable” threat tag, or, depending on reports, a “Tornado Emergency”.  While we have several ways to ascertain tornado strength in real-time (rotational velocity, TDS height, etc.), having an extra nudger is very useful.  It can also be challenging to know when to discontinue the higher end wording in the warning; seeing the trends from these algorithms will be valuable data points.

– Rabbit

NMDA and NTDA Correctly Focusing on Area of Tornadic Circulation

In this case, the tornado circulation was well displaced to the west of the main body of the supercell.  Based on video and spotter reports, it’s likely associated with the very weak reflectivities west-southwest of the heavier reflectivity.  The NMDA and NTDA both correctly honed in on this area, despite little in the way of an obvious velocity signature.  One of the facilitators was able to share their screen and show the AzShear and DivShear outputs for this time frame, and the correct identification of the tornado location matches well with those fields.

– Rabbit

Marshalltown Tornado

This is 2133 UTC when the NMDA was maxed out with 8 tilts (0.5 – 5.1) being incorporated into the detection. Rotation track at the upper left shows how quickly this escalated.

Below is a jump ahead to 2146 UTC. Through this time, the NTDA was very consistent with tracking the circulation even as depicted in leftward curving rotation track.

-marfafront

NMDA detections competing for attention

This is a case where there are 3 NMDA detections in close proximity, two of them (the orange colored ones) are stronger than the third. The “orange” detection to the north uses 0.9 – 5.1 degrees elevations while the other to the south uses 0.5 to 1.3 degrees detection. It looks like two scales of circulation are being detected. This can be seen below in particular at the overlapping elevation cuts (0.9 and 1.3). By the time you get to 1.8 and 2.4 elevations, the larger scale circulation is by far more prevalent.

So here’s a thought. Imagine viewing this in all-tilts with icons displaying only if that slice is part of the detection? In this case, going up the tilts would show first the southern icon, then both, then only the northern icon. Knowing which tilts are involved for the NMDA is very useful information and functionality such as this could make that easier to assimilate.

–marfafront

NTDA detections with reported tornado

This seems to be an issue with undershoot. The NTDA uses only 0.5 degree elevation and at this range this corresponds to about 1600 ft AGL. That is likely well below cloud base. The upper right panel is mid-level rotation tracks and the panel immediately to the left of that is low-level rotation tracks. Note how rotation is more evident in the “mid” levels, which again underscores the disadvantage the NTDA has with just looking at 0.5. Side note: The NTDA and ProbTor (lower right) probabilities

Below is 2018 UTC:

The 2018 UTC screen shot shows a persistent and strong mid-level rotation track with good consistency on the ProbTor object. The NTDA has been jumping around a bit, again because it’s at a disadvantage because it’s still sampling below 3000 ft even at this range.

Below is another example of NTDA detections jumping around. In this case, perhaps it has more to do with the confusing velocity associated with merging cells.

-marfafront

UDCZ and beam blockage example

Below is a snippet of NMDA and NTDA detections. This area corresponds to the white rectangles in the upper left panels of the figure above.  The columns are labelled by elevation slice. There’s a lot going on here: unambiguous range issues, beam blockage at lower elevations, and a very strong Updraft/Downdraft Convergence Zone (UDCZ) that is also producing noisy velocity data at the UDCZ interface (ref. Spectrum Width in bottom row).


-marfafront

More Velocity Data Smearing

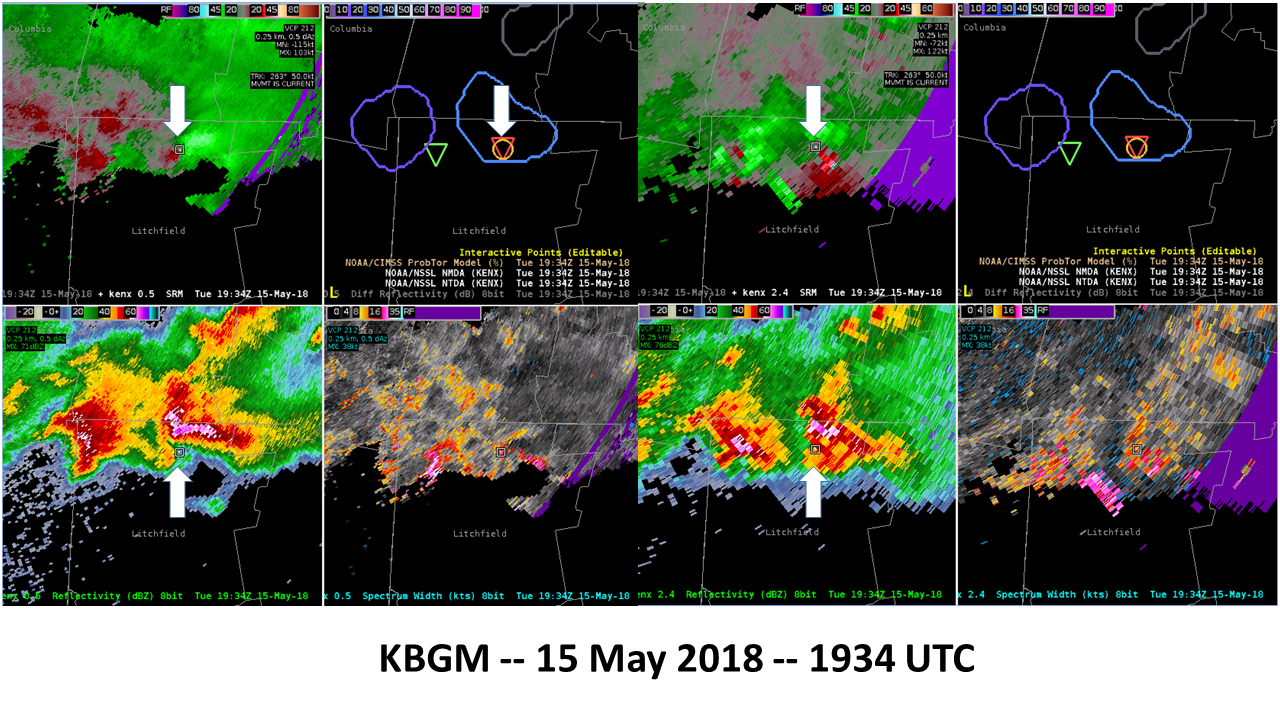
Here I’ve attempted to show how both the NTDA and NMDA are susceptible to vertical data smearing of velocity data. Cursor square locations refer to the position of the overlapping NTDA/NMDA detections. The 0.5 cut is to the left and the 2.4 degree cut is on the right. This is a tough problem, with perhaps Spectrum width providing a sanity check for the NMDA at least

-marfafront