Live Blog – 28 April 2008 (5:49pm)

We are in the process of educating our guests on the gridded probabilistic warning concept. Our IOP will probably begin around 6pm, over the Ohio Valley. Hoping there are still storms around when we begin, as the training today is taking a little longer than we planned. We also need to take a dinner break! So I’m going take notes on the blog to capture some of the PW training discussion.

Some good questions already – what probability numbers should be used? Forecasters need to be calibrated since they haven’t really thought about this.

How will we verify events in sparsely populated areas like the desert Southwest?

The spreading polygon is opposite to a probability contour. If the initial warning is set to, e.g., 50%, as the warning grows larger down the swath, the probabilities are actually smaller due to the uncertainty. If you look at a probability grid, the 50% contour will actually come to a point rather than spread out with time.

We’ll try do a demo live case, with NSSL driving first, and then letting each forecaster try it out, before the forecasters go through the archive case with the job sheet. The archive case will be doneon Tuesday.

Greg Stumpf (EWP Weekly Coordinator, 28 April – 2 May)

Tags: None

Outlook – 28 April 2008

Our first set of visiting forecasters arrived today. Mike Cammarata (Columbia SC), David Blanchard (Flagstaff AZ), and for today only, Ken Cook (Wichita KS).

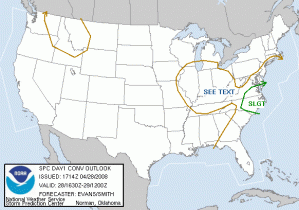
I didn’t have much time to brief on the weather situation today, but one this is for sure – no Central Oklahoma storms….for a few days. There is a Slight Risk for Eastern VA/NC (departing cold front), and a “See Text”, formerly a Slight Risk, over the Ohio Valley (cold core upper level low). The East Coast event is currently ongoing with several tornado warnings. However, we need to get the visitors trained on WDSSII and the gridded warning software (from 3-5 pm today), so we plan to let those storms go offshore, and hope for some hailers over the Ohio Valley during an IOP of 5-9pm.

Greg Stumpf (EWP Weekly Coordinator, 28 April – 2 May)

Tags: None

Shakedown Week Summary: 21 – 25 April 2008

Our first week of “operations” has completed, our operational shakedown week. We conducted our first end-of-week debriefing with a large group of NWC participants. Some of the highlights:

We discussed how to hold these end-of-week debriefings. They will include:

  1. A daily debriefing of Thursday operations.
  2. Scientific and technological discussion about the various projects.
  3. Logistical concerns of the visiting participants.
  4. Overall discussion on how we might improve the experience for all participants.

We also had a discussion on how we will introduce the visitors to the experiment at the orientation seminar. One particular item of note was to point out that we are running a research experiment, and that we should all expect bugs, kinks, and wrinkles. The forecaster/evaluators should look beyond those and focus on the bigger picture, to the future of NWS warning operations and technologies.

We finished the meeting with a lengthy discussion on the gridded probabilistic warning experiment.

One suggestion was to suggest at the orientation seminar that the forecasters should divorce themselves of the non-meteorological factors that effect their warning decision making, for example:

  1. Not getting verification due to low population.
  2. Letting certain users or subsets of users dictate your meteorological decisions.
  3. Turn off the county and city overlays…

…and focus on the science and meteorology!

Some discussion on what metrics we might measure included:

  1. Lead time for each event at different probability thresholds versus deterministic polygon. Can use LSRs, or hail tracks/rotation tracks for time of arrival/departure.
  2. Kristin talked to Harold Brooks, who suggested the forecasters, when issuing their warnings, treat our initial probability plateau as the probability of an event within the initial threat area, and not within x distance from the grid point. We can do that kind of analysis after the fact with the collected data.

Finally, we discussed the kinds of feedback we might seek from the forecasters. I’ve summarized the discussion:

1. Evaluate the concept of continuously advecting threat areas

  • How do we define the initial threat area?
  • Equitable lead time
  • Canceling out back of threat with time
  • Maintaining the threats during lifetime of storm

2. Provide feedback on the science of adding uncertainty information to warnings.

  • What baseline probabilities relate to today’s storm-based warnings?
  • How do we calibrate these probabilities over time?
  • Using algorithms to offer probabilistic guidance as a “first guess”?
  • How does enhanced verification (SHAVE reports) affect your WDM?

3. Assess the scientific and technological concepts before they are implemented into the NWS Next-Generation Warning Tool (NGWT).

Kiel added a “check box” to the polygon GUI that a forecaster could check when they think the current threat area that they are warning has now reached their “internal criteria” for issuing a storm-based warning of today. There was mixed reaction to that idea, but most folks generally felt it was ok to leave that there.

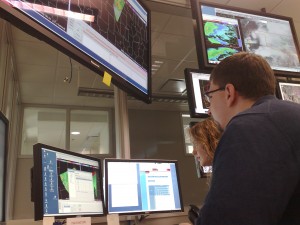
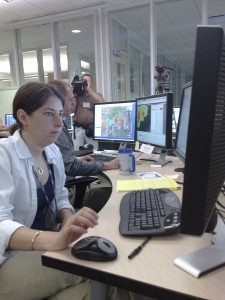
Here are some various images from the week. Most of the folks working this week were our future weekly coordinators and cognizant scientists, getting training on the various system and acting as “forecaster/evaluators”. Their comments and suggestions have been very helpful.

Greg Stumpf (EWP Weekly Coordinator, 21-25 April)

Tags: None

Forecaster Thoughts – Patrick Burke (2008 Shakedown Week)

Experimental Warning Program Blog Entry: 4/23/08

Patrick Burke

Between 3 and 5 pm today, Angelyn Kolodziej and I ran through an archived event, using PAR data as the basis for mock severe weather warnings. We both noted the utility of rapid-update radar data in catching the onset of low-level mesocyclogenesis. It was also enlightening to interrogate storms as a team viewing the same data. This forced us to state our reasoning aloud, and resulted in a verbal exchange of conceptual models and warning philosophies. I felt that we arrived at more accurate and timely warning decisions than either one of us could have accomplished alone. When the 1.5 hour simulation concluded, it was fairly obvious from my five plus years of NWS warning experience that we had issued more warnings over a small area than we would have issued using WSR-88D data. Angelyn and I suspect the PAR scan strategy captured certain features that tipped the scales toward issuing a warning, and which may have fallen between traditional WSR-88D volume scans.

Shortly after 5 pm, we had intended to begin probabilistic warning operations, but paused to observe the supercell that came up to the south and east of Norman. All eyes were fixed on the live updating PAR data and the SADS. Oklahoma City television crews delivered video of a low hanging wall cloud with rising scud, but weak rotation. The circulation never quite tightened up, and the storm had trouble maintaining supercell structure for any length of time.

The Norman storm was at the southeast extend of an extensive cluster of multicell thunderstorms that spread northward across Oklahoma through mid evening. Between 6 and 8pm, Mike Magsig worked this activity from one of the probabilistic warning desks. Meanwhile, at the second desk, I shifted my attention to an ongoing high-end severe weather event in north Texas. A long-lived, high-precipitation supercell moved eastward into the Fort Worth WSR-88D domain. This storm expanded in size, forming a classic bow echo anchored by a broad mesocyclone at the northern end. An exceptionally intense rear inflow jet presented 90 to 100 knot ground-relative velocities at times. Out ahead of this complex, another large supercell formed and approached the southern sides of Fort Worth. This storm quickly took on the appearance of a classic, tornadic supercell. Eventually, the bow echo overtook the tornadic storm in the vicinity of the KFWS radar. With the advantage of near range sampling at low levels, the radar detected several small-scale vortices along the leading edge of the storm outflow.

The variety of storm modes and storm motions in the two operational domains fostered a productive discussion between myself, Mike, and Greg Stumpf. Mike had difficulty drawing probabilistic grids for the transient multicell hail storms taking place in Oklahoma. One potential approach may be to outline a broad area of low probability severe hail, and then embed shorter duration, higher probability warnings for particular cores that show some persistence or organization. Whatever the warning philosophy, the actual grid preparation could benefit from some type of automated routine or suite of routines for defining a threat area. For instance, a tool that outlines the 55 dbZ contour with attention to echo overhang might be a good starting point for drawing a hail threat area.

The Texas storms brought up a host of even more complex issues, including personal tornado warning thresholds expressed as a percent chance of tornado, detailed spatial resolution of tornado threats (e.g. high probability surrounding a TVS and lower probabilities along the RFD gust front), and how to emulate longer lead-time information in a probabilistic way (e.g. drawing a 2-hour probability swath to mimic a special weather statement that WFO Fort Worth issued to raise awareness in the metropolitan area).

Much of our conversation stemmed from large scale design issues, using examples from the evening’s data to explore probabilistic warning strategies. In general, we concluded that in designing a probabilistic warning system, researchers may begin with an idealized philosophy, and then incorporate forecaster preferences that have been gained through experience. Many of these preferences will hopefully become evident throughout the course of the EWP spring activities.

Patrick Burke (WFO OUN Forecaster, EWP Weekly Coordinator-in-Training)

Tags: None

Summary – 24 April 2008

From 3-5pm, I trained Liz Quoetone, Jim LaDue, and Pail Schlatter on WDSSII. At the end of the training session, I tested a bug fix for the gridded warning software, and now, none of the warnings are automagically disappearing any more! Just a few more small issues, and the software should be ready to go.

Starting around 545pm, we began our gridded warning IOP centered on several storm which developed in NW KS. I spent the first hour explaining the software to Liz and Jim. Then, Jim took over the driver’s seat, followed by Liz, and then we wrapped up at 830pm. Several severe storms developed in the area, including one supercell that was a very large hail producer, and possibly a tornado producer. We issue gridded warnings for both hail and tornado on that storm.

During the event, we decided to try a new thing – live blogging. Jim and Liz put their thoughts on the blog as the event was occurring. I’ve decided that this would be a great idea for the gridded warning experiment. The cognizant scientist and/or one of the forecaster/evaluators should blog live during the IOP to share their thoughts in real time. We’ll try to put these live blog on a separate page in the EWP Blog.

Friday is the first of our end-of-week debriefings at 10am. We really don’t have a firm plan for how we are going to conduct these just yet, so we will probably spend some time discussing how we are going to conduct these weekly debriefings in the following 6 weeks.

Greg Stumpf (EWP Weekly Coordinator, 21-25 April)

Tags: None

Live Blog – 24 April 2008 (8:25-8:30pm)

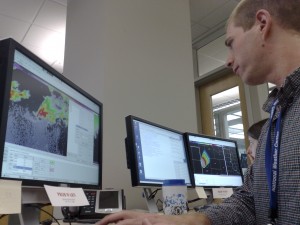
The storm merger has occurred but there are still distinct inflow notches aligned east-west on the south side of a >50dBZ contiguous low-level core. We’re seeing the strong SR inbounds in the core but no outbounds south of the core due to poor signal.

Liz’s binary TOR threshold is 30% so she dropped the probabilities to just above that level. This means absolute probabilities will not be consistent between forecasters. Should they be relative to a personal TOR warning threshold?

Oh, when Liz made a loop, the edit polygons dialogue box also looped in an annoying way.

The end. NO tornado observed yet though dust was rising in some chaser’s streaming videos.

Jim LaDue (EWP Weekly Coordinator-in-Training)
Tags: None

Live Blog – 24 April 2008 (8:16-8:21pm)

Live stream from a chaser east of GLD shows a wall cloud northest of Thomas, KS.

Liz took over prob warn and as expected, is experiencing a big learning curve. Warnings may not be totally accurate. We’ll need at least an hour for each forecaster to get up to adequate skill in WG.

Jim LaDue (EWP Weekly Coordinator-in-Training)

Tags: None

Live Blog – 24 April 2008 (8:05-8:15pm)

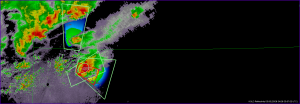
At 2005 UTC, we had a storm merger east of GLD. THe lead supercell was starting to produce a moderate low-level meso and I decided to update my TOR probabilities to start at 50% which happens to be my personal tornado warning threshold. The environment was marginally favorable for meso induced tornadoes and pretty favorable for supercells in general. So my impression of the environment was not great. There were no spotter reports despite potentially good coverage. Thus I kept my tornado warning probabilities just above my threshold and not higher.

Greg and Liz were wondering what made me set a 50% probability of a tornado as a mental threshold of a tornado warning. I replied that I felt that I wanted to be more than half confident that a tornado would occur inside my threat area as it expanded and moved downstream. However I’ve been issuing tornado warning proababilities well before I reached the 50% threshold.

I found another challenge in maintaining my storm motions between threat types for the same storm. I became preoccupied with updating the TOR threat area and storm motion as the storm turned more to the right. After I updated the TOR threat area, I became distracted by an out of date hail threat area with the left mover. However, I should’ve updated the storm motion for the hail threat area for the same storm I had followed with the TOR threat. Since I didn’t, the two motions, and subsequent threat swaths were in totally different directions.

Jim LaDue (EWP Weekly Coordinator-in-Training)
Tags: None

Live Blog – 24 April 2008 (7:02pm)

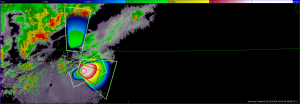
Liz, Greg and I are tracking a pair of storms northeast of GLD. The lead storm is a supercell while the trailing storm is more obviously multicellular consisting of ordinary cells. We’re raising many questions about the probability warning guidance issue.

Questions include:

  • Liz asks how does she maintain some kind of connection with her user? Greg counters that the warning meteorologist should be separated from the user. Afterall there are many types of users, each with their own thresholds for warning. There will still be a need for some kind of binary product that the lowest common dissemination method (e.g., NOAA wx radio) can still transmit. Liz is not comfortable with losing the connection with the user. Greg says someone will likely be filling this role.
  • Can we set a threshold probability in the prob warning tool for which when passed, the tool flags the swath as an official binary warning?
  • Can a forecaster set his/her own threshold warning probability?
  • Liz wonders if we can save each forecaster’s warning thresholds so that we can see how each one thinks? My 50% is your 30%, for example. This process may shed light on forecaster differences (biases) in the assessment of probabilities.
  • Can metadata be added to each threat area ID so that any input not easily translated to grids can be added? Greg suggested that it could be a blog for each threat area. We’re thinking that metadata could include special call-to-action statements, forecaster reasoning, adding context to the event and others.
  • Liz wonders how we could translate any of this metadata to something that is consistent with text in current warnings.

Greg would like to have the individual threat area translucent overlays (H,W,T) to be separated out so that we can toggle each threat area type on and off.

Jim and Liz would like product legends to be simplified. Hard to get time and elevation cut/height to stand out.

Jim would like to be able to change from irregular polygon to ellipse in mid process.

Jim LaDue (EWP Weekly Coordinator-in-Training)
Tags: None

Outlook – 24 April 2008

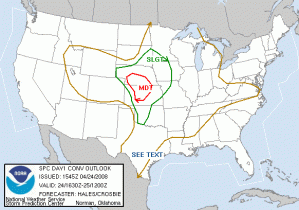
Another moderate risk day over NW and NC KS and SW NE, with a slight risk extending down into Oklahoma. The big question today is whether the cap south of I-70 will break. The operational RUC says yes, but all the SPC ensemble members and the deterministic NAM and ETA say no. But, we will be on guard for Central OK operations nonetheless.

The progs predict a strong surface cyclone in SW KS, with wrapping moisture and instability northward to the east of a dryline and around the north side of the low. Strong upslope north of the low will be a decent target for today, but the shear isn’t as great up there than points further south along the dryline. However, there is that cap to content with.

The plan is to operate a gridded warning IOP from 5-9 in Western KS and SW NE, where the initial storms develop. If the cap miraculously breaks in OK, we will shift south, and also operate the PAR. No CASA operations are expected, as the radars are not yet ready.

Greg Stumpf (EWP Weekly Coordinator, 21-25 April)

Tags: None