Here is a possible way to display the ENI total lightning data and points to select a time series in the panel to the left and then the resulting time series to the panel to the right, so both are visible. Here my selected point 13 and total lightning plot is what generated the times series for point 13. MrSnow
SPS Custer
High Initial ProbSevere
High CI in an area of showers
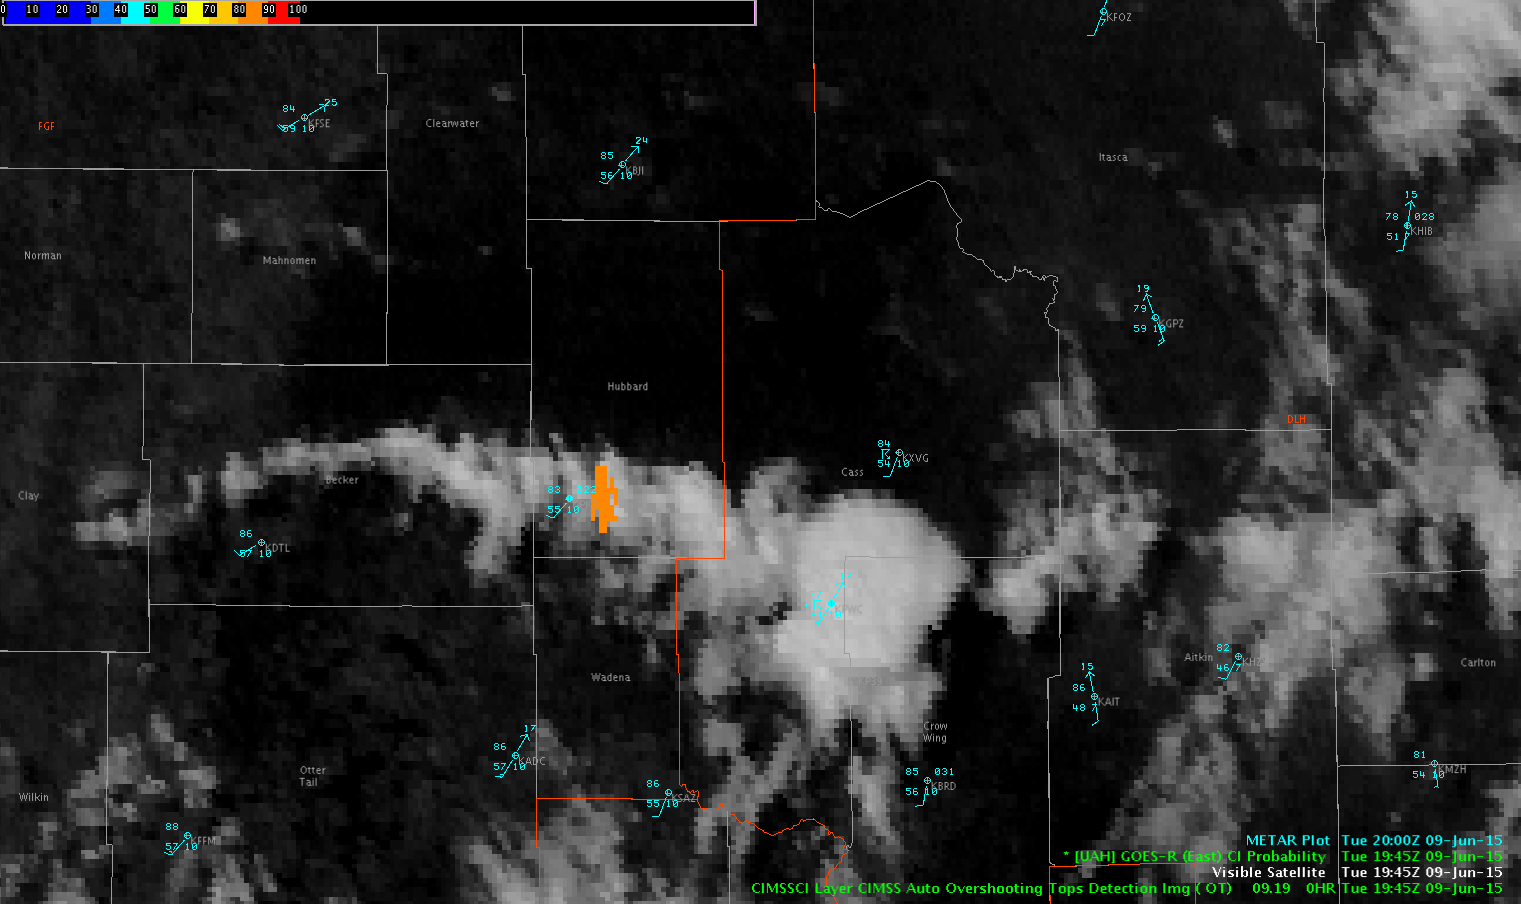
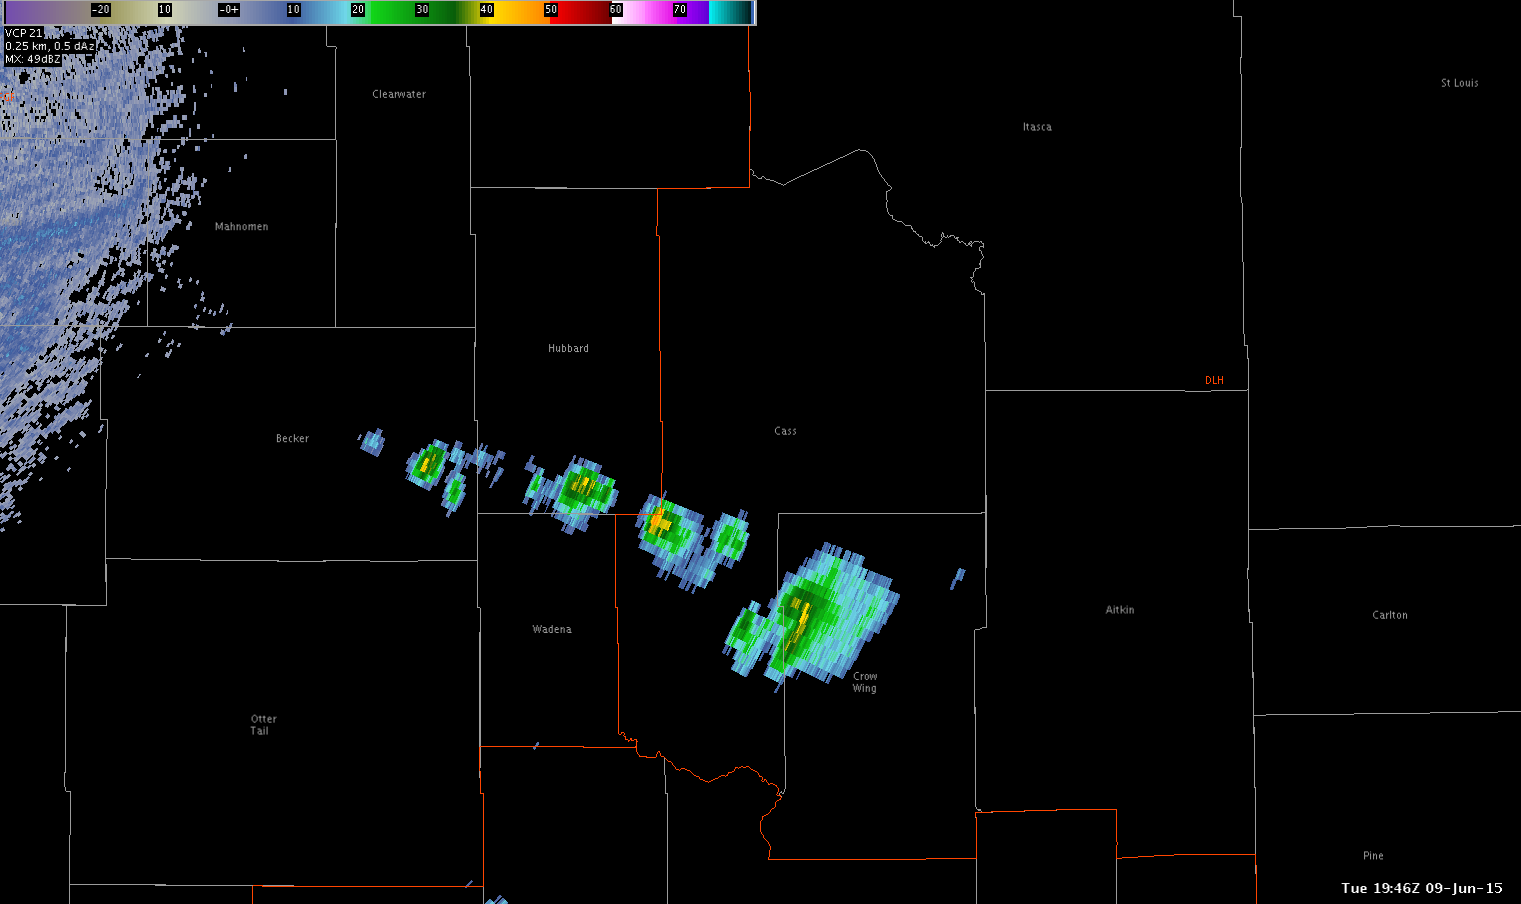
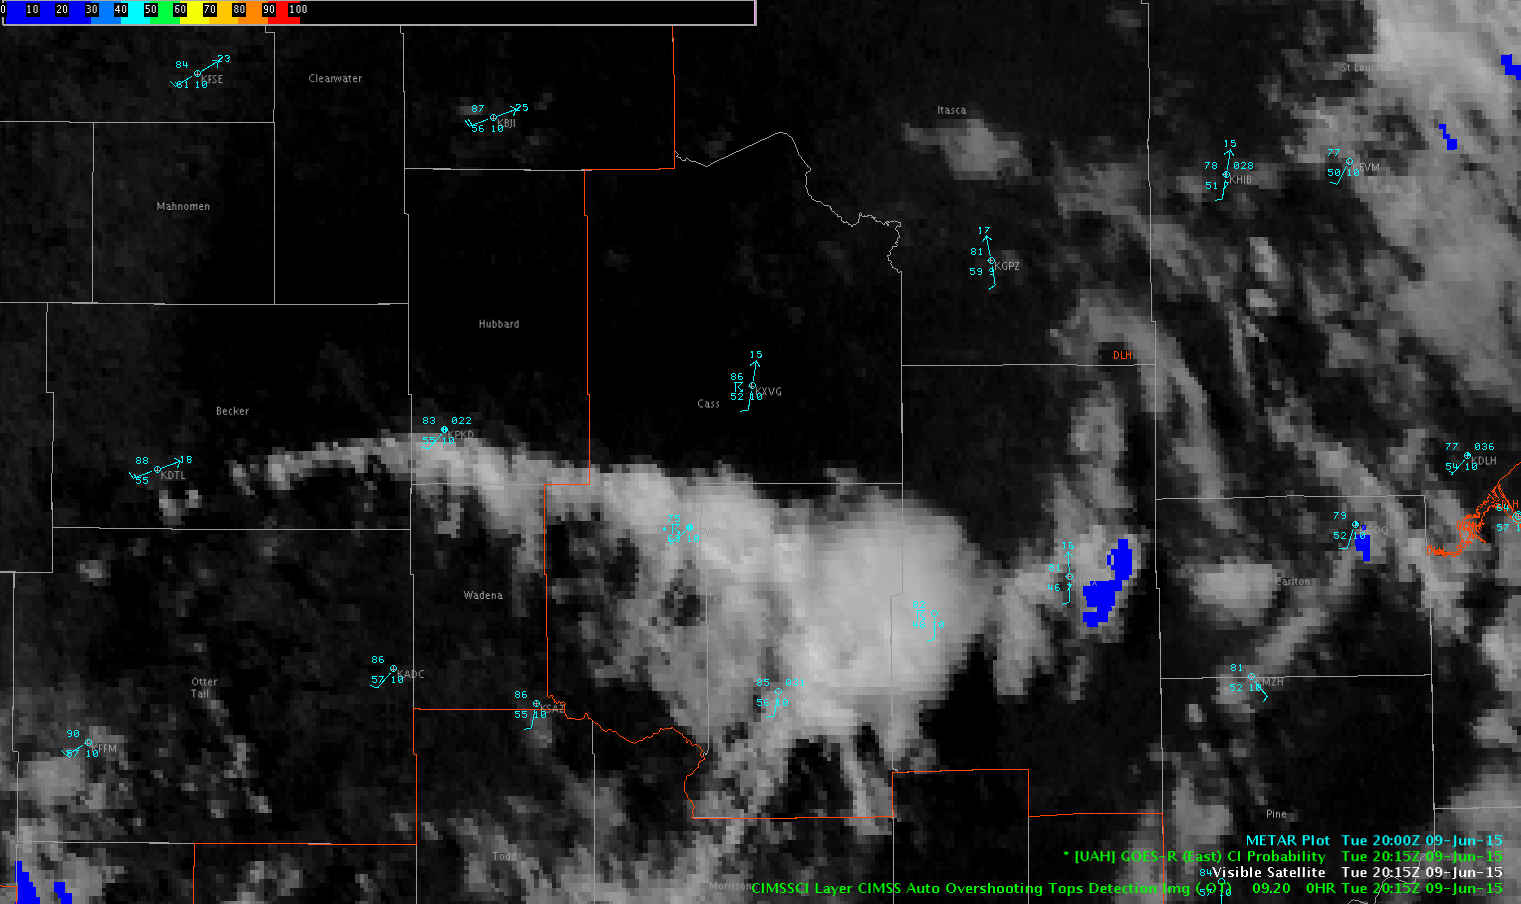
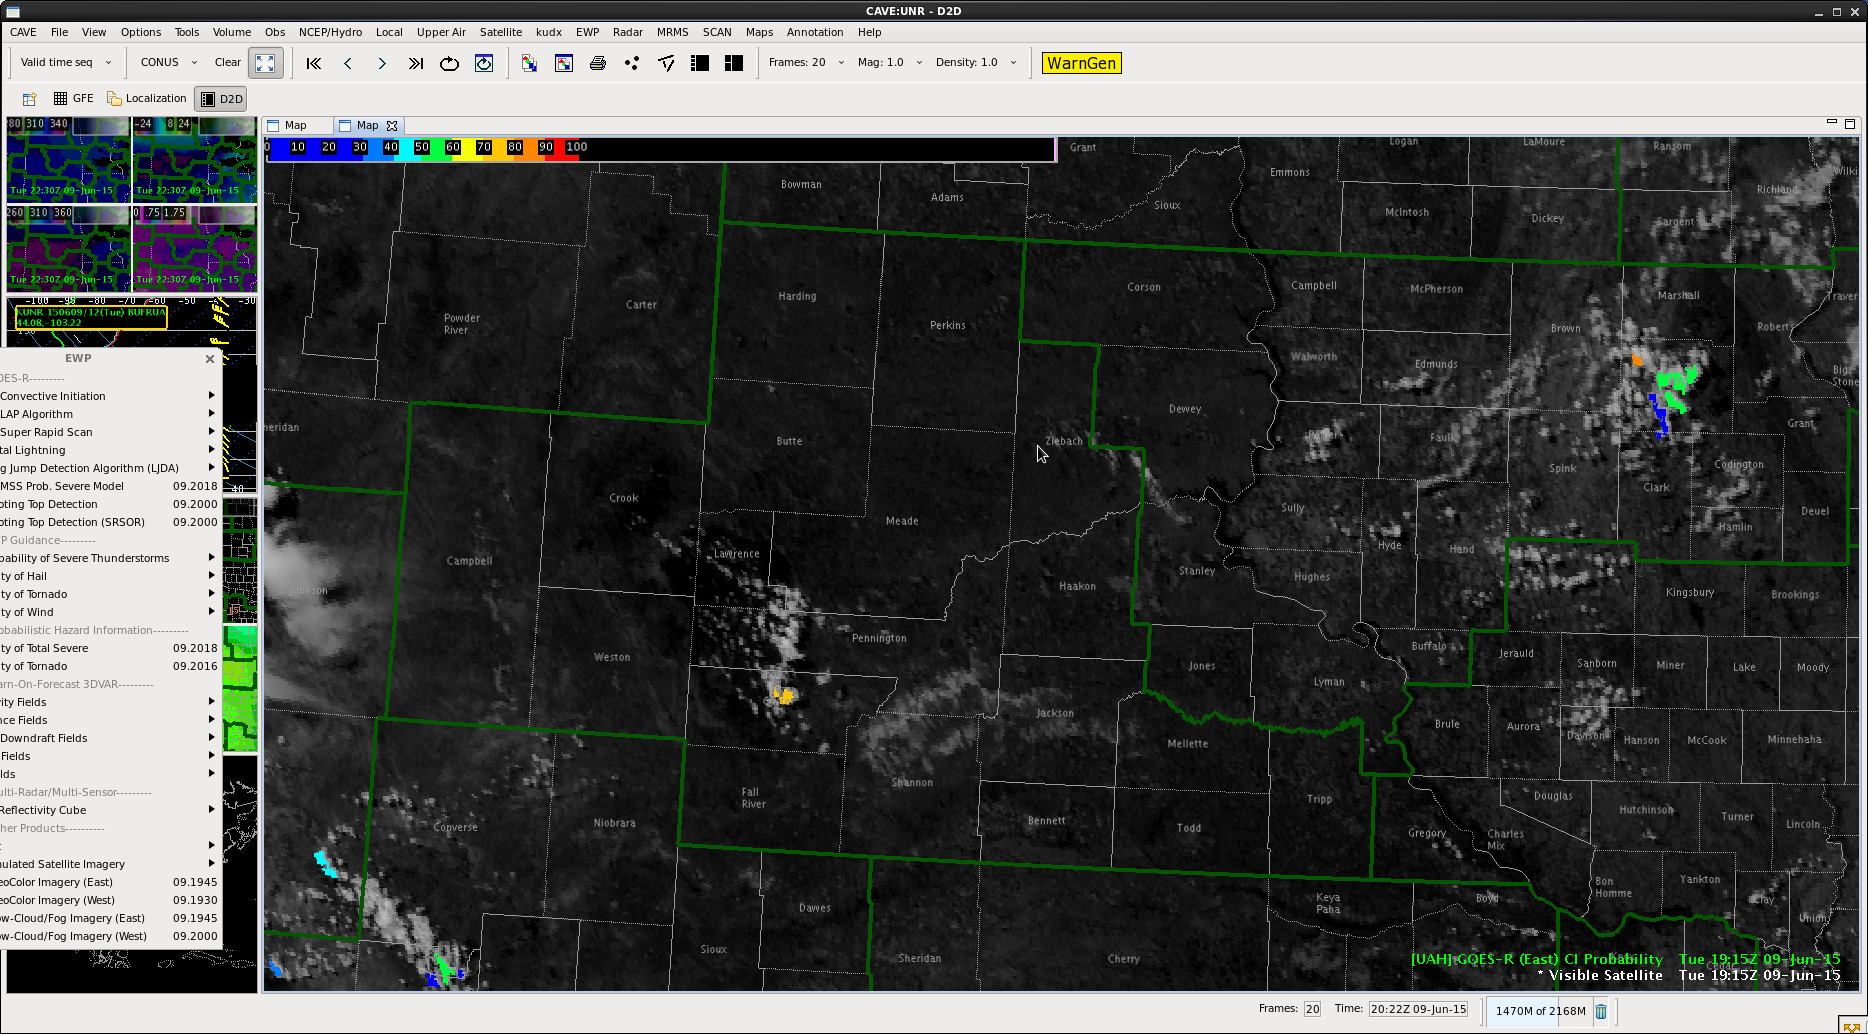
Watching the CI values along a line of weak showers, the 1945Z image popped up an 83%. The corresponding radar image out of FGF showed nothing more than a weak thunderstorm in the area with only one lightning strike detected (not displayed)
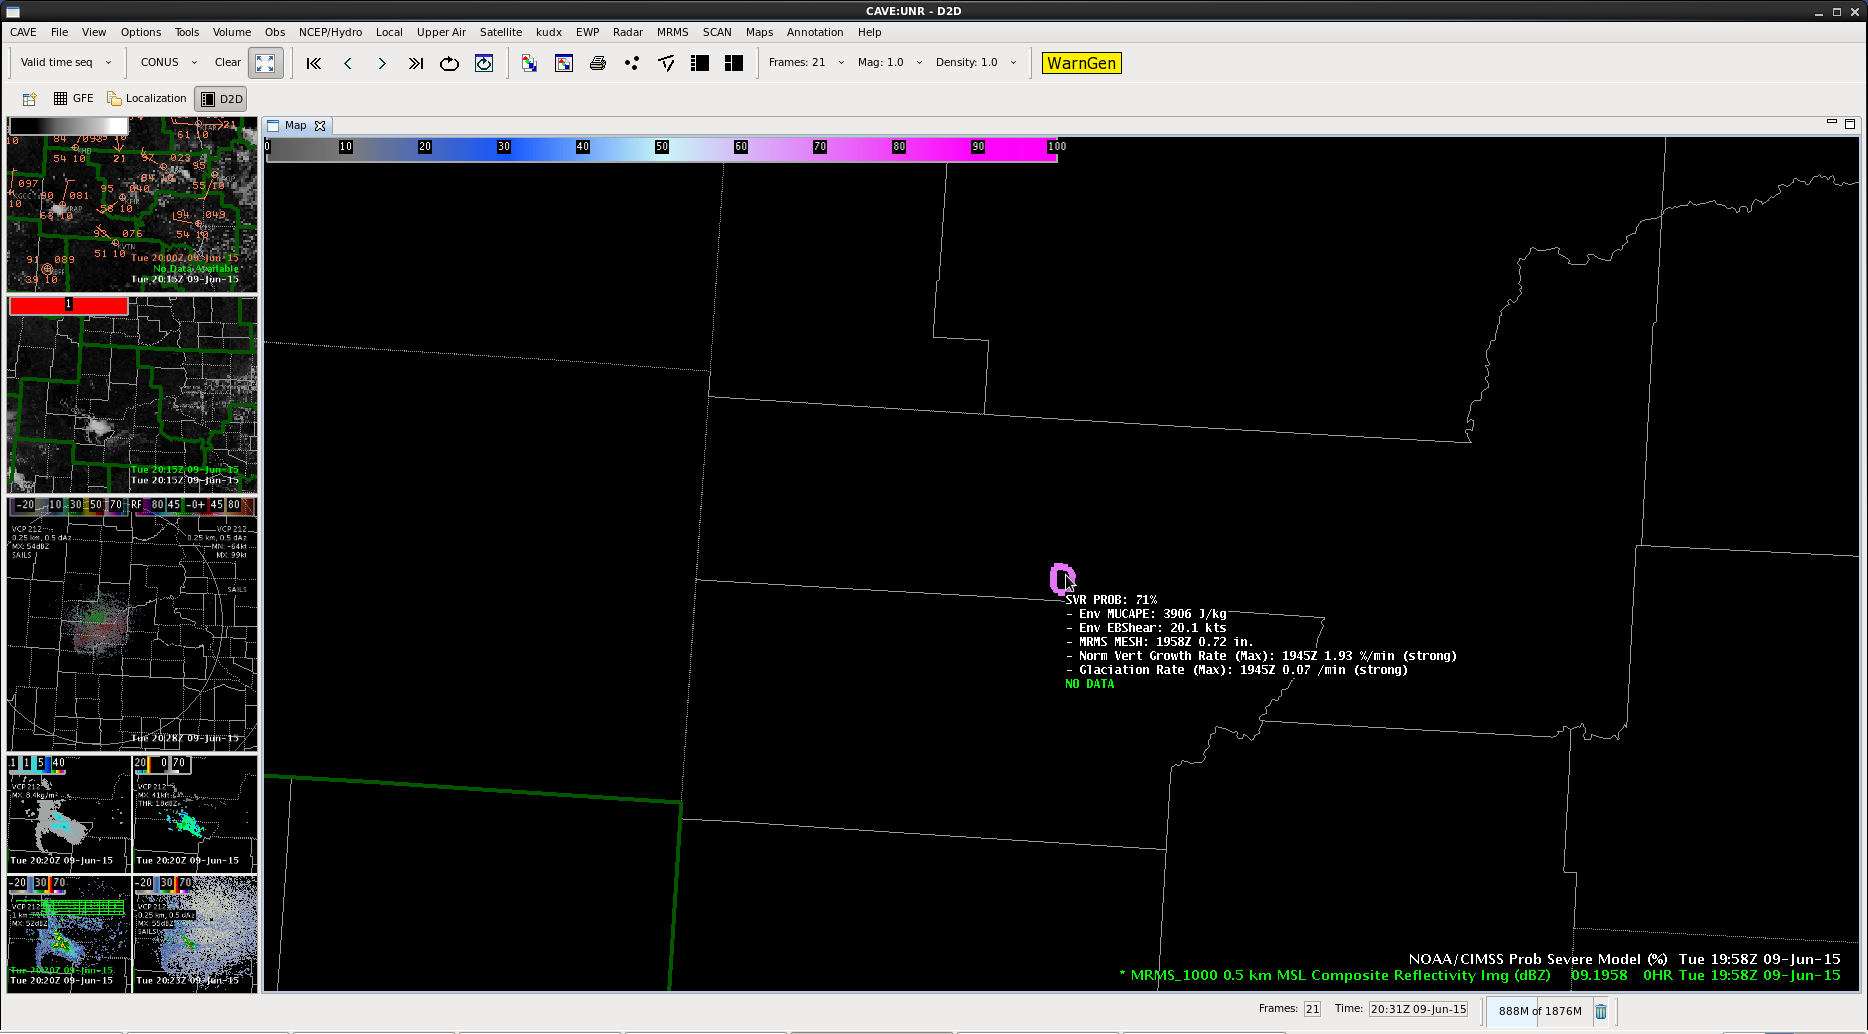
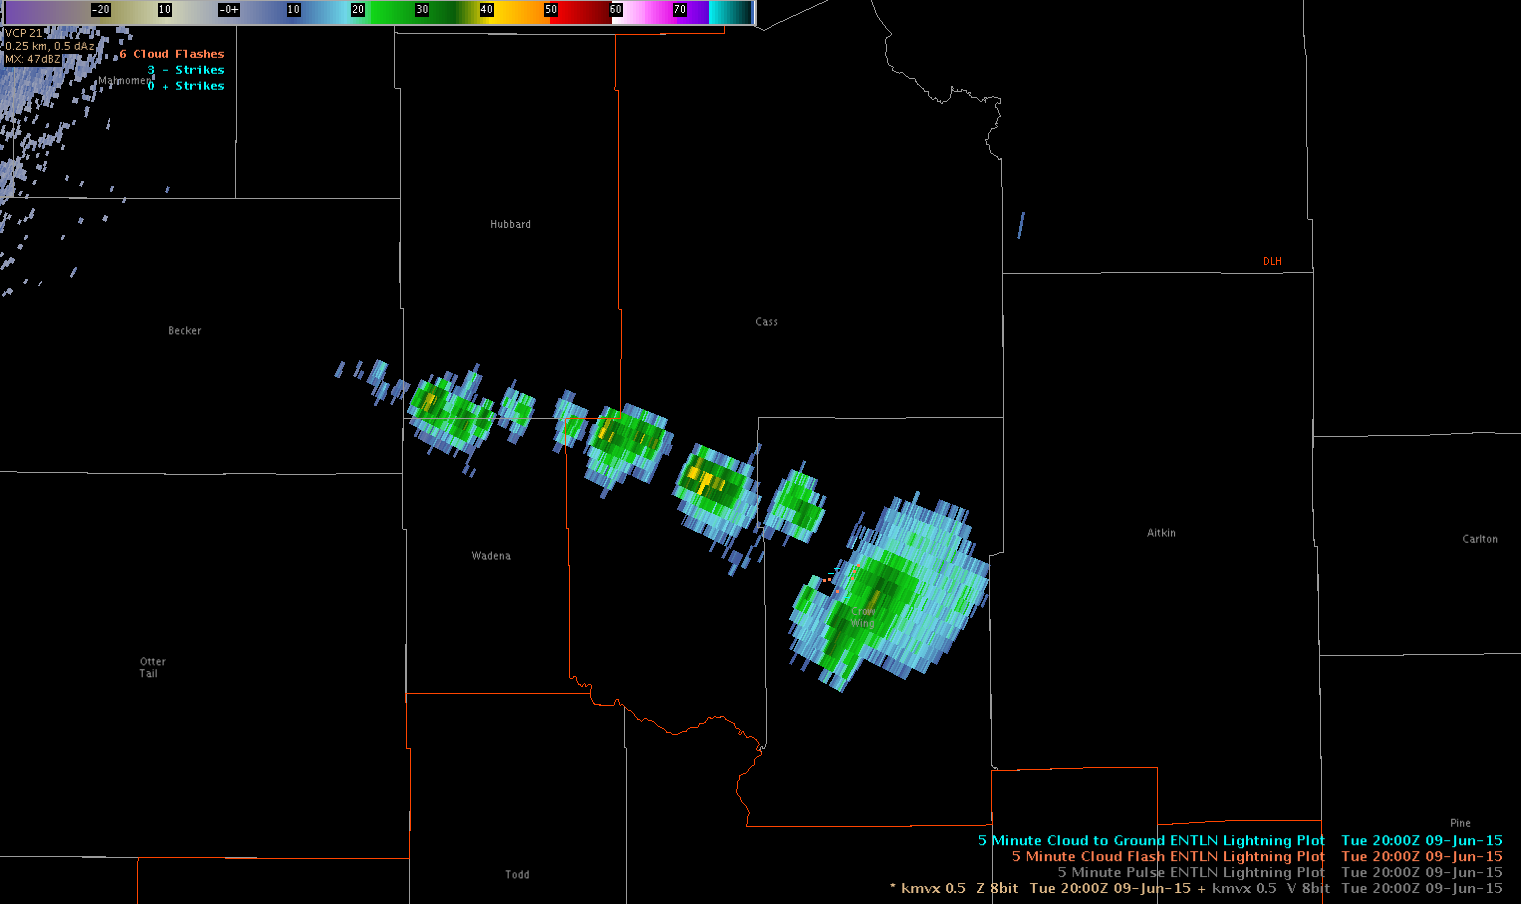
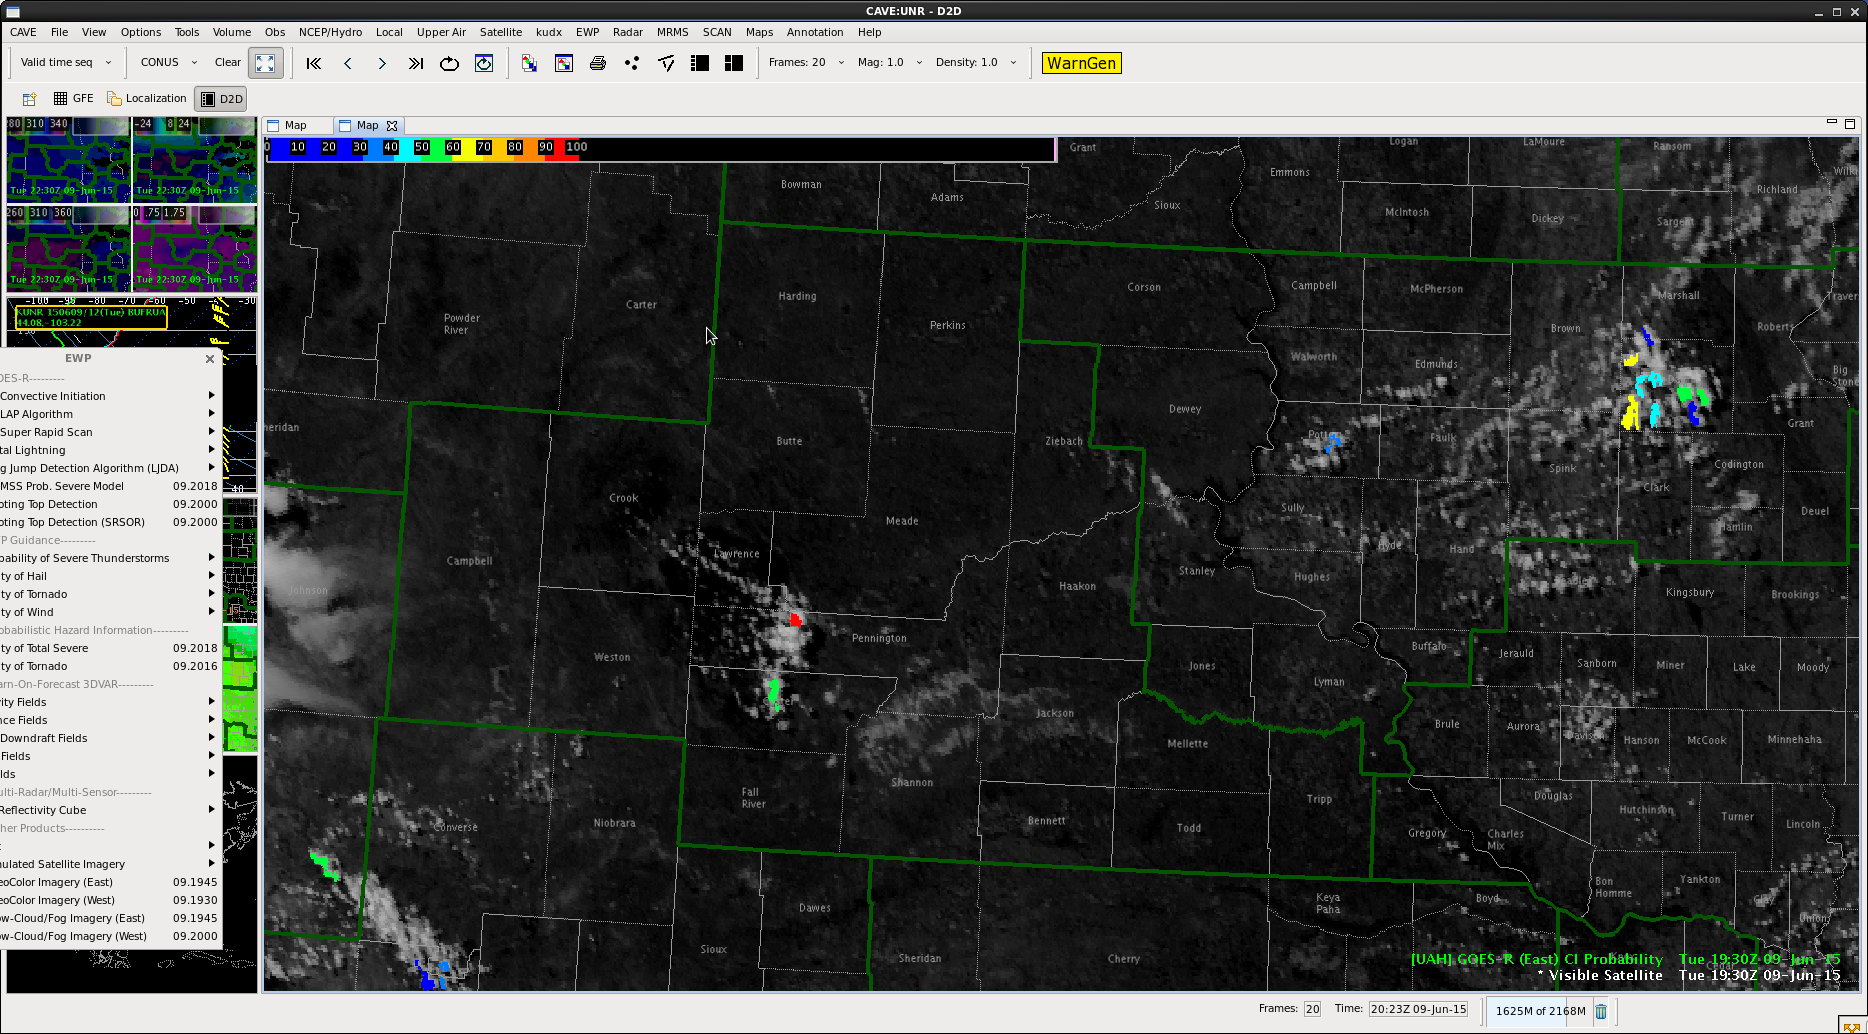
Fast forward to 2000Z, the higher CI values (71%) have moved westward along the line. This makes sense as the line of weak showers/thunderstorms continue to build west. There has been no further development of cell that had the earlier flag of 83%.
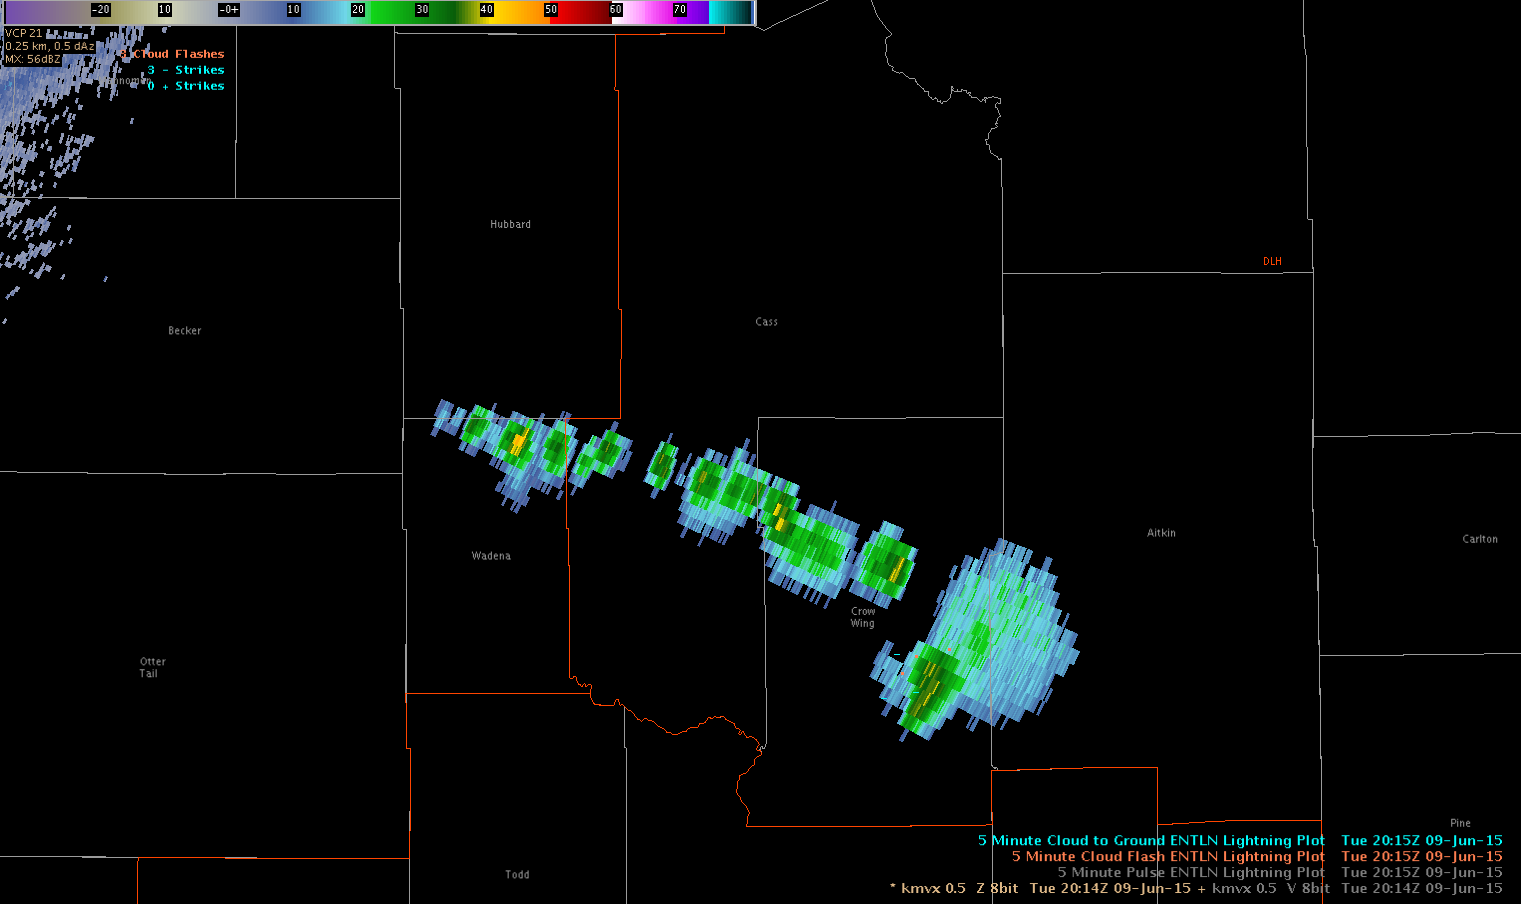
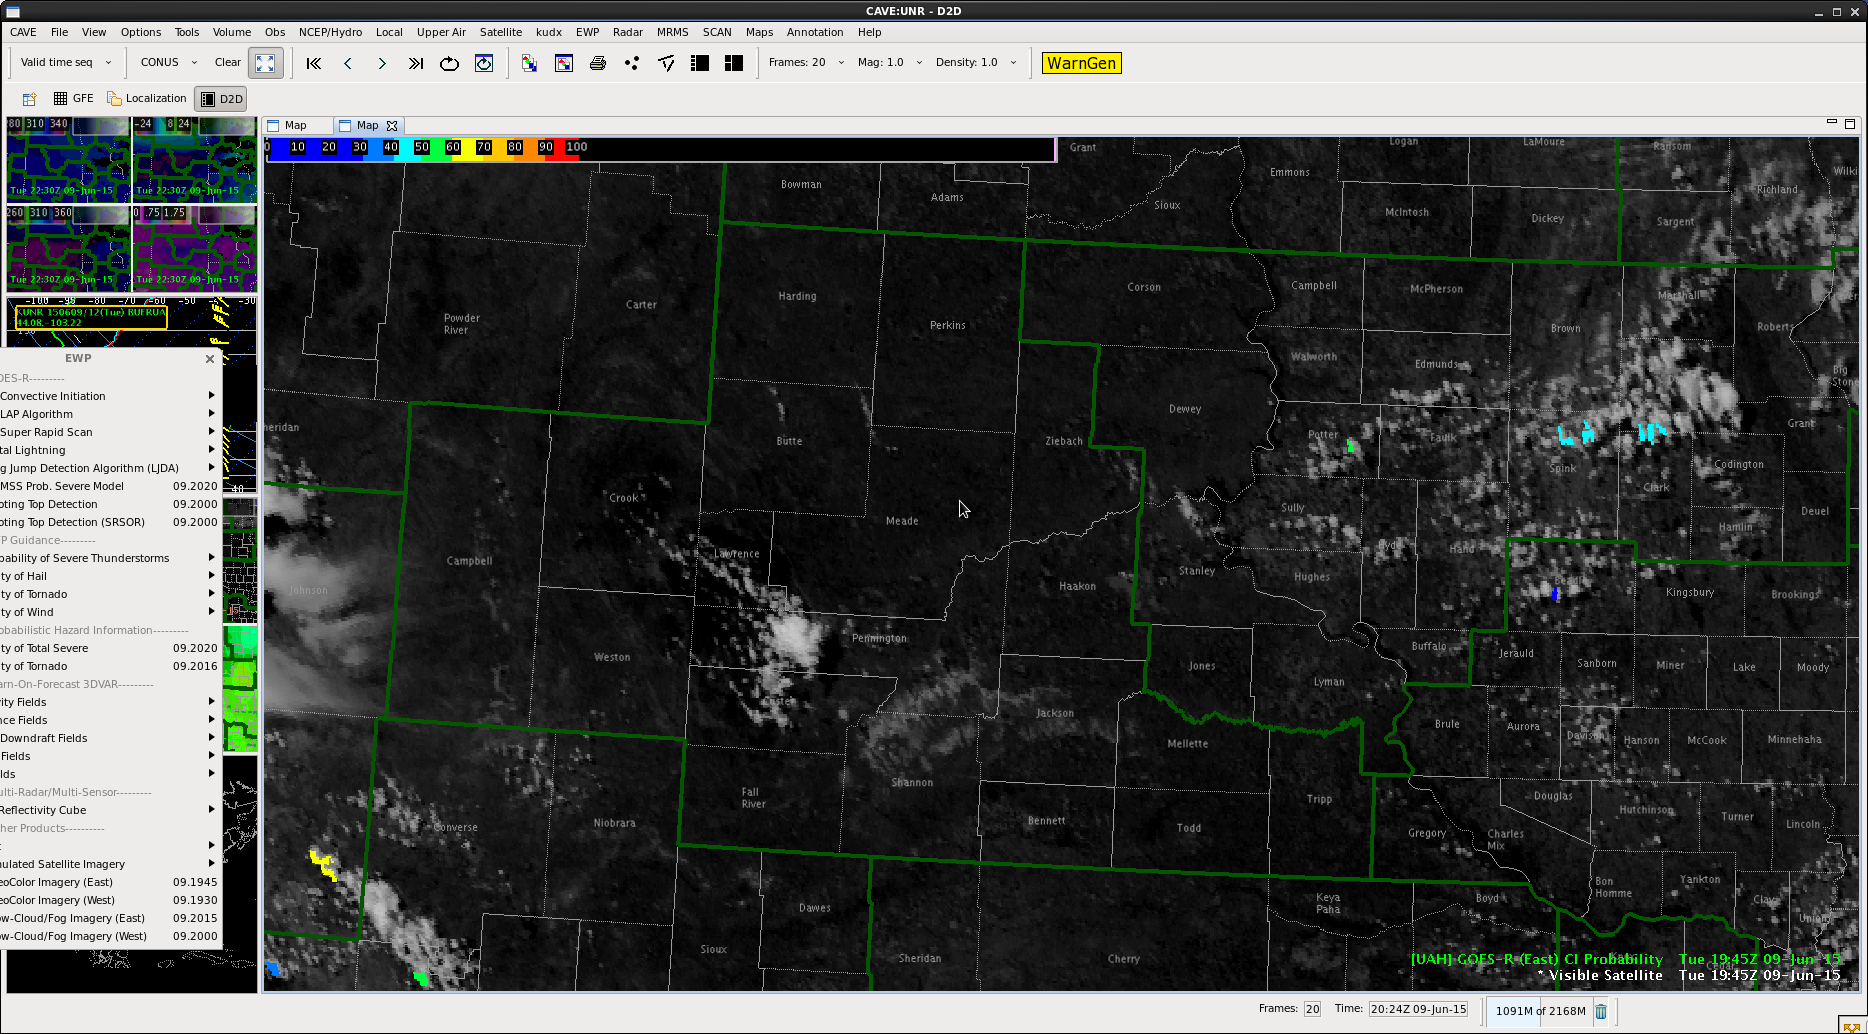
Fast forward even further to the 2015Z images. The CI output disappears and the corresponding radar image shows no further development.
-Shasta
SRSO showing marine stratus over SE coast of New England
The GOES SRSO imagery from 1848-2015 UTC shows the influence of the cool onshore flow with marine stratus holding on the southeast coast of New England from Groton, CT (KGON) to Providence, RI (KPVD) to Marshfield, MA. Just to the north of that region the smooth texture of the marine stratus changes to rolls/streets showing us where it might be possible to convection to develop. MrSnow/inthecards
Rapid City Meso Discussion Charley
Moving to a high CAPE and DCAPE environment. SPC Meso analysis has 5000/1700 for each. Near cast model shows the region is fairly unstable. Area under clear skies now. 12Z sounding had 12 kft freezing level as well as 8500 wbz. PW of 0.67 is dry. Have some cu over western Pennington that is blowing up now. Seems region is unstable. CI had a high value just before that cell went up.
The yellow area above did not blow up, but the next image below did go quickly…see following image as well.
CI Increasing – Small Area of Showers and Storms Develops
SPS 2 Charley
NUCAPS sounding over MA
We were able to retrieve a NUCAPS sounding in a relatively clear area…at least looked the most free of high clouds in the area. I manipulated the surface conditions to closer match those at the surface and came up with somewhat similar values of CAPE to what we where seeing on the SPC mesoscale analysis…a little higher than what was on the GOES-R LAP Algorithm cape.
NUCAPS Update Charley
Had a NUCAPS sounding in a clear spot over the area. CAPE was higher than LAP data indicated, with a surface adjustment to 77 degrees over 66 dewpoint. Freezing level is fairly low at ~10 kft, so will be watching for hail growth. DCAPEs around 500, similar to SPC mesoanalysis.
In addition, ALB did an 18Z sounding. Shows CAPE not as high as my estimate, and freezing level a little higher as well.


