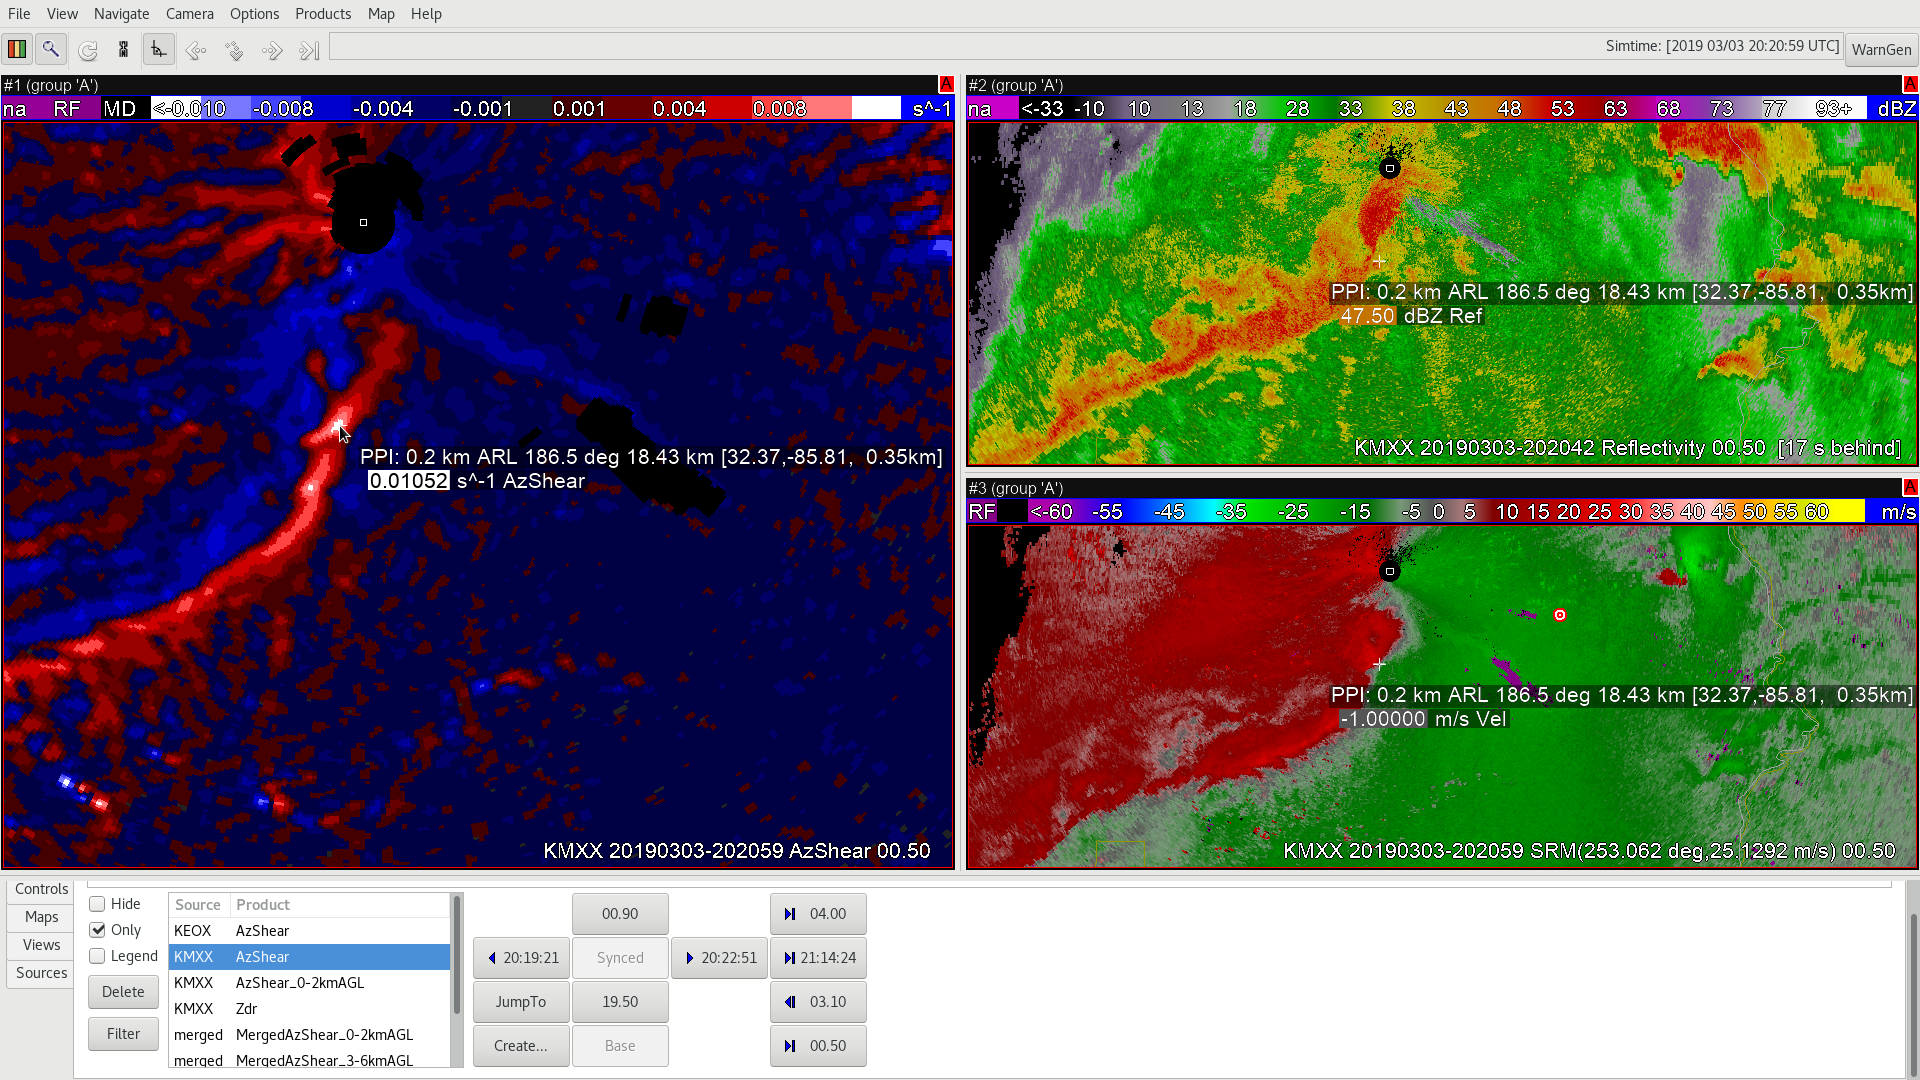
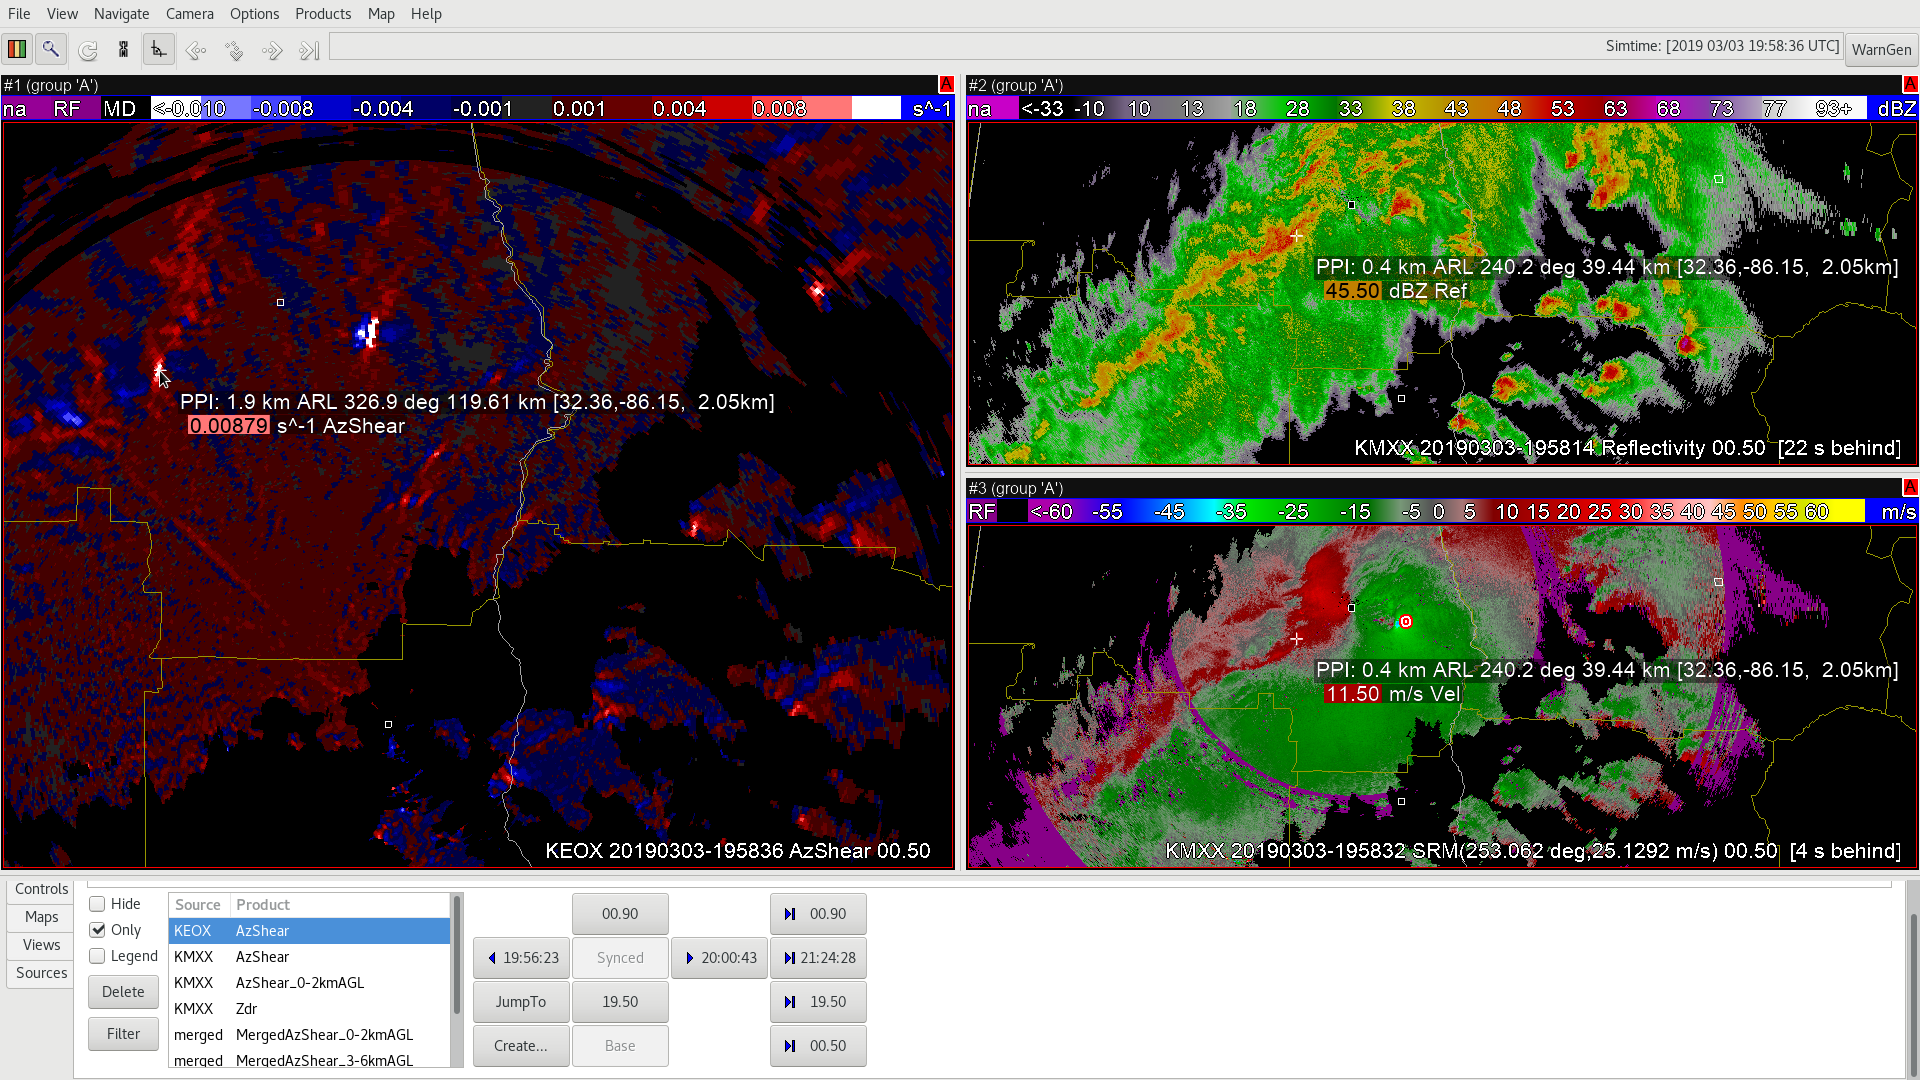
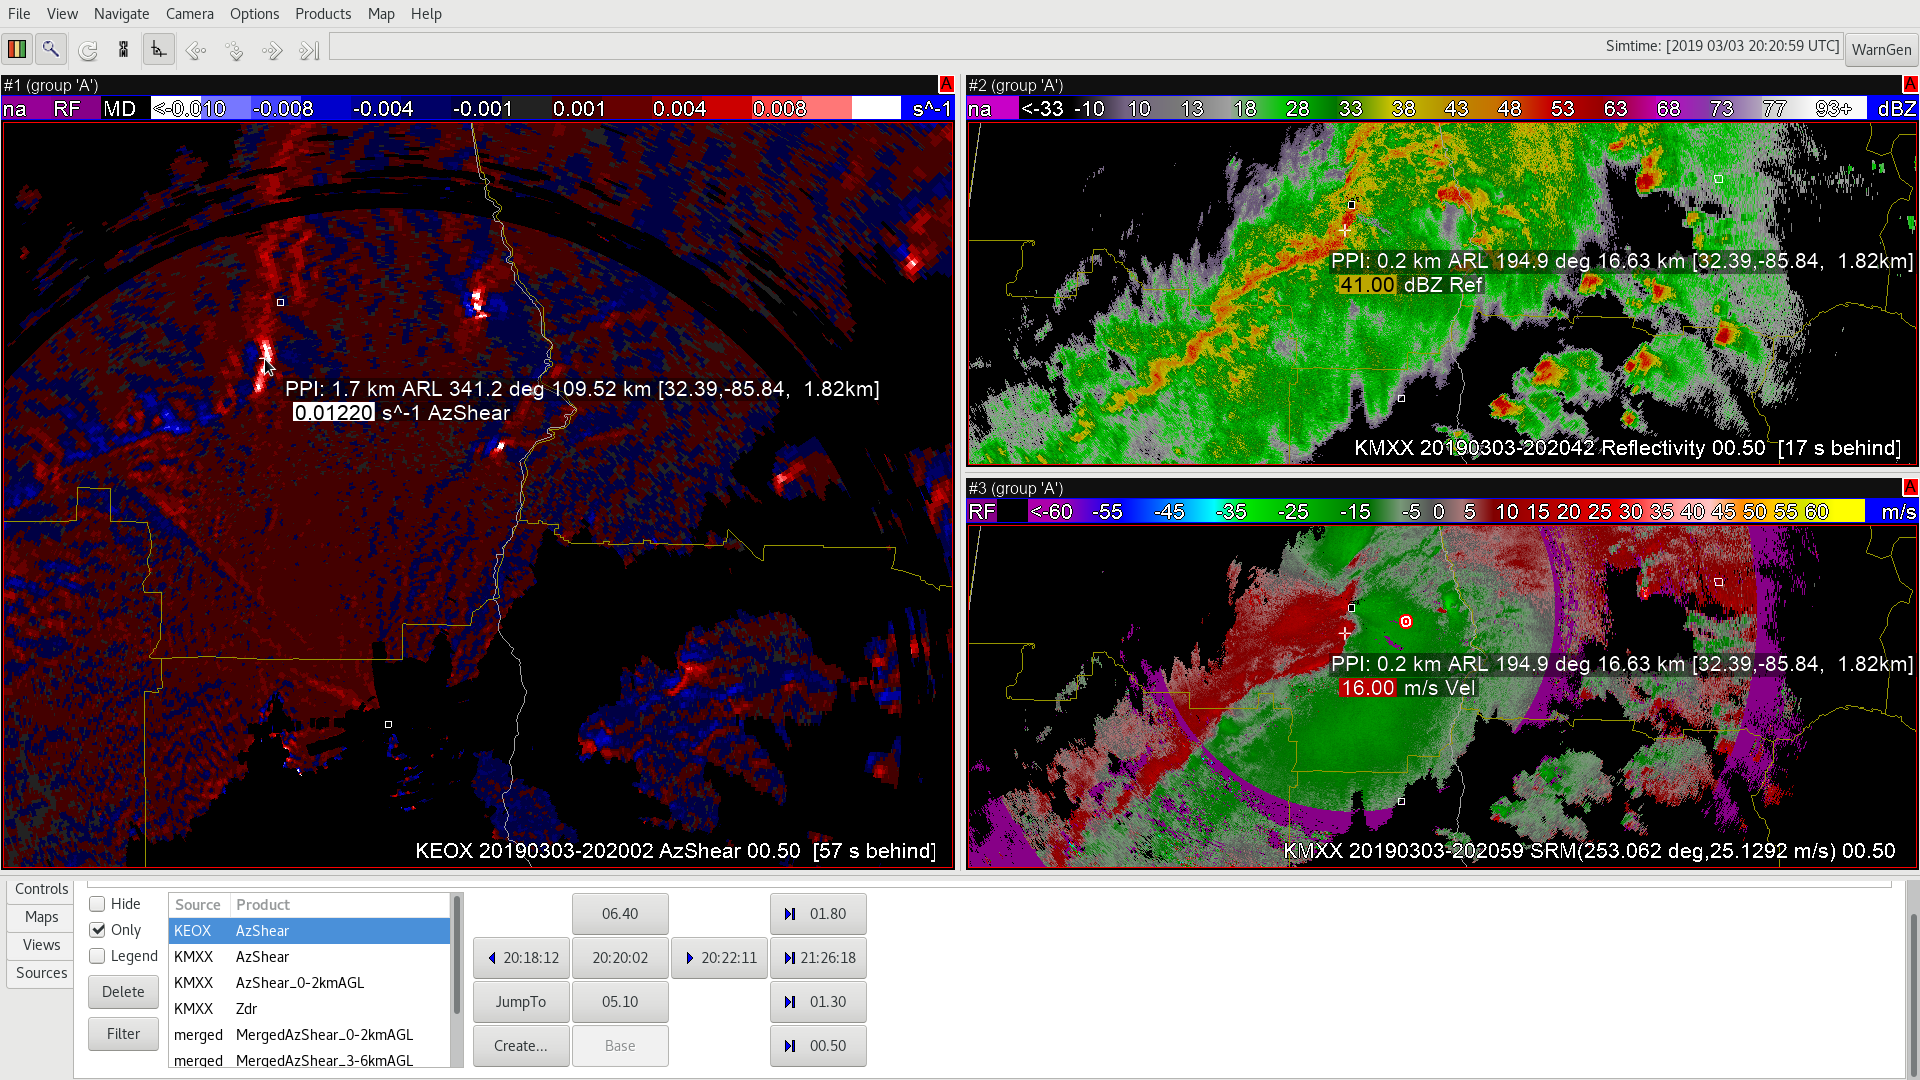
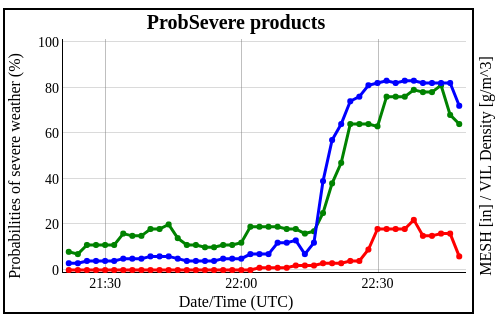
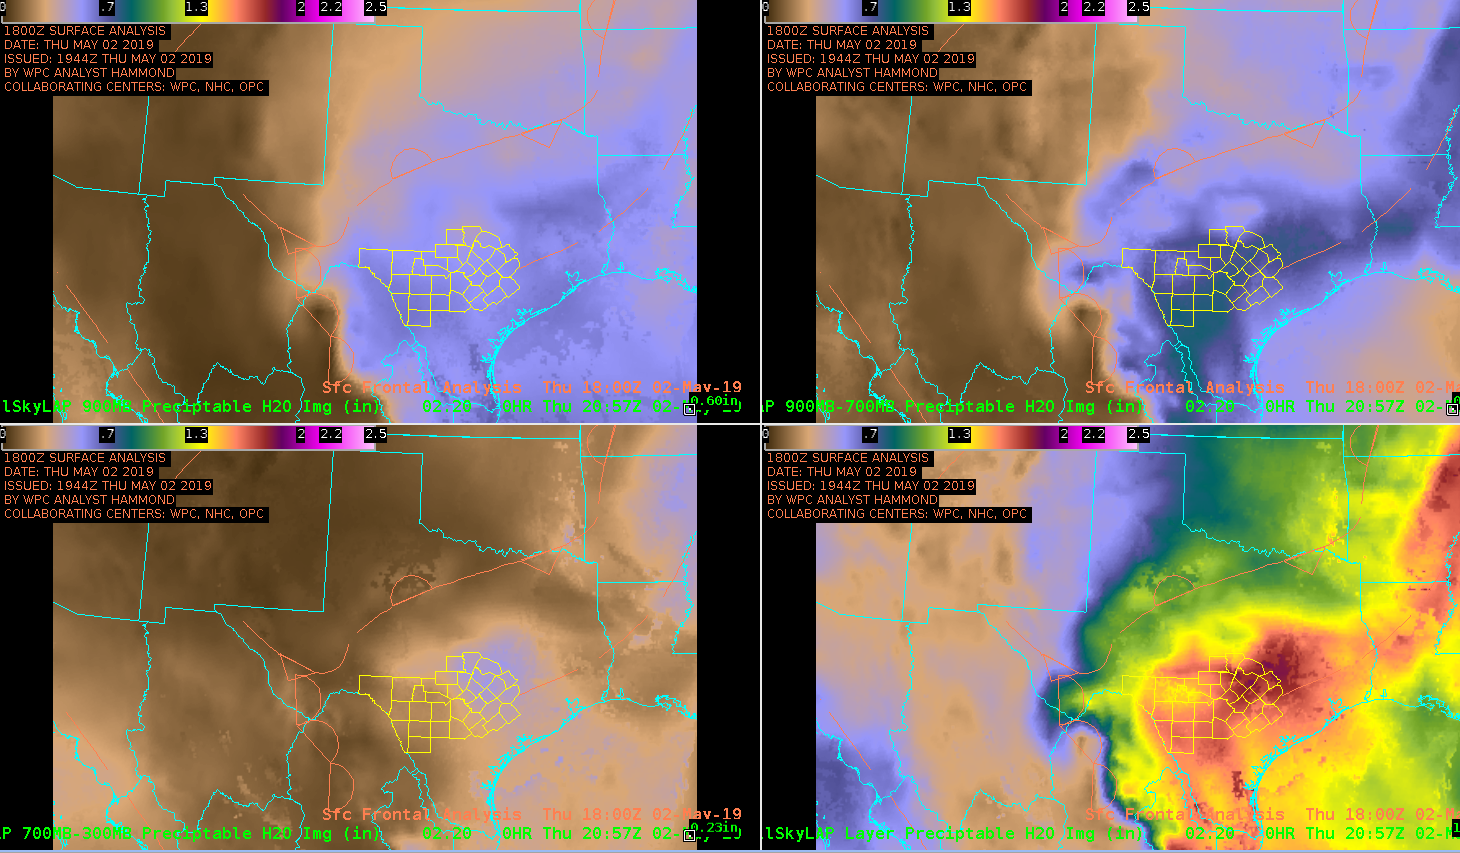
One storm became near severe around 545 pm in EWX CWA. All parameters; lightning, ProbSevere and Dual-pol radar agreed on the evolution of the storm and expected impacts. Radar data suggested there to be equal wind and hail threat based on high ZDR and KDP within the core suggesting sub-severe hail. There was some notching in the back side of the storm’s reflectivity as the front end of the storm surged eastward suggesting some wind threat. Lightning over this time had increase from 10 fl/min to 20 fl/min about 15-20 minutes prior to the development of some weak mid level rotation. As the storm cycled and weakened, so did the lightning and ProbSevere values. An uptick in GLM event density was followed by a slight increase in ProbSevere values toward the end of the loop.
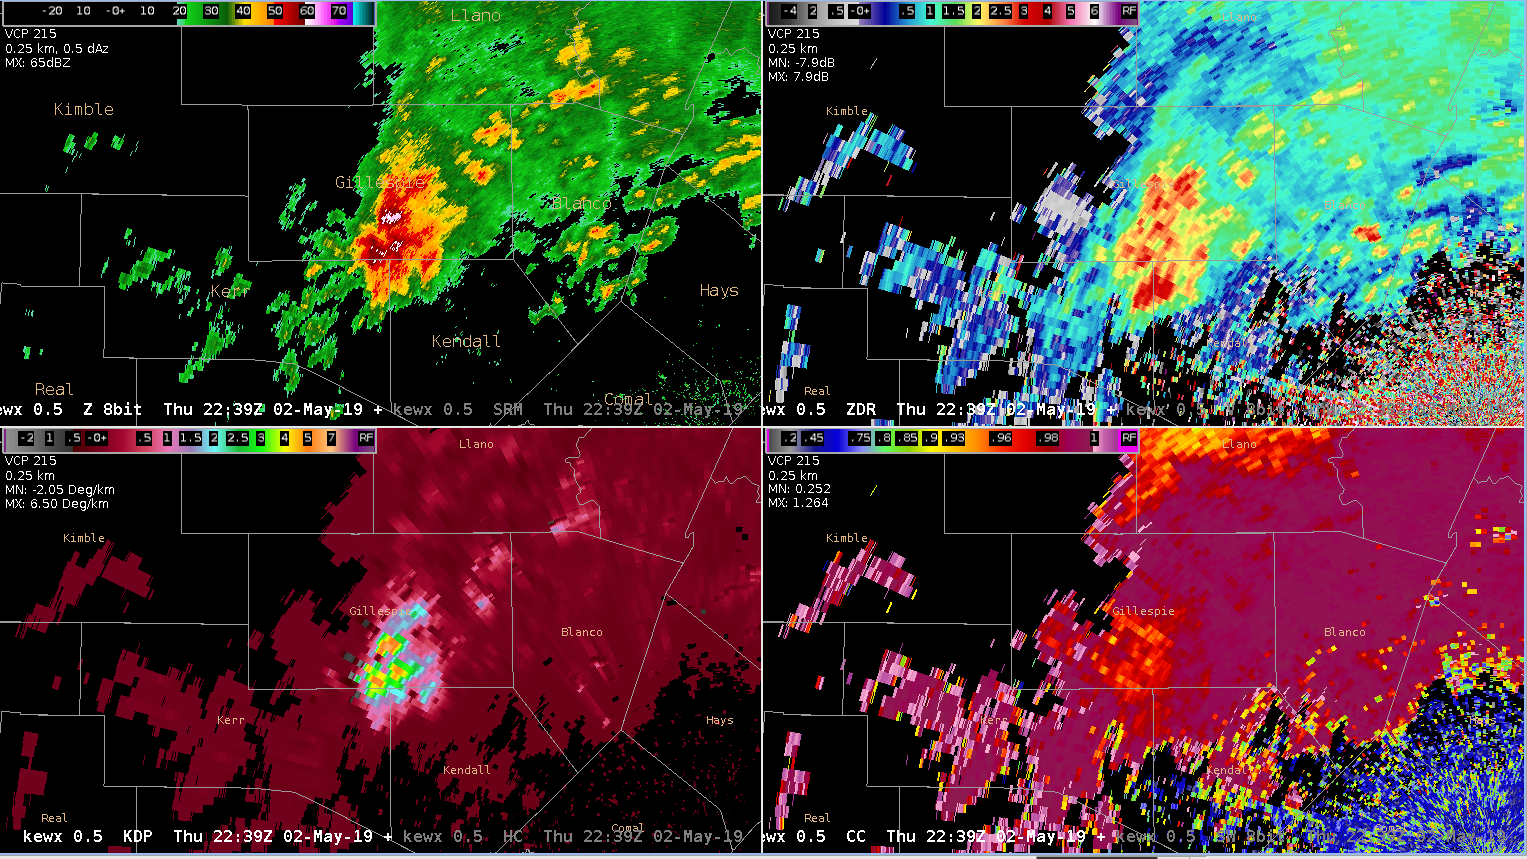
KEWX 4-panel – Refl (UL), ZDR (UR), KDP (LL), CC (LR)
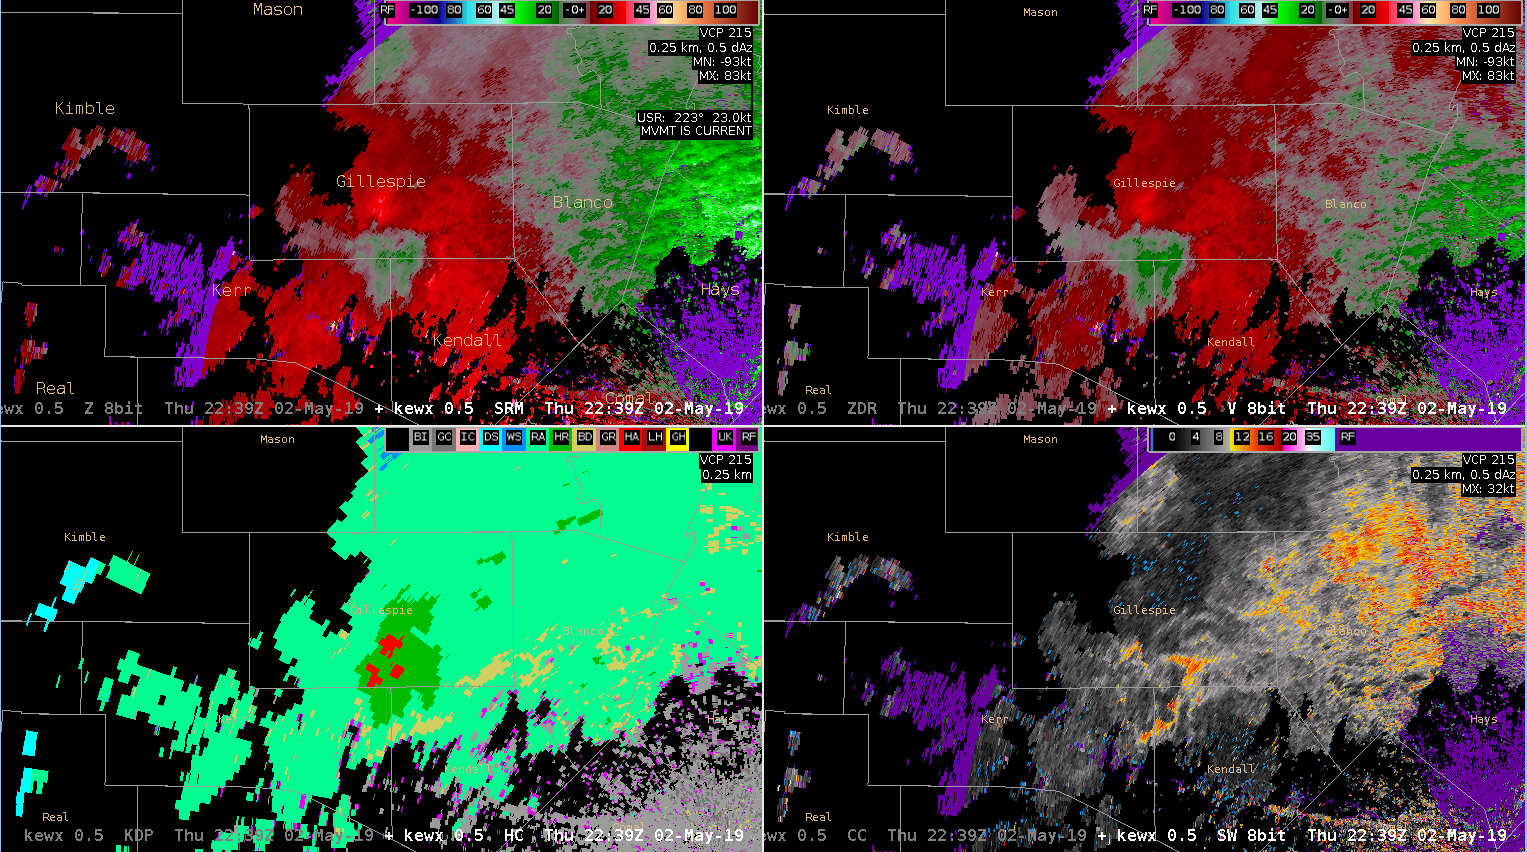
KEWX 4-panel – SRM (UL), V (UR), HC (LL), SW (LR)
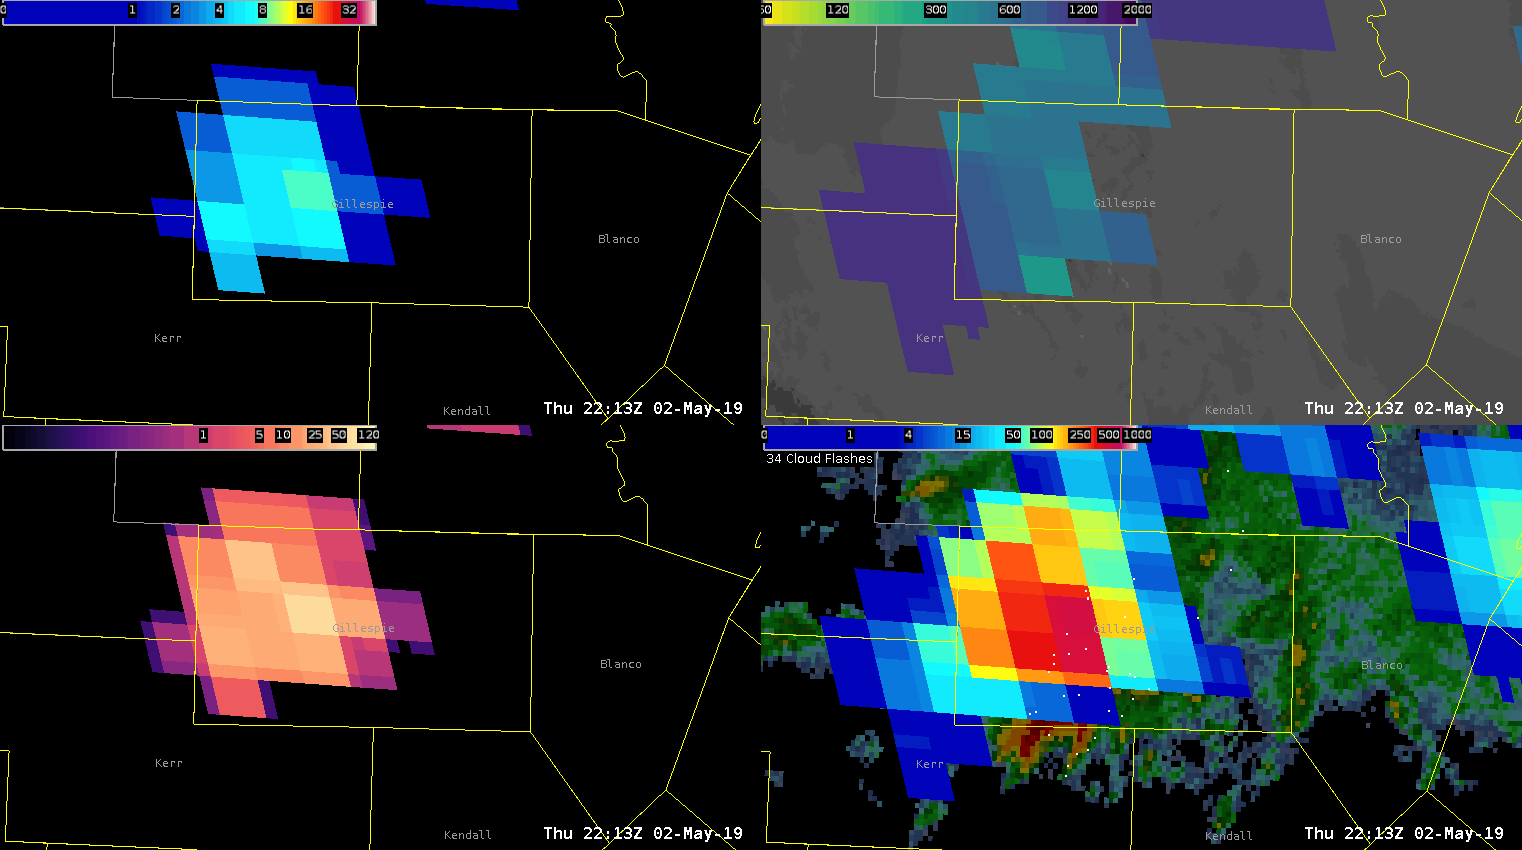
GLM sequence of Gillespie County storm – 1-min(FED)(UL),AFA(UR),TOE(LL),EventDensity(LR)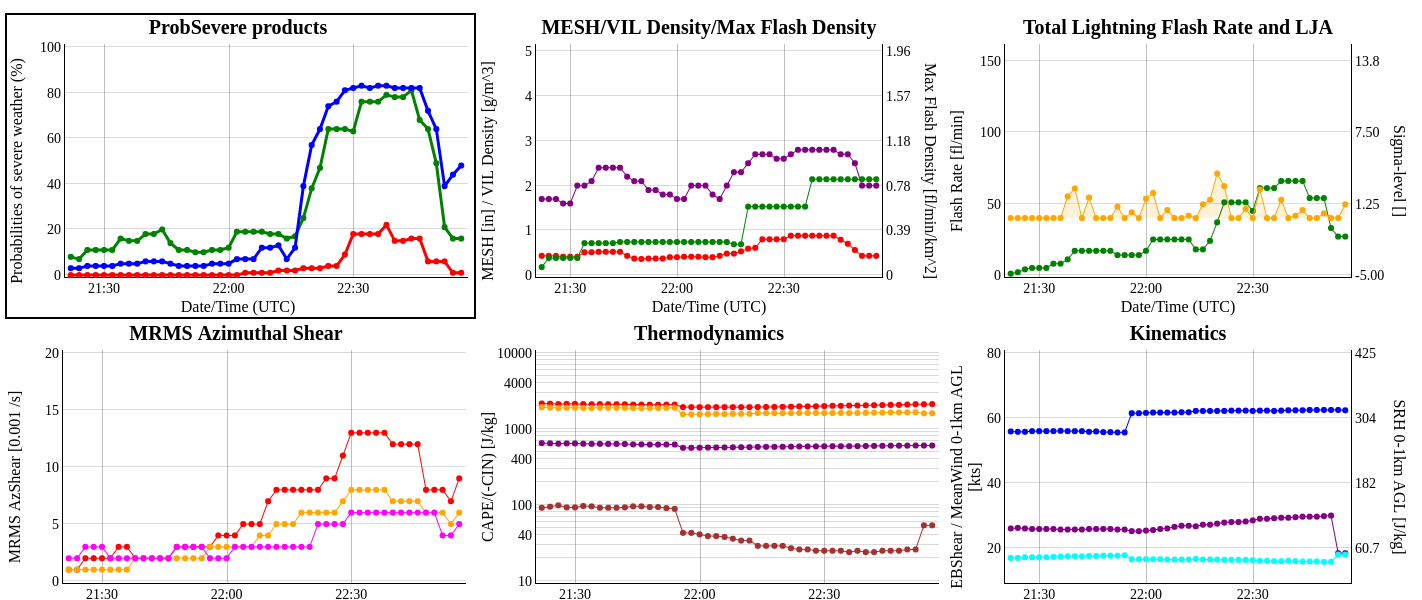
ProbSevere time trends from http://cimss.ssec.wisc.edu/severe_conv/plots/PSplots.php?ID=176047
— SCoulomb
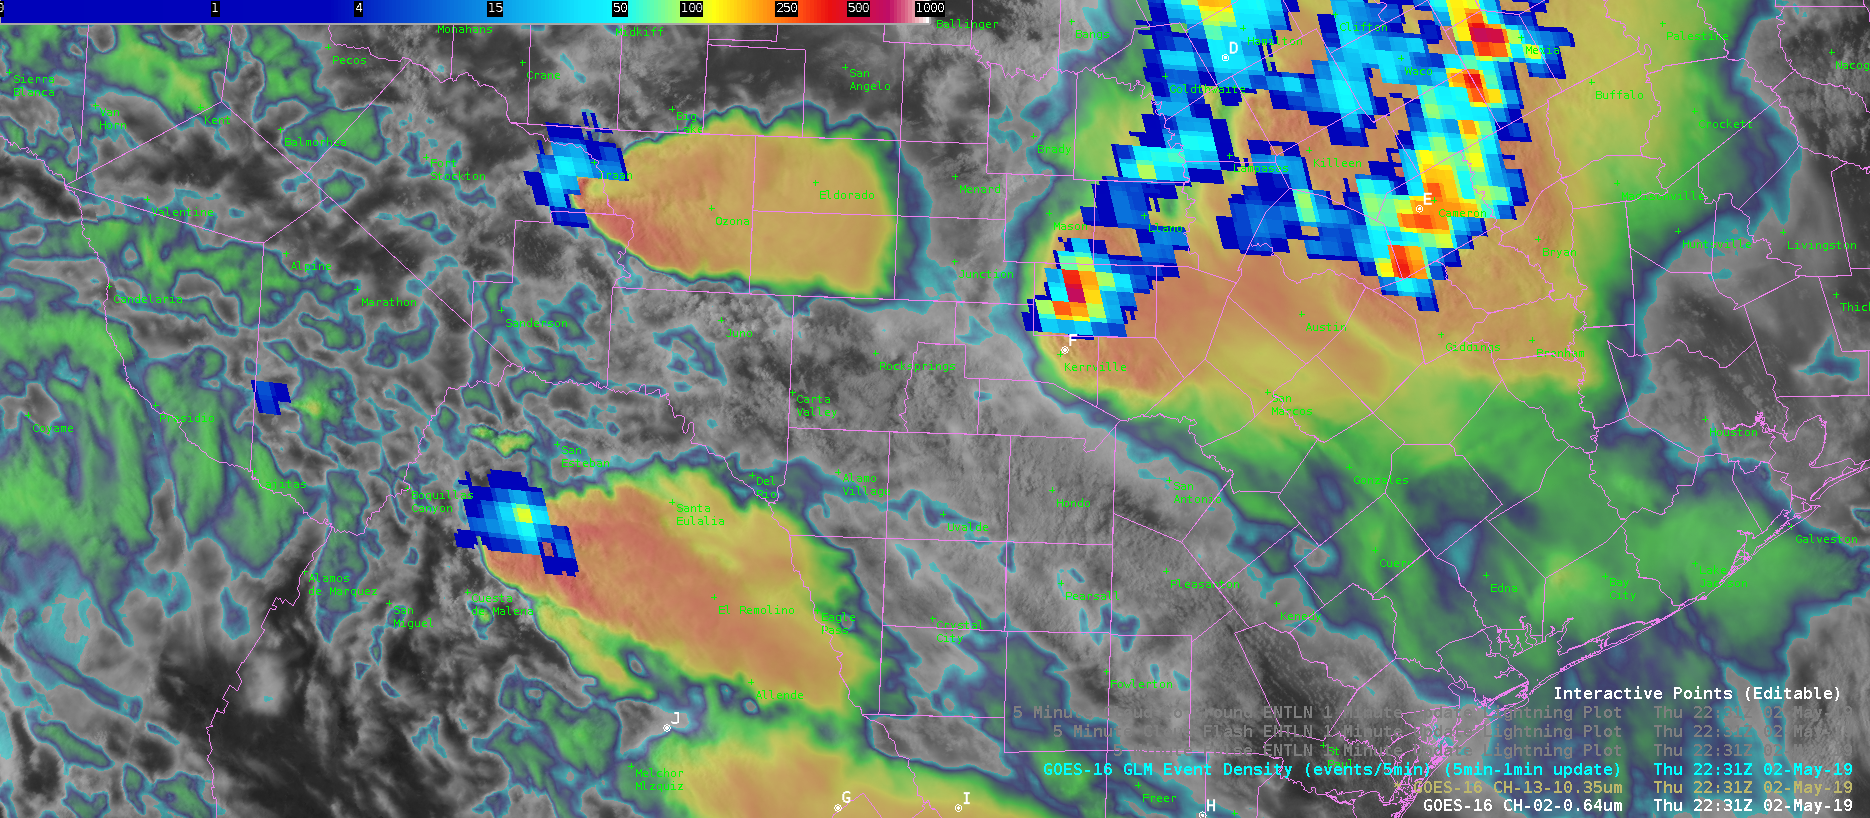
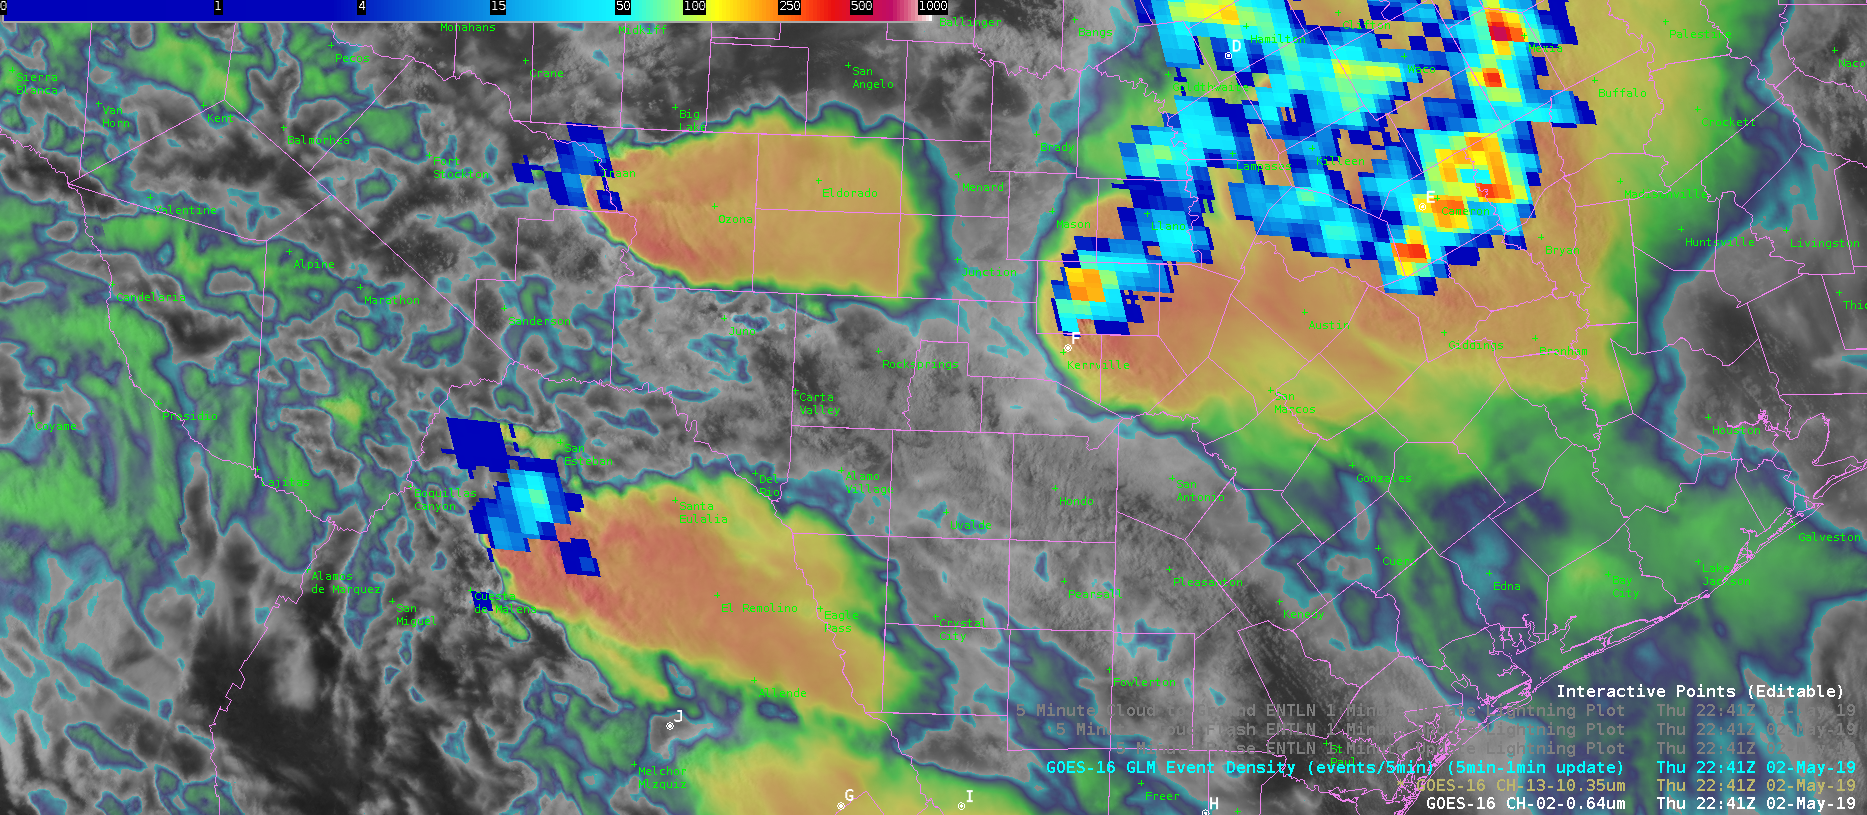
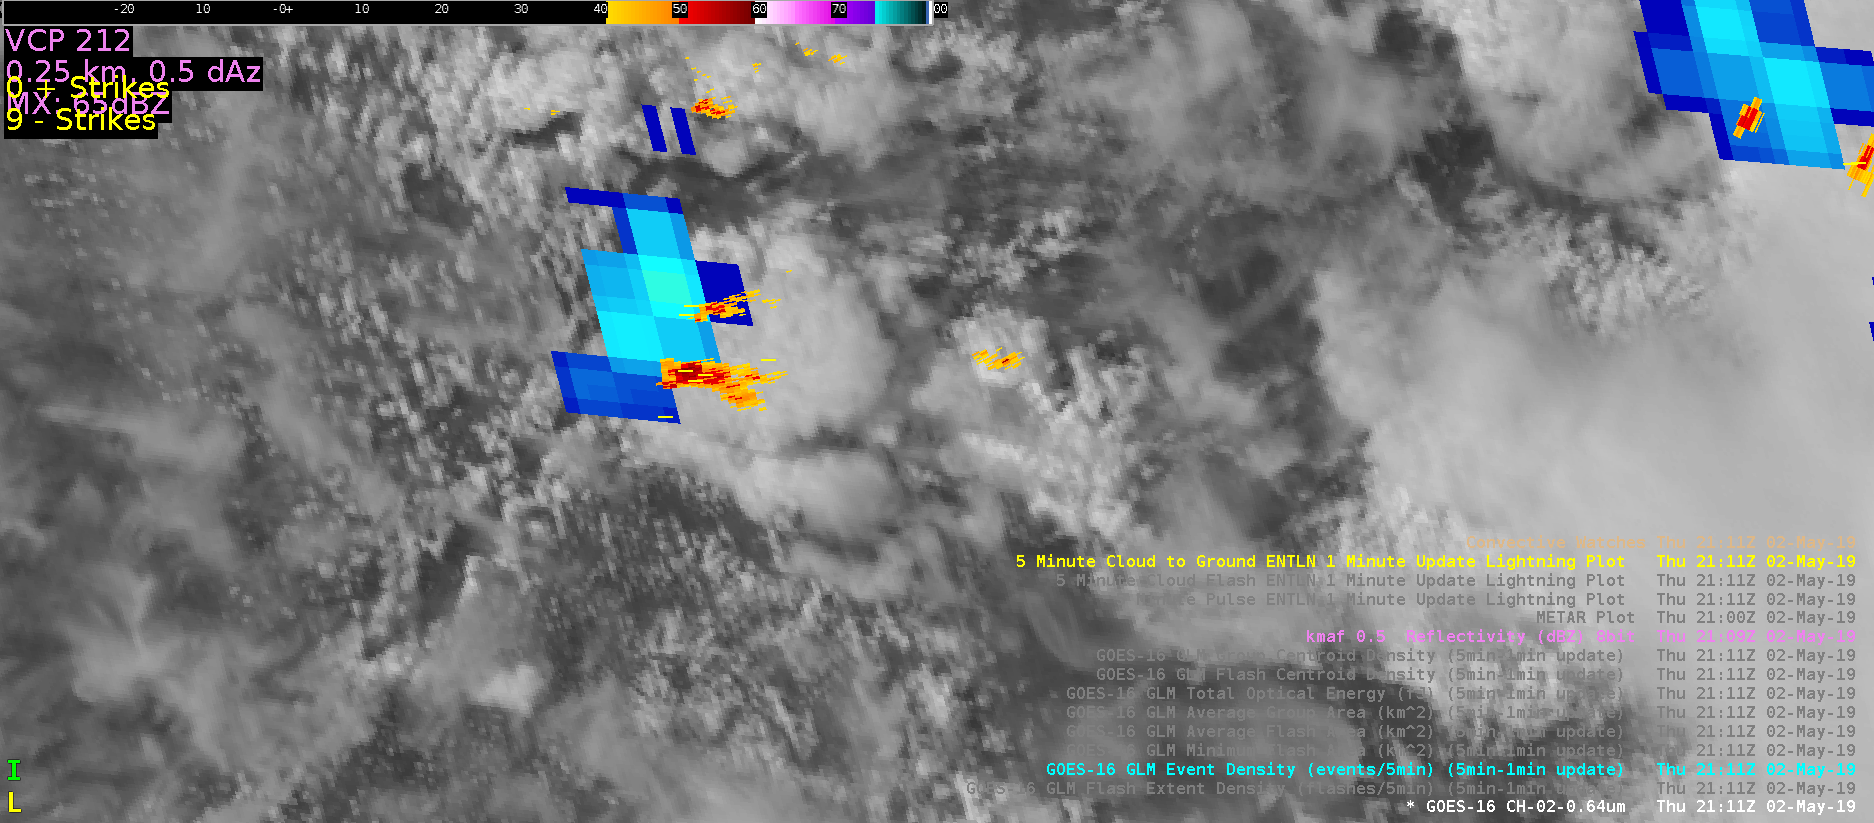 This loop shows how event density evolved as a supercell rightmoved in west Texas. Another good example of GLM data showing a minimum during the most intense phase of convection. GLM data counts recovered somewhat toward the end of the loop.


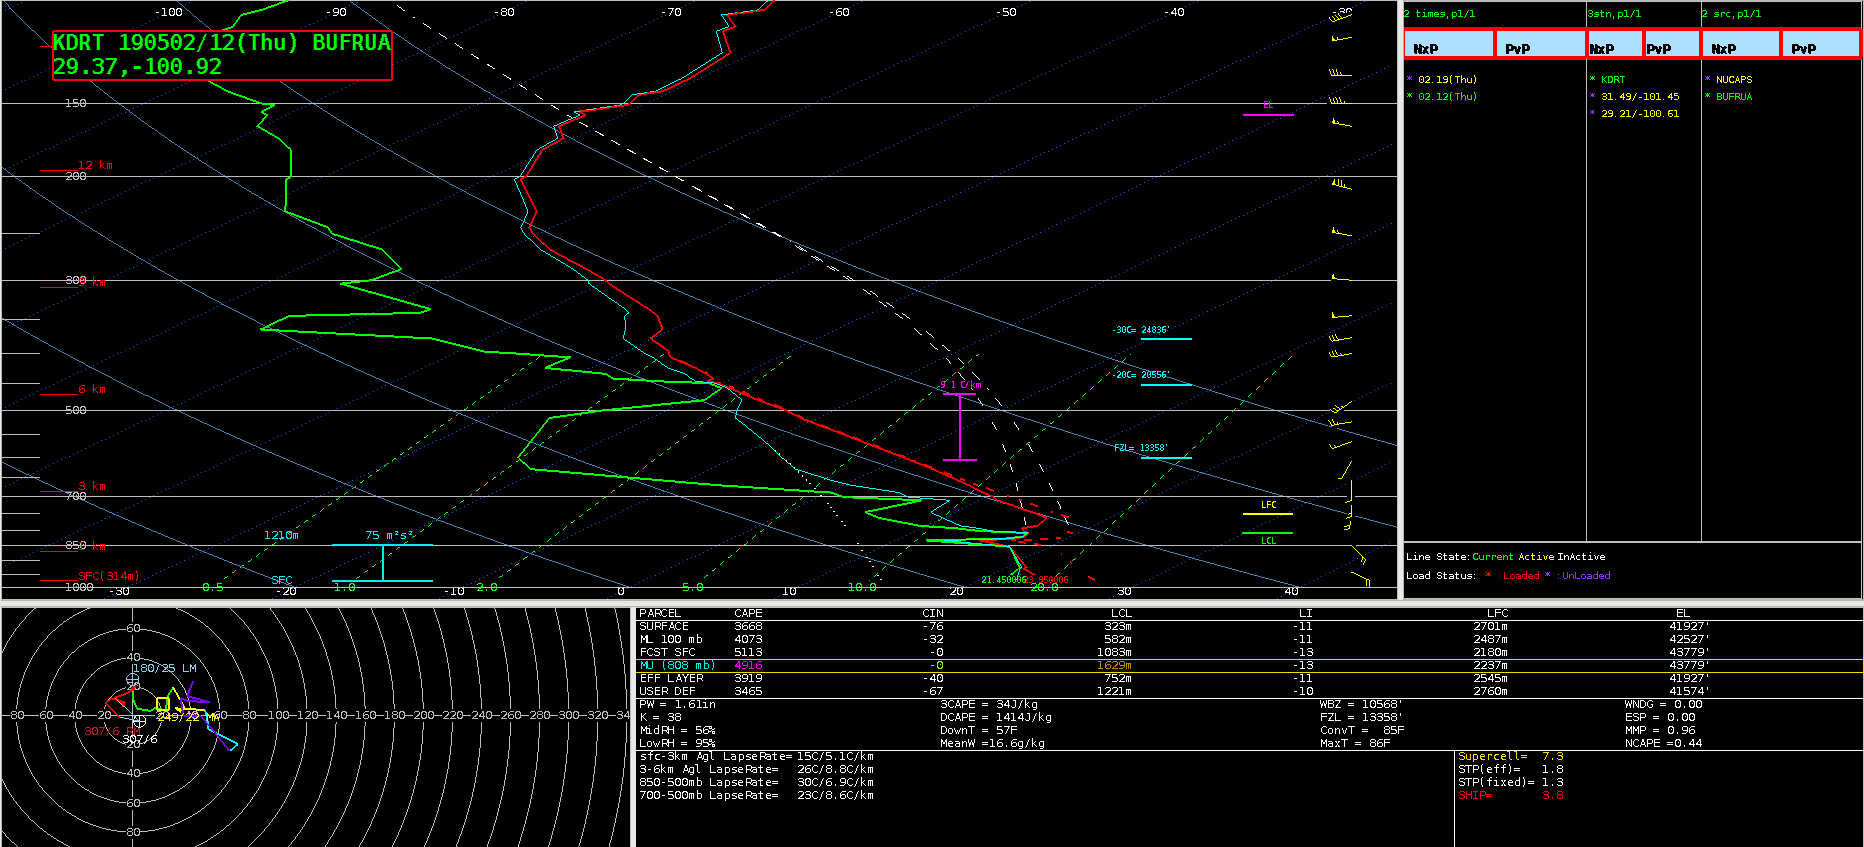
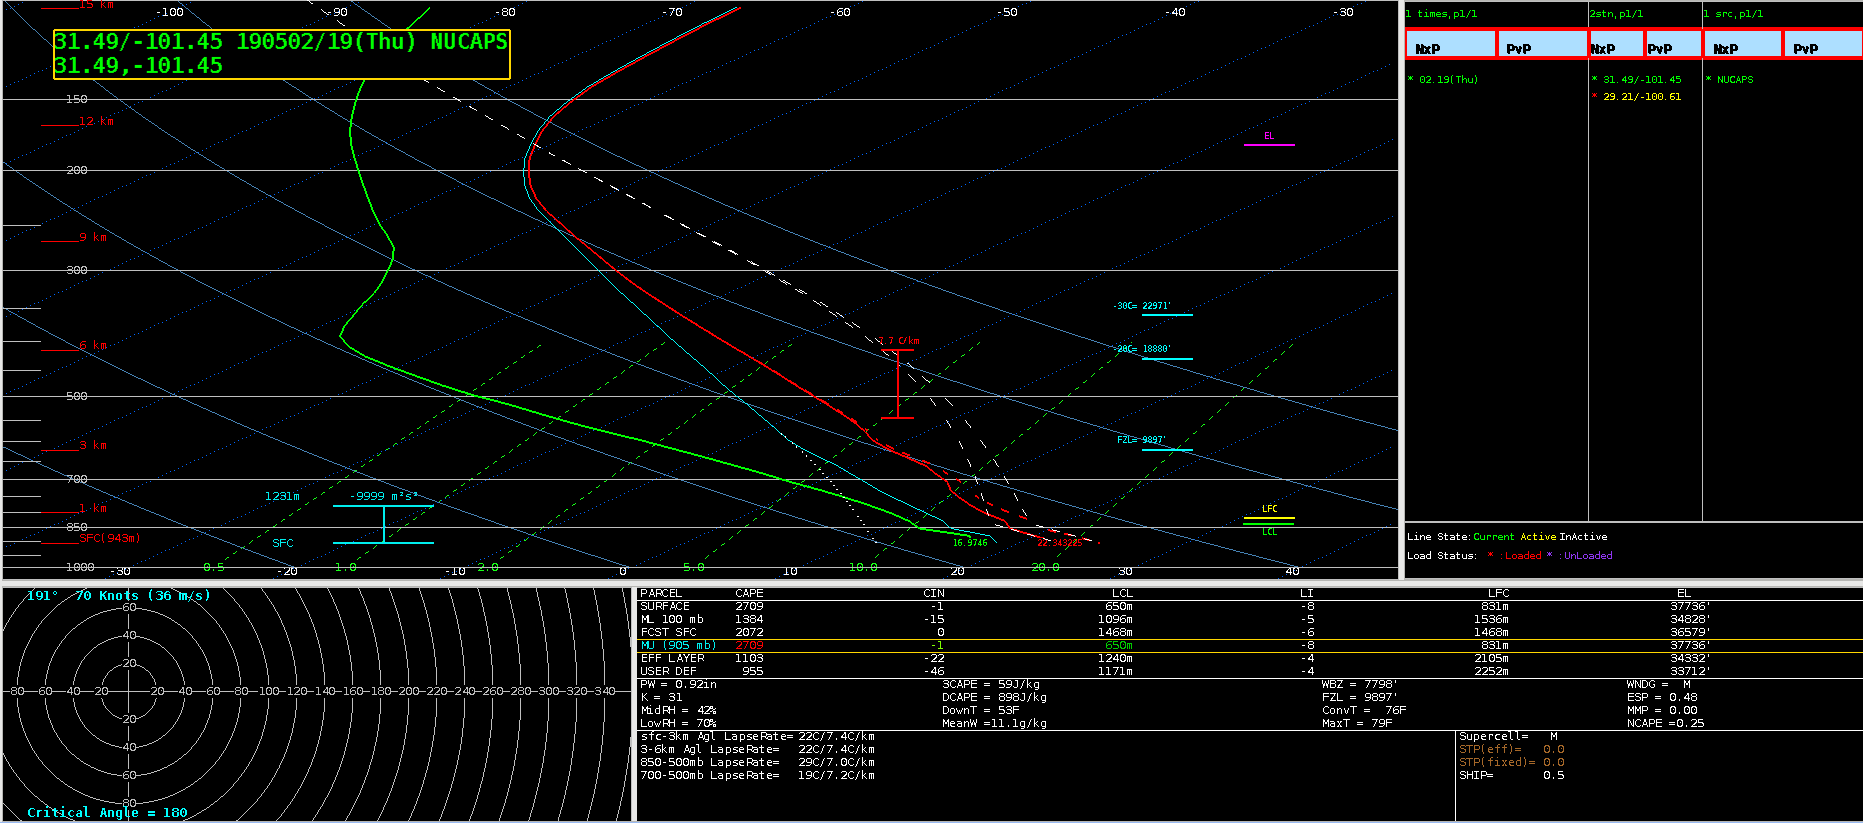
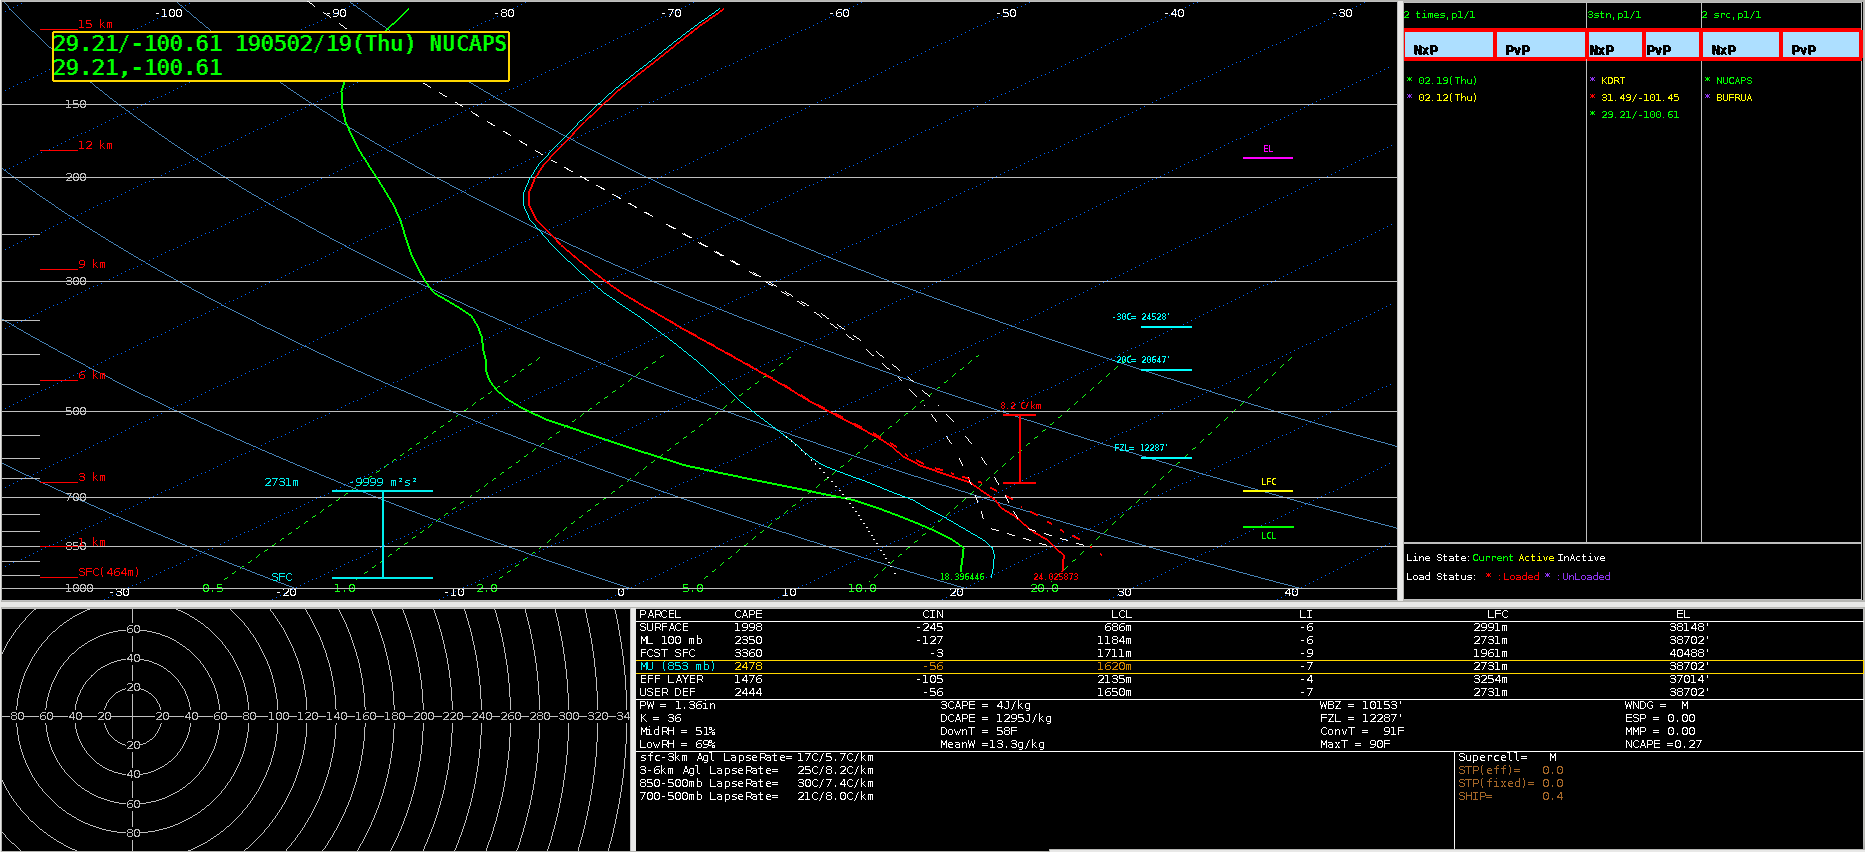 This was an unmodified NUCAPS sounding from the same region. Boundary layer moisture is not captured nearly as realistically as the prior modified example. Overall, trust in the modified NUCAPS sounding data has increased dramatically after some exposure to it. I would say many forecasters need more experience learning about the soundings through simulations to trust the data more.