High Confidence in Lightning activity:

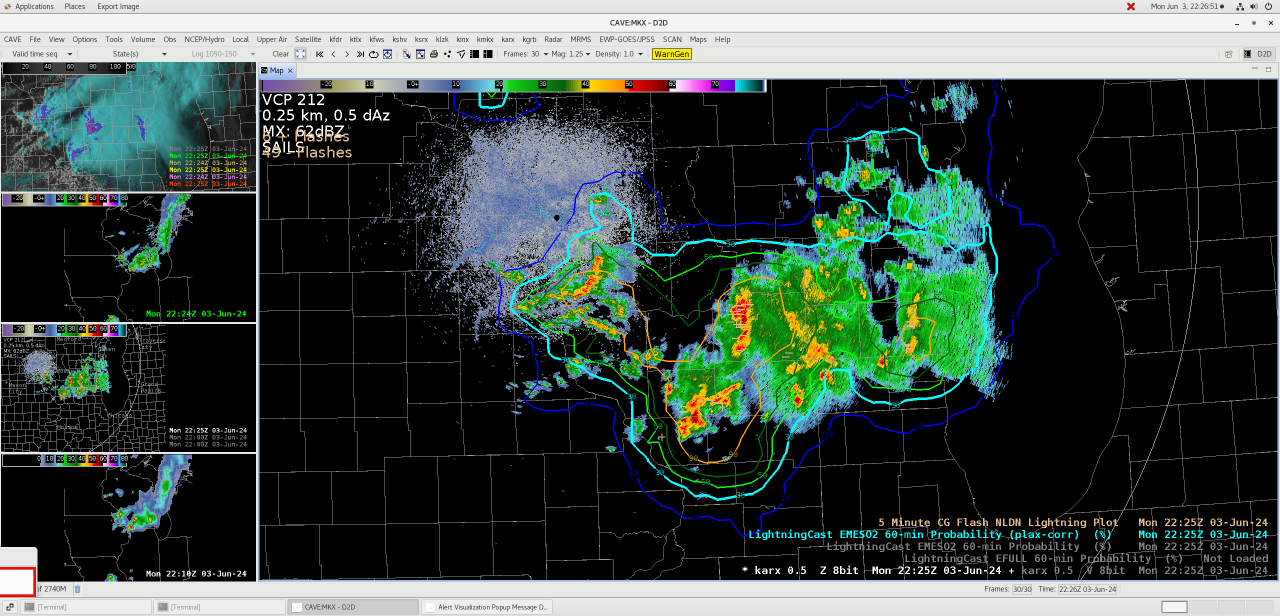
There is high confidence in lightning activity with the storms moving across southern Wisconsin this afternoon into this evening.  Based on the lightningcast product shown below, there is a greater than 90% chance of lightning within the orange outlines over the next hour.

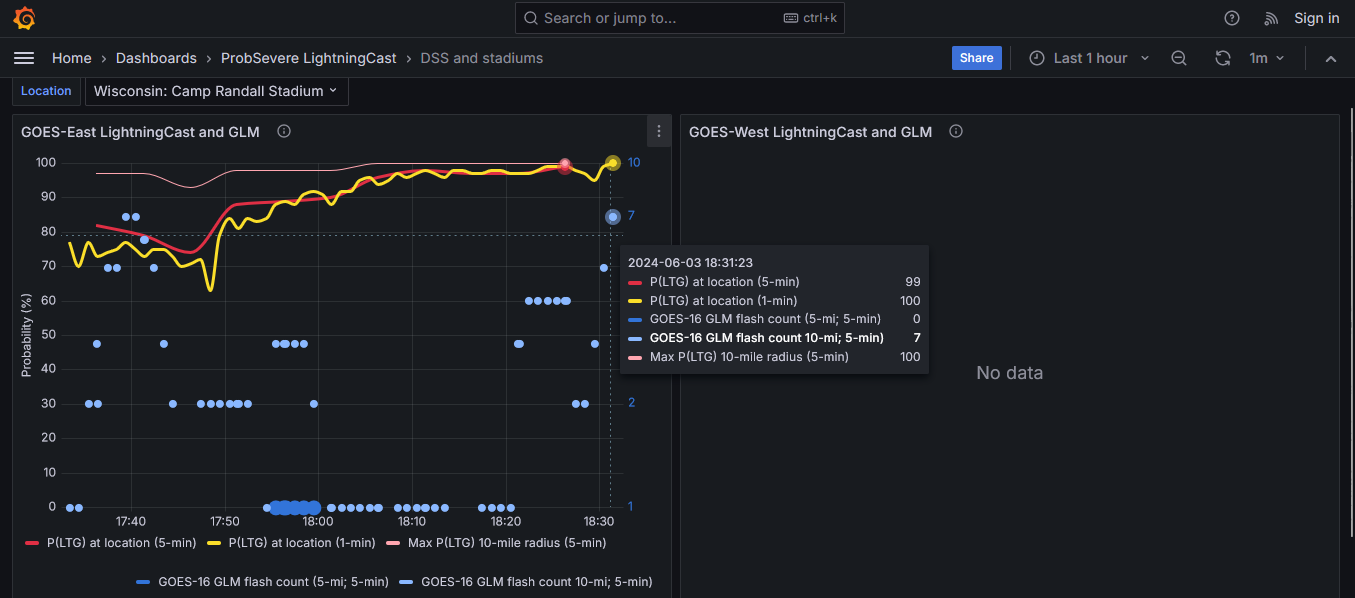
As you can see on the image below, this is a point forecast for Camp Randall Stadium, showing the same results.

-ULMCUBMAN

Tags: None

Finding Boundaries in OCTANE Direction and Comparing to Satellite

As a forecaster, I’m most accustomed to pulse severe conditions, and I work in an area where there tends to be abundant cloud cover. So being able to find boundaries is really helpful. So I decided to review some of the low-level cumulus fields in OCTANE and looking how accurate they are compared to current derived GOES East winds. From what I sampled, they were within 5 degrees of OCTANE.
Now zooming out, we see that there will be an area of confluence in the wind field based on the low-level cu field. Further aloft, you can see some of the diffluence along the warm conveyor belt. Sometimes, wind barbs are really useful tools to assessing an environment, and I think a similar function in OCTANE could be useful for mesoanalysis.


Kadic
Tags: None

A Tale of Two Thunderstorms

Two thunderstorms developed with mixed signals between the variety of tools available. Satellite tools would’ve suggested that the southern storm was the area of interest, but the radar signature was much better for the northern storm. GREMLIN is shown below, with the GOES West on the left and GOES East on the right. LightningCast is contoured, and the probability of 10 flashes mainly favored the northern storm. The appearance on GREMLIN was much stronger for the southern storm.
When looking at the GLM RBG, the more frequent and shorter flashes were associated with the southern storm.

Looking at OCTANE, the southern storm appeared more impressive. Although towards the end, the northern storm began to exhibit stronger upper level divergence.


But again, if one were to look at radar, it would be readily apparent that the northern storm should be ranked as the biggest threat. In a situation involving satellite alone, I might have missed the event that did produce the severe event.

And of course remembering how significant parallax is. From GREMLIN with GOES West, my storms were neatly in their boxes, but from GOES East, it would’ve looked quite strange.


And despite the signal from satellite, the southern storm essentially collapsed in on itself. GREMLIN using GOES West does not seem to catch on to this fact, but GOES East has corrected to a stronger storm up north.


Kadic

Tags: None

Convective Initiation Timing Between the PHS and HRRR

Here we compare convective initation in the PHS model (right) versus the HRRR (left). Both models have relatively similar SBCAPE (around 1000-20000 J/kg) but the HRRR does carry CIN longer through the afternoon. The 16Z (and 17Z, not shown) PHS model produces convection by 21Z to 22Z, while the 17Z HRRR waits until 23Z.

Below is the 1854Z GOES-East day cloud phase RGB which shows some shallow cumulus growth in western to north central areas of the CWA. This may lead to more confidence in the earlier convective development from the PHS model.

-Joaq

Tags: None

Examining LightningCast Values Near Pierre SD

We have a Fishing Derby ongoing near Pierre, South Dakota. We observed some differences in the LightningCast probabilities within a 10 mile radius between the AWIPS contour plot and the dashboard.

Here’s an image from AWIPS at 2004Z (1504 local time), with the DSS point marked by a 10-mile radius near Pierre SD (white circle), and the LightningCast probabilities (60-min for 1 flash) contoured in blue and green.


Next, here is a look at the dashboard for the same DSS event. Of interest is the pink line, which shows the maximum probability for a flash within 10 miles of the DSS point within the last 5 minutes.

At the 1506 (local time) time slot on the dashboard, it shows the maximum probability of 47 percent. However, the AWIPS image above shows the greatest contour values within the DSS point radius for that same time minute span (at 1504 local time) and the value only barely exceeds 30 percent. It appears that the value on the dashboard is reading about 15% higher than the value that would be implied by the contour display in AWIPS.

Functionally, as long as the trends are consistent, this may not make much of an impact on messaging or forecasting for this DSS point. However, having the values more closely matching between the two sources is something that would likely increase forecaster confidence.

–Insolation

Tags: None

A Tale of Two Storms From OCTANE, LightningCast, and GREMLIN


This is an interesting comparison of two storms that show two initially different satellite and LightningCast signals that produce very different results on radar. The southern cell shows an initially much more consistent cloud top divergence signal from OCTANE with a more robust looking anvil shield and an above anvil cirrus plume. That aside, the northern storm consistently had a higher probability of >10 GLM flashes from LightningCast and eventually developed a far stronger radar signature and eventual severe thunderstorm. The southern storm struggled to even develop a 40 dBZ core. The animation below shows the same progression but with the OCTANE speed and direction RGBs. In this case if a severe decision was to be made with just the satellite presentation, the wrong decision may have been made (at least initially).

-Joaq


Finally, here is how GREMLIN handled the southern storm, which it understandably initially intruduced high reflectivity to the southern storm.

-Joaq

Tags: None

GLM Data Quality Under the Shadow of the Anvil

As we are watching a cluster of thunderstorms develop across Nebraska, we’re in a region where GLM may not be able to most efficiently detect flashes in the region. However, underneath the shadow of the cirrus blow off, the flash detection efficiency increases, and the stoplight colormap begins to suggest that the data quality is better. Perhaps this offers a bit of hope when forecasting charge moving along with the anvil.

Kadic
Tags: None

OCTANE Trends for Ongoing Convection in ABR CWA

Taking a look at OCTANE – it seems like the IR/Nighttime data shows especially the directional details a bit more than the Visible/Daytime products. This has been a continuing trend this week. The CTD and CTC products have been useful with monitoring the strength of the storms (especially which may become severe) as well as with the newer convection/updrafts.

OCTANE – Visible (Daytime) vs IR (Nighttime)


OCTANE – Cloud Top Cooling and Cloud Top Divergence

Forecaster Cumulus

Tags: None

Update to PHS versus HRRR Convective Initiation

Looking at an update of the 19Z HRRR run and the 17Z PHS run, the more recent HRRR run is catching up to a sooner initiation solution. The 19Z HRRR is initiating cells as early as 21Z with a series of cells displayed above by 22Z, similar to the 17Z PHS. Another note is that the newer HRRR run has a higher SBCAPE value than the PHS at 1700-2700 J/kg compared to 1000-2000 J/kg from the PHS. Recent visible satellite trends look to favor an earlier initiation as well.


-Joaq

Tags: None

OCTANE Cloud Top Divergence and Cooling view of an Orphan Anvil


Here is a good example of the OCTANE product showing the transition from an updraft to a divergent anvil cloud, which then cuts off from the parent updraft. This “orphan” anvil is an indication of a convective initiation attempt, which can be a signal for upcoming successful initiation in the near future. The OCTANE product does well to highlight both the updraft and then the anvil in different color shades through the entire orphan anviling process.

Below is an additional animation of deepening cumulus development with the OCTANE cloud top cooling product highlighting the taller towers.

-Joaq

Tags: None