

MESH product has had some correlation with wind reports as well as hail reports in determining warning locations in the western portion of the Shreveport CWA.
– McCormick
Official websites use .gov
A
.gov website belongs to an official government
organization in the United States.
Secure .gov websites use HTTPS
A
lock (
) or https:// means you’ve safely connected to
the .gov website. Share sensitive information only on official,
secure websites.

MESH product has had some correlation with wind reports as well as hail reports in determining warning locations in the western portion of the Shreveport CWA.
– McCormick
This afternoon, my colleague and I on the “warning desk” for the FWD CWA got to use some of the MRMS data to diagnose the potential for severe hail. To start, I will say that the products helped with situational awareness, and for efficient determination of what cells needed the most focus, when a long line of cells extended SW to NE across the CWA. Quickly, our attention became focused on a cell that was about to push into southern portions of the CWA in the Salado-Killeen-Ft Hood area. In this first image valid at 2030 UTC notice the cell was producing >1.0 inch hail per the MRMS MESH product (lower right). MRMS Reflectivity at -20C was ~55dBZ, also lending support for the presence of severe hail.

This storm was considered to be too far outside the CWA boundary at this point and was moving slowly enough, that a warning was not issued at this time. However, it caught our attention as the process was made more efficient by the MRMS suite of products. The next image valid at 2042 UTC indicated that the storm had undergone some temporary weakening, as MESH values fell below one inch (lower right). Nevertheless, reflectivity values at -20C remained >50 dBZ.

Next, at 2050 UTC, MRMS products indicated that the storm was undergoing some temporary strengthening once again. Given the cyclic nature of this storm and the reflectivity signature noted in the reflectivity composite, the first warning for the FDW CWA was issued at 2053 UTC. In this warning, we included the potential for quarter size hail, which was near the highest suggested by the MESH data and other techniques such as Donovan-Jungbluth.

We got our first report of severe (quarter size) hail at approx. 2120 UTC. The next image is the MRMS products valid at 2118 UTC. Notice at this time that the storm had strengthened and MESH values (lower right) were near 1.5 inches.

A little later, the warning forecaster had to make a decision about warning continuation. The MESH showed that the secondary storm that had developed on the western flank of the initial storm had larger hail sizes. Given other factors, when looking at all-tilts and taking into account the Donovan-Jungbluth technique and corroborating reports, another warning was issued. This one however included the quickly-developing storm to the west (warning not shown).

So, why is this imagery potentially useful? Well, the 2-minute temporal resolution is advantageous, potentially buying lead time. Also, it helps with the overall SA and the efficiency of the warning process. See the image below to see the extent of the convection ongoing at the time.

With multiple deep cells in the area, products like the MESH, and -20 C Reflectivity can be very helpful for determining the cells on which to focus. This has the potential of making the warning process more efficient.
Another thing I would like to point out is the potential for radar failure. I worked the April 27th severe weather event in northern Alabama, where we lost our primary radar and a secondary radar. I was using neighboring radars which were equi-distant to the remaining convection late on that day. A MRMS suite of products would have been very beneficial to the alternative of having to look at data from three other radars. That’s one more thing I’d like to point out about these products.
Kris and Ashlie


 I like the 15 min forecast time steps of the LAPS_OUN_1km data. The most noticeable feature is a secondary sfc CAPE maximum about 2 counties out ahead of the current line of convection. The LAPS fcst maximum base reflectivity continues to try and develop a secondary line of potentially severe convection 50 to 60 miles out ahead of the current line of convection over east TX. May want to watch satellite for cloud cooling trends and possible initiation of new severe convection out ahead of the current line of storms over east TX. These new cells would be forming in a very volatile environment and thus will quickly become severe assuming they form as LAPS data has been trying to indicate. Thus far this new convection out ahead of the line has not been forming, but should be monitored as the LAPS is persistent in trying to develop this convection.
Wesely
A report of penny size hail was received at 2051 UTC in the NW portion of the SHV area in Red River Co. TX. At this time the HSDA off the SHV radar showed hail within the line with scattered pixels of large hail. MESH showed at max of 0.63in.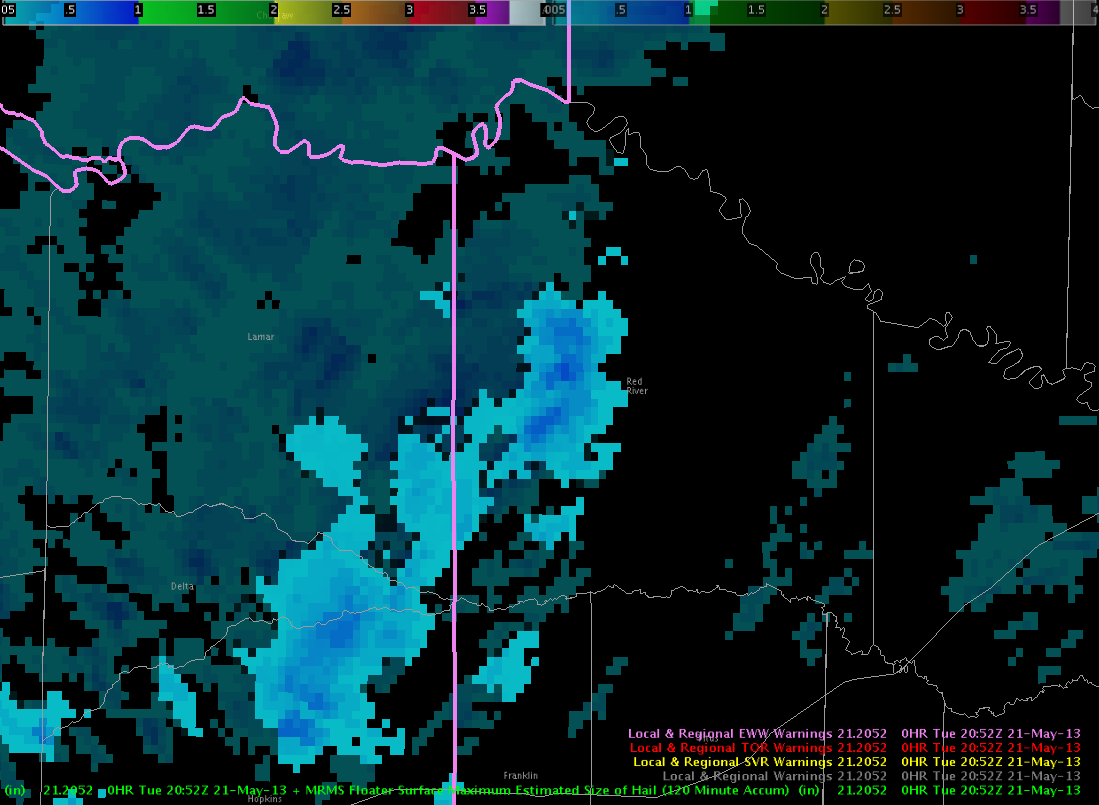
Tried to manually loop a 4 panel image of CI/CTC/Radar/Vis and with a 40 plus frame count it was too slow to be useful. It took over 20 seconds for all parameters to load. However, at a frame count of 12 it was much faster and of more use for following trends.
Wesely
After developing off an old outflow boundary and near the triple point with the dryline, the storm encountered more stable air across northern OKC Metro. Once this happened, the storm rapidly dissipated the storm rapidly per LAPS near time data and Theta-E trends in the near storm environment.
Intense outflow boundary shot into Bryan Co, OK where an 80 mph wind gust went through Kenefic, OK.
Flash Rates have stayed steady or fallen across Johnstone/Coal counties in southern OK, but a have increased rapidly with a new some developing across northern OKC area.
This is likely the arriving of a second, strong shortwave disturbance arriving over the top of the cold front draped across central OK.
Near Henrietta, TX. Take appropriate shelter now if you live across northern Clay Co, TX.