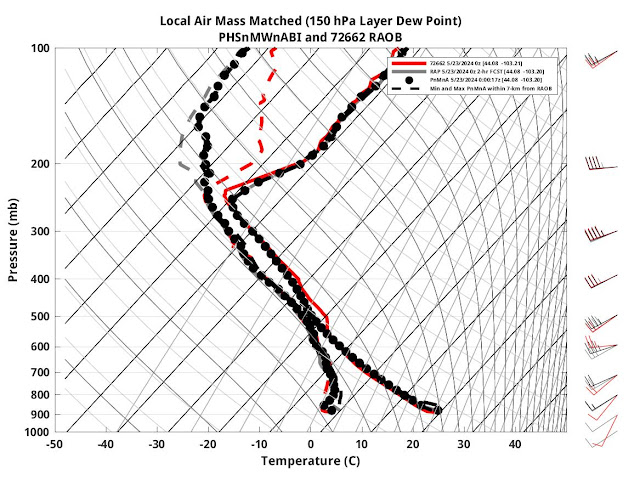
The PHS WRF will offer a unique means to compare RAP analysis and instability parameters. When observing what conditions were like in the PHS, it was noticed that the inclusion of satellite data resulted in drier conditions being observed at the lower levels across western Nebraska.
Satellite viewing of drier weather also corresponded with warmer temperatures across western Nebraska at the surface.
Now how does this look in comparison to various model fields in the RAP. On the bottom left are near surface dewpoints in the PHS, and on the bottom right is the RAP. Carrying forward into the simulation, the values for dewpoint were about 1-2 C below the RAP analyzed forecast. This corresponded better with surface observations within the area. Where the RAP had lower 60s lifting north, these have not been observed near surface stations at the same time. (Note color tables are different. Attempt to get this again was unsuccessful due to CAVE crash)
Here is the same post, but with the CAPE contours now shaded instead with the contours of dewpoint in Kelvin. The lack of a gradient in dewpoint conditions was more representative of the ground truth observed at different ASOS stations.
As far as the temperatures went and how it affected instability, you can also observe the RAP analyzing a cooler pocket, and it likely seems to be the result of the coarse model struggling to capture the terrain across western Nebraska.
What’s interesting is that the instability parameters are not completely different. The reason could perhaps lie in the observed data suggesting a warmer layer aloft. However, the RAP analysis did not differ significantly from the PHS data at 00z.
If you also look, the PHS also has a broader area of instability to the east compared to the RAP. This is where the PHS indicated higher moisture content, and it may be able to destabilize the region more efficiently as a result.
Finally, despite the drier air in comparison to the RAP, it indicated convective initiation about an hour earlier. Using the the forecast helicity and updrafts at 500hPa, one can see that initially pulse convection with minimal rotation should encounter an environment of increasing helicity. We shall see what comes out of this.
For forecast areas that may not have the benefit of features like WoF or other tools to analyze environmental conditions, looking at how differences in the satellite incorporated data and RAP mesoanalysis can help forecasters weigh environmental conditions and what they see from the RAP.
Kadic


