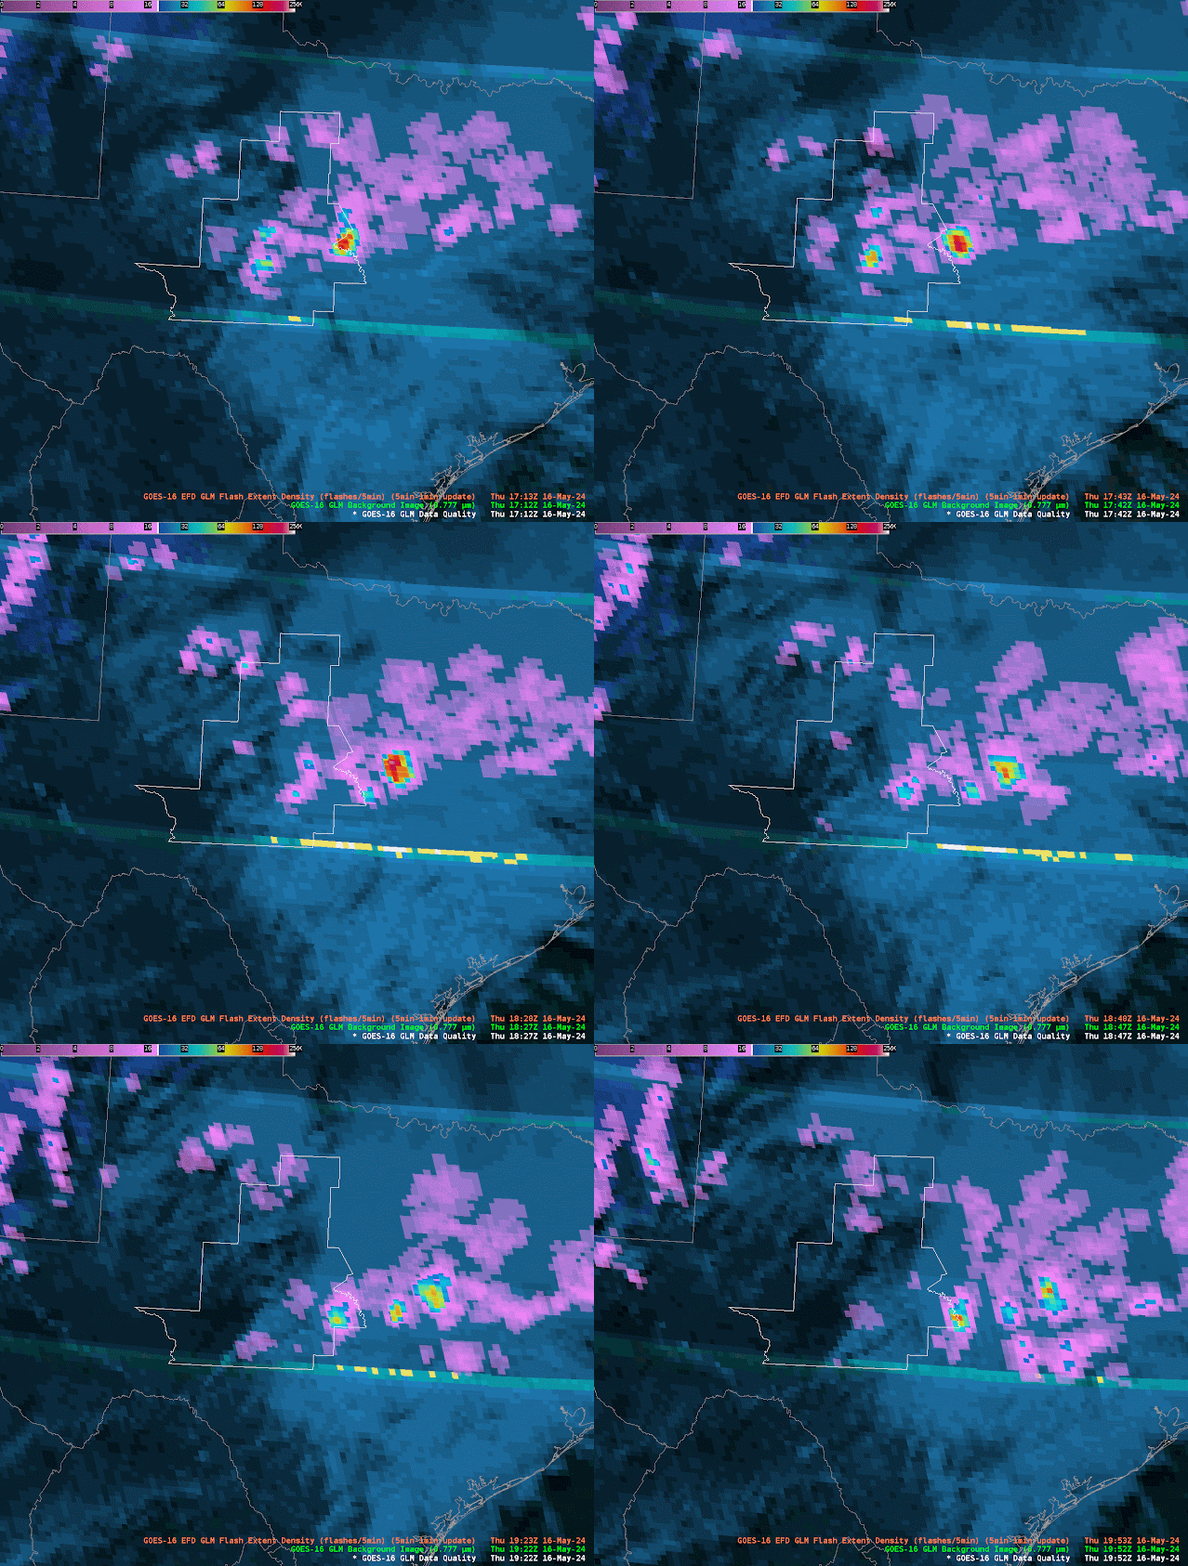
When we started the testbed the GLM products were being displayed on a a four panel display (GIF. 1). This display works fine to find areas of poor data quality, like where the white and yellow pixels pop up in the top left of image 1. However, in it’s four panel setup, I felt that the display took up too much space. As a group, we worked to merge them into a single panel.
Image 1: GLM data quality suite, with Data Quality in the upper left, Background image i nthe upper right, Day cloud phase in the bottom left overlaid with GLM flash density, and the Ch.2 Red visible in the bottom left. Please note that the background image has an erroneous color curve on this display; it is usally closer to the red visible in brightness.
Below are examples of single panel displays created. In general, folks preferred the display in GIF two, but I thought there were ways for ways to merge the two designs. My desire would be to have the GLM background image provide texture to the data quality product like in GIF three, but to have the data quality product maintain the sharp good/bad color curve shown in GIF two. Even more preferred is a color bar like in GIF four, where the “could be poor” but not nearly or fully saturated values are highlighted in another color (red in this example).
GIF 4: The same as Gif 2, except that the poor-ish data quality from 10 to 40 percent is highlighted in red.
What did you think was the best single panel layout?
I also want to share something about the data quality scale (Img. 1). In its current format, the scale is not intuitive. Good data quality ranges from roughly 50% to 90% on this scale (blues and greens). Poor data quality is from 50% to 10. Then, the poorest data quality is white and yellow, and represents nearly and full saturation. I was ready this wrongly, such that 50% to 90% was poor because it was closest to the nearly and fully saturated parts of the scale. Instead, it is reversed. Before this product goes to operations, I would want to see the color bar made more intuitive.
-Kilometers


