Protect the Quartet!
Today we were charged with the noble task of watching over the the Quartet Festival located in Lawrenceburg TN. Gaps in the cloud coverage allowed us to utilize some of the satellite products a little more efficiently today. Our first sign of trouble came as convection began to form out in front of the main line moving WNW out of Alabama. LightningCast 60-min prob gave us our first initial heads up that lightning was possible with storms forming out ahead of the main line. A combination of Octane overlaid with GLM data was the primary source in our decision making to issue a notification to the event organizers. Thanks to our quick decision making, everyone is alive to sing again another day.
We combined lightning cast and ENTLN data with the radar to provide ground truth on when lighting was first scene within the 15 mile range ring which allowed us to issue follow up messages regarding the likelihood of ongoing lightning potential. Requesting a LightningCast point too also gave us confidence in issuing notifications to the event organizers.
Discussing the LightningCast Probability data with Kilometers we were discussing ways to get more information out of it. We settled on loading the LightningCast as an image rather than contours. This combined with the sample tool and overlayed with Total Lightning products was more useful when forecasting for a specific DSS point. We also went ahead and limited the data being showed on the lower end of the GLM Flash Density. We didn’t want to exclude the Flash Density on the lowest end all together, but we wanted to highlight and compare the GLM Flash Density to the areas with the highest Octane SpeedSandwich. Our end result was this GIF below:
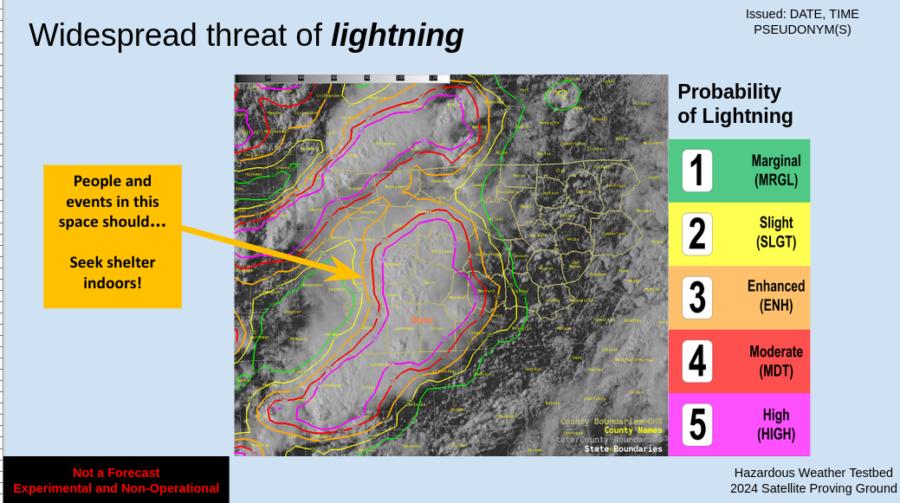
Today was a day to dive into GLM and Lightning probabilities. Once we settled on what we wanted to look at to make DSS related decisions, we realized that it wasn’t intuitive to the public. We needed a way to redesign the the Lightning Cast data to be easy to look at to the public. Because the NWS already has a color table for threats utilized by our National Centers, we decided to model our threat level based on the SPC’s convective outlook to create new colors for the contours. The following graphic is the end product of that:

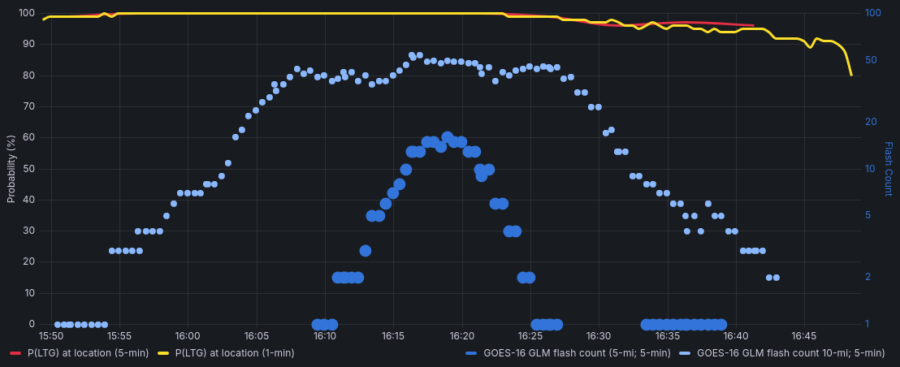
As the system moved past, identifying areas that we could issue the all clear on was our next priority. The LightningCast created a nice looking bell curve that lined up with the time that the MCS moved over the event and showed the trends of the storm began to wind down.


