
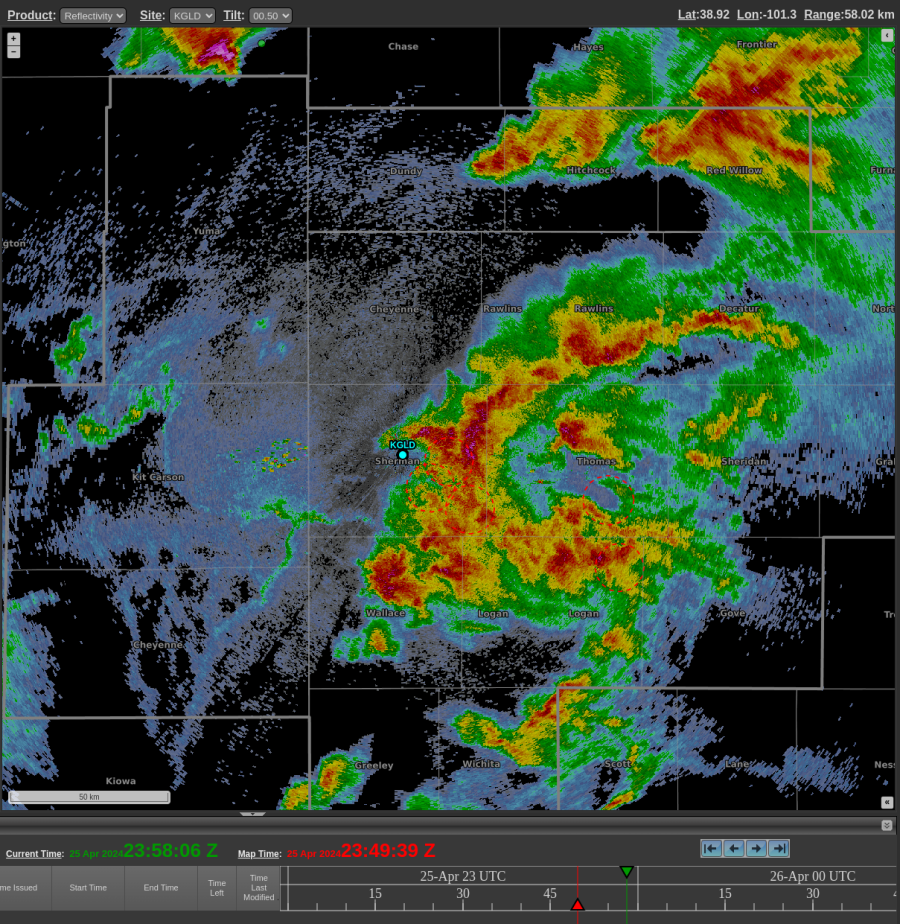
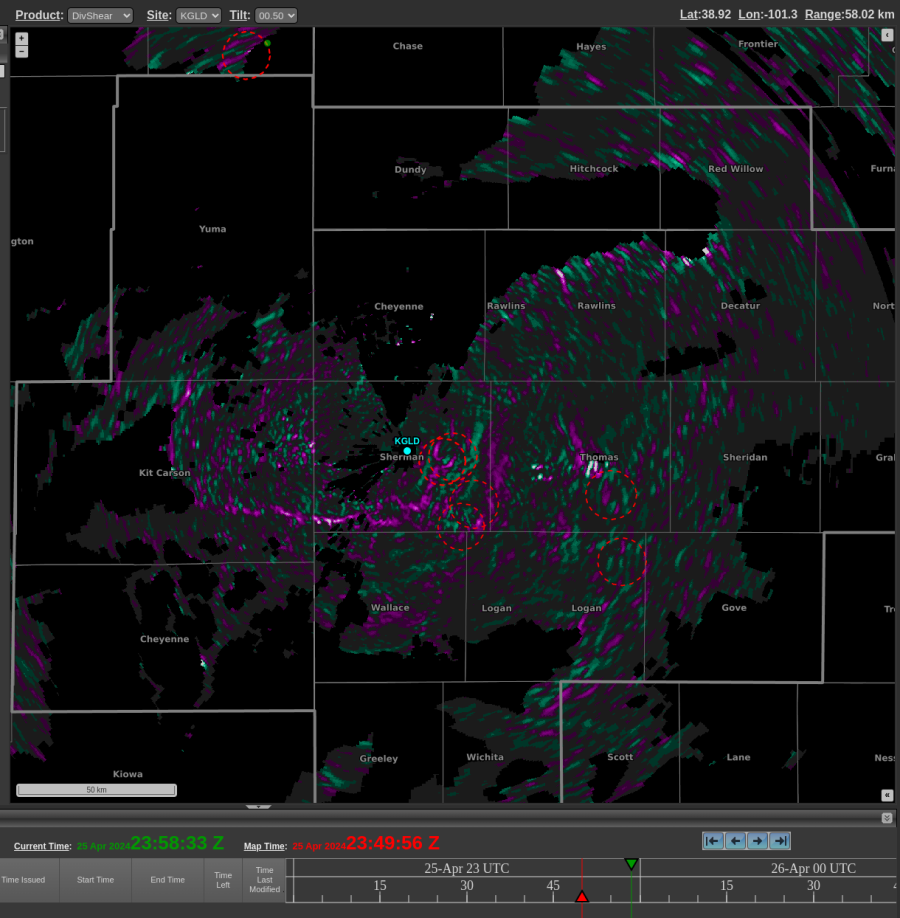
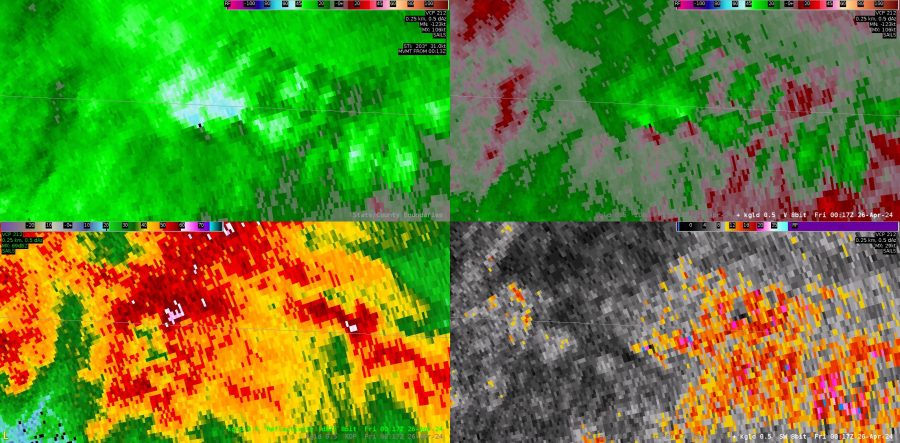
Here are some interesting examples from the perspective of northwest KS on April 25, 2024. This first example shows two boundaries southwest of the radar. The east-west oriented boundary shows up in DivShear, while the SW-NE oriented boundary does not really show up in DivShear. Radar velocity (not pictured) was showing 50-70 knots north of the northern boundary, while the velocity was not as strong on either side of the SW-NE oriented boundary.
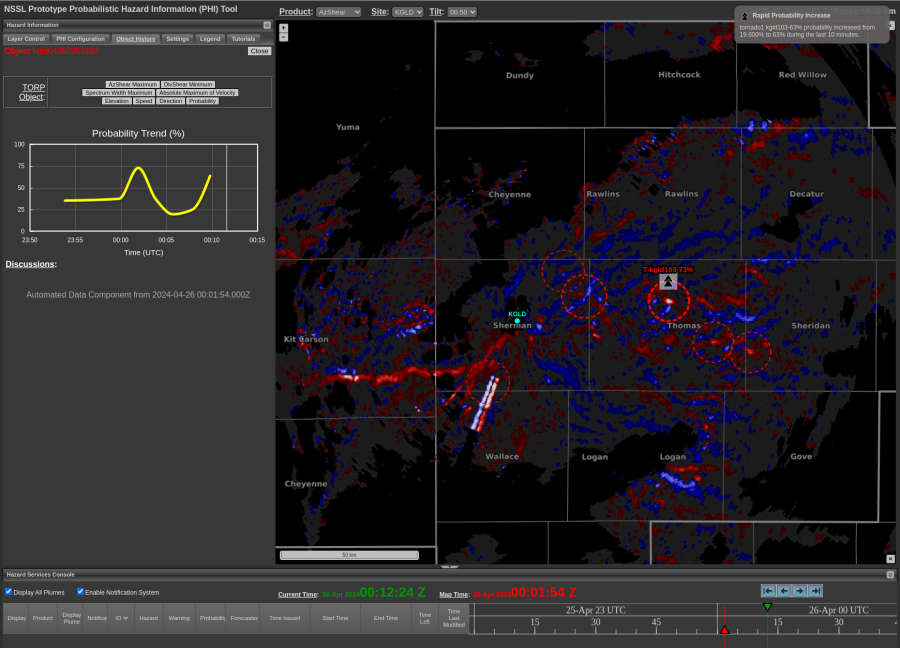
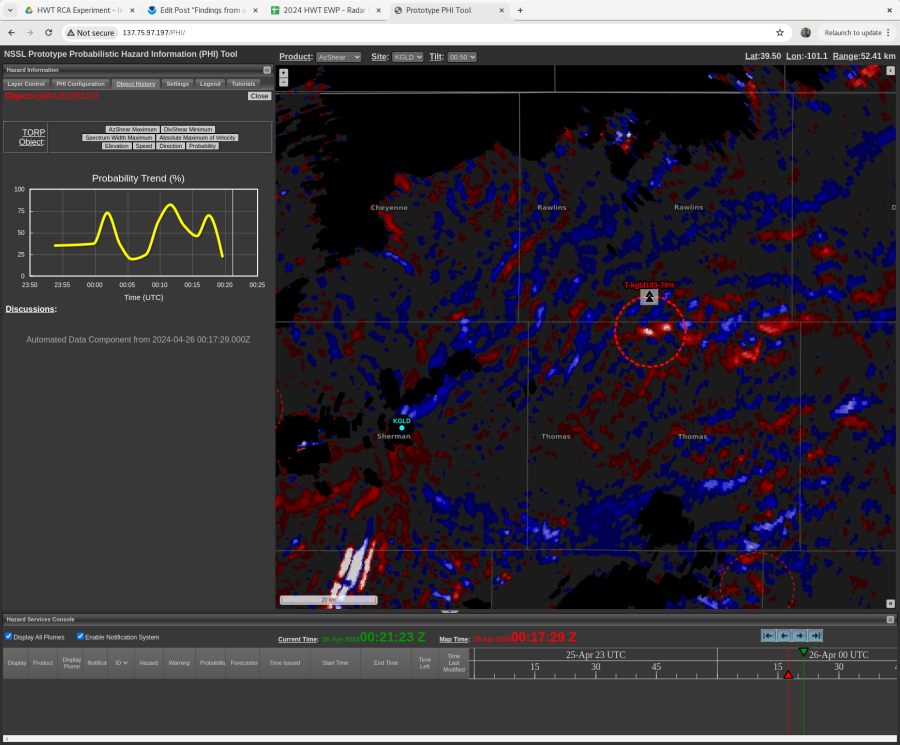
This circulation spun up quickly, but the TORP probs seemed to respond in kind, showing a sharp increase to near 70%. The circulation weakened briefly in subsequent scans (not pictured) before tightening again. A storm chaser reported there was “almost a tornado touchdown” north of Colby, KS around 0015z. Mesoanalysis (not pictured) seemed to suggest that this storm may have been north of a boundary, and perhaps lacked sufficient low-level instability for tornadogenesis.
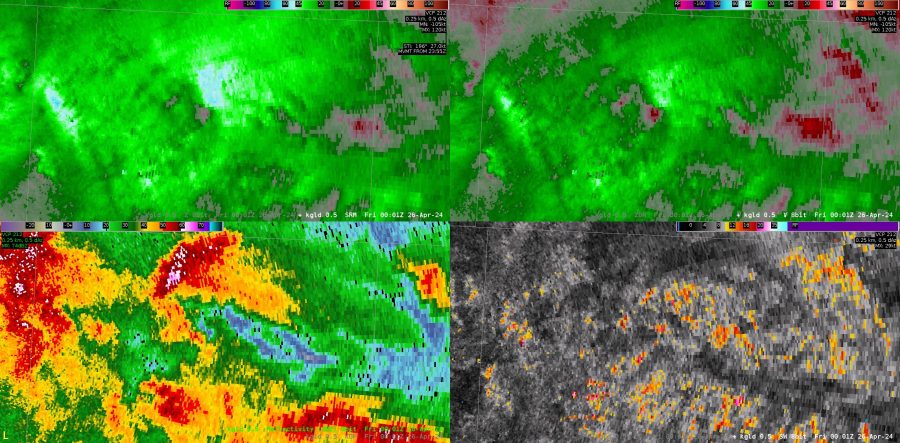
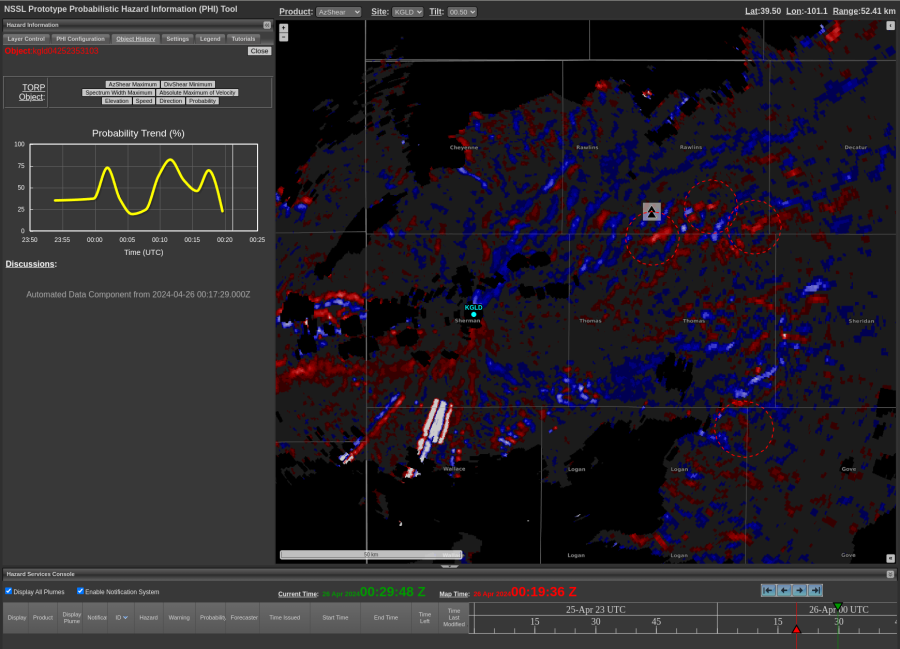
At 0017z, there appeared to be two circulations – shown below in both velocity products and AzShear:
Here is an example that caught my eye where beam blockage was significantly impacting the velocity field (not pictured) and resulting in sharp columns of alternating AzShear minima/maxima. However, TORP was NOT creating detections along these areas, even after turning off all of the auto filters.
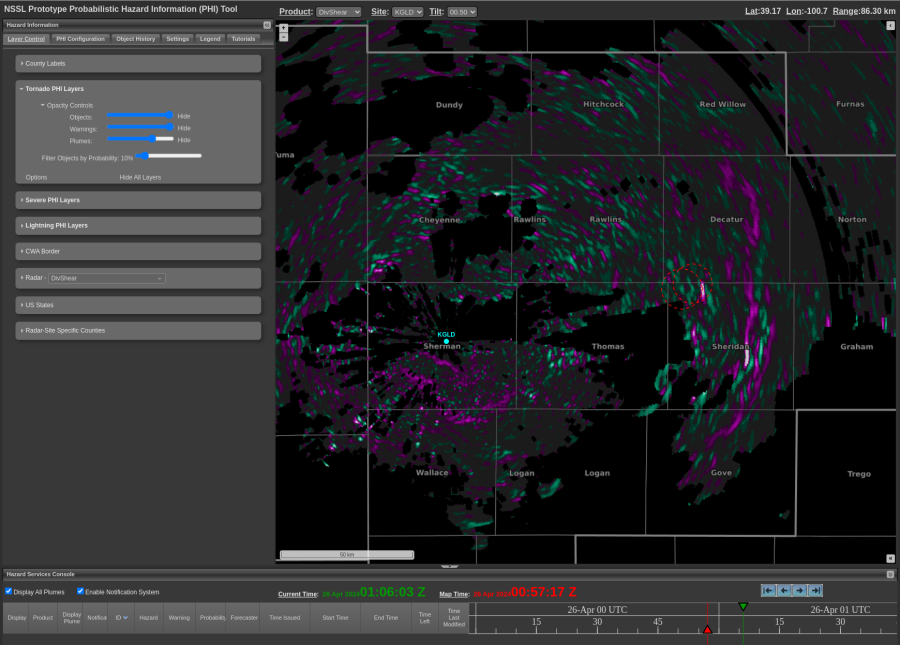
Here is a look at how the DivShear field appeared along a line of storms which had a tightening reflectivity gradient. Images were from 0057z on Apr 26 2024:
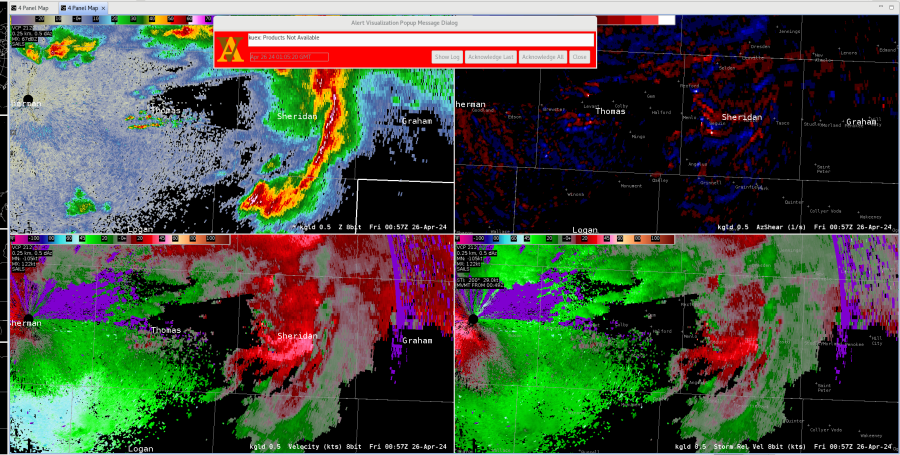
-Orange Lightning